Thoughts on using Renko Charts (cont.)This is based on my continued study of Renko charts. What follows are thoughts on how I would change my trading behavior and not because I've been successful making $$$ trading this strategy. Also, parts of this is original thoughts but the initial Renko strategy is based on work and ideas shared by @GcNaif.
I currently have a short position in Wheat based on these concepts (an OTM put for May) but any proposed trades I may state here will just be virtual via my optionsxpress account. Option trading seems like it would be difficult to profit from using this strategy unless you deal with options that are ATM.
This strategy is evolving in that I'm trying to change my decision logic from predictive to reactive. The Renko strategy is well suited for this type of trading. Note, to use Renko Intraday charts on TV, you have to pay for a higher Pro subscription.
Charts
My current strategy is to use the 4hr chart with either a 3 or 5 minute Renko. The blksz will vary based on the market. I have some examples below. If your trading strategy is that of a scalper, then maybe a smaller blksz will be more appropriate. For example, a recommended size for crude oil is 10 pips but a scalper may want to use 5 pips. By having the 4hr SxS with the Renko, you can see the actual price behavior for a block which may influence your timing of when/where to take a position.
Moving Averages
On both the 4hr and Renko charts, I use the following:
EMA 50/100/200
MA 20
DEMA 12/20
I use the 50/100/200 EMA to determine overall trend and also to discover points off support and resistance.
Indicators
TSI
4hr 14,4,3 / Renko 10,4,3
TSI (True Strength Index) Used to identify divergence between strength and price in addition to identifying potential buy or sell points at or near the 0 line.
Stochastics
4hr 14,3,3 / Renko 10,3,3
Used to identify transitions between overbought (cross down over 80) and oversold (cross up over 20). Additionally, during a prolonged move, stoch can pull back to the 30-50 area before returning back to the direction of the trend
DMI
4hr 14,14 / Renko 7,10
Used to determine the trend strength and somewhat the direction. When the ADX is at or below 20 and dropping, then there is no trend and price can be consolidating. During this time, identify a trendline, channel, pattern that may contain the price consolidation and wait for a breakout from it. The +/-DI can be used to verify a trade. Basically, when +DI crosses up over -DI, the high price at this cross is the buy trigger and vice versa for a -DI and sell trigger.
RSI
4hr 14 / Renko 10
MA of 9 and WMA of 45
PSAR
Renko .09, .09, and .18 Used to identify potential areas to place stops as market moves
Williams Fractal
Renko (default value) used to Identify when potential change in trend of price is occurring
Initial Strategy
1) Fractal appearance
2) DEMA 12/20 crosses with 2 blocks based on direction of trade
3) Stoch cross confirmation from oversold for buy and overbought for sell
If all three of these appear, then take a position until next fractal
Additional Filters
4) Only take a position with the trend based on the 50/100/200 EMA
5) Take a position on cross of +/-DI using the cross block's high or low as entry point based on buy or sell
6) Don’t take a trade if ADX is dropping through 20 until signs it his beginning to rise with the DI in direction of trend
Note: The ADX should remain at or below 20 for at least 6-10 blocks to make it a valid consolidation. Others, it is possible that it begins to move back up indicating that there is not consolidation but trend is strengthening.
Renko

xauusd - renko trend scan on dailyRenko supports the fact that gold is stil in an uptrend: keylevel to close the week is at 1240. To have a real confirmation for the next wave we need to see a breakout wich surpasses 1245 wich is very plausible given recent price action.
Advise:
Hold longs for conservative swings, add up on intraday lows for speculative positions.


#USDJPY Daily Renko ChartThis chart is similar to the one I posted 3 moths ago just in renko format.

Thoughts on using Renko Charts (cont.)Some of the following ideas are based on concepts outlined in this link: forexformation.com
And, from the book "New Concepts in Technical Trading Systems" by J. Welles Wilder, Jr.
In my previous ideas on renko charts, my main goal was to identify price consolidation based on ADX and then trade the breakout. In this idea, I'm going to add another concept which is using the Parabolic SAR that was originally described in J. Welles Wilder's book and also included in the link above. In addition to the PSAR, Wilder created the Directional Movement Indicator (DMI) which includes the ADX that I've leveraged too.
In his book, while describing the PSAR system, he added an alternate way to trade the system which is to use the DMI to determine when to trade. For example, if the +DI is dominate, then only trade to the up side based on PSAR signals and likewise, if the -DI is dominate, only trade when -PSAR signals are to the down side. If the market is not trending (the ADX is dropping to 20 or below), don't use this or stay out of market.
In Wilder's book, he suggested the parameter defaults that are used by TV but the above link uses an AF of .09 and increment of .09. I'm not sure why but it looks like this might work better with Renko Charts.
For Renko Charts, I'm using 3 views of a market (using crude oil as an example):
Daily TF: source/close | style/traditional | blksz/.50
2Hr TF: source/close | style/traditional | blksz/.25
5Min TF: source/close | style/traditional | blksz/.10
I use the daily TF to get a sense of what the market direction or bias, the 2Hr to look for patterns to trade and the 5Min to time or trigger a trade.
Using Wilder's suggestion to use the DMI to determine the trades to make, I'm going to start by using the daily TF DMI to drive which direction to make trade but use the 2Hr to identify the block/PSAR to make a trade and the 5Min to finalize the trade.
With this being said:
Daily TF: +DI is dominate to only take trades to upside
2Hr TF: PSAR signaled a buy several blocks back
5Min TF: Currently in a price consolidation and waiting for a breakout above 54 to potentially go long

Thoughts on Renko Charts (cont.)Since my last discussion on Renko Charts, I've made some changes to what my view of long term vs. short term is. Currently, I'm experimenting with a 2hr and 5 min chart
I'm continuing focus on my primary scenario of a breakout of price based on consolidation dictated by the ADX of the DMI. The general goal is to find 2hr charts that have an ADX reading of 20 or lower for at least 7-10 periods. During this period, identify a pattern (trend line, triangle, channel, support/resistance lines on price) and then look for price to breakout. However, instead of using the 2hr chart to identify the timing or trigger of the trade, use the 5min chart to make that determination.
Recent soybean chart can be used as an example. The last consolidation in price occurred at (B) in the form of a triangle on the 2hr chart. However, if you look at the 5min chart, the trade could have been triggered by its own breakout based on similar consolidation (A). Notice how the 5min chart expands on the actual movement of the 2hr chart.
An example of a continuation breakout can be seen in NGAS. Using this chart, (A) on the 2hr is just a one block pullback but the 5min chart shows a decomposition in price that ends with the ADX dropping below 20 forming a possible ascending triangle before price breaks out to the upside.
Corn is currently in an extended channel on the 2hr chart which has led to a similar pattern on the 5min chart. This could be a market that is ready to be traded on the breakout of the channel.

Thoughts on using Renko ChartsOne of the first links I came across which seemed to have the least complex strategy:
www.dailyfx.com
Another challenge I quickly came to was what settings to use on TV for Renko charts. A special thanks for @GcNaif for helping me with these configurations for Crude Oil (which I've used similar concepts for other markets listed below)
I've carried over some indicators and strategies I've used in past on other style of charts which include:
EMA's: 7/13/50/200
True Strength Indicator (TSI): 25/4/4
Stochastics: 25/3/3
Directional Movement Indicator (DMI): 14/14
For the settings of the Renko charts on TV, I'm using:
Source: close
Style: Traditional
Box size: This one varies by market and also by time frame
I think that Renko is supposed to be tick based with box size the price movement that happens before a box is rendered but with TV, this has to be emulated with a short time frame. For trading signals and short term bias determination, I used 3 minute chart as recommended by @GcNaif. In addition to the 3 min chart, I use a daily Renko chart for long term bias determination. Some links/strategies you will find suggest a 4 hour chart. One thing that you have to keep in mind is that a box won't be final until the time frame has closed. With a 3 minute period, this means that a block will be final every 3 minutes and that strategies can be based on this frequency. However, on a daily Renko using a 'source' of close won't be final until the close of the day (which in Crude Oil there can be alot of movement within a day). I've found it hard to make trading decisions on some of these markets using 4 hour higher.
Some key concepts:
short term bias is determined by 50/200 EMA on 3 minute chart. If 50 is above 200, the bias is up. If 50 is below 200, bias is down. If they're at or near each other, move to the daily chart and look at the same to determine the long term bias and use it.
TSI above 0 is bullish and consider buying. TSI belwo 0 is bearish and consider selling.
Stochastics crosses up over from 20, considered a buy signal soon. Stochastics crosses down over 80, consider a sell signal soon.
7&13 EMA cross over either up or down across price use as either buy or sell based on direction
Only make trades in direction of short term bias
First strategy I'm exploring: Breakouts using DMI.
This is based on the ADX of the DMI dropping below 20 for a period of time causing price to consolidate.
AUDUSD
Box size: 0.0001
On the current 3 minute AUDUSD chart, you can see a breakout based on ADX at point (A) on this chart. After the selloff, price consolidated again based on ADX and is currently at a state where it may breakout to the downside again (B). Looking at point (B), there are a couple of things I'm looking for as a confirmation based on pointes from above.
a) TSI drops below 0. A strategy using TSI is that above 0 is bullish and could be buying with a drop below 0 is bearish and should be selling
b) Stochs crosses over above 80 and drops
c) 7 & 13 EMA cross over price with bias down
SOYBNUSD
Box size: 0.01
NGAS
Box size: 0.01
Crude Oil
Box size: 0.10
Crude Oil looks like it is moving into a period of consolidation on the 3 minute chart but the daily chart's ADX is still strong. This coming week should help resolve the question if the ADX will continue below 20 on the 3 minute chart or if this was just a bounce and price will continue up.
The daily time frame is posted above. The 3 minute chart is below:
WHEATUSD
Box size: 0.01

DAX30: Daily - Renko Chart - Reversal point towards 10938 If red bar below green renko bar then I am expecting DAX to trade towards 10938.
This scenario is only valid if we form a red bar below the green one now.


Renko UP Trend FlipBeen waiting to use this new Renko chart on a trade and I believe this should be a good one.
Let's see how we do.

MIDTERM EUR/USD MAPStrong preformance and demand of USD and heavy printing by ECB. If we will be pushed by suprising managment switches by Yellen or Draghi outlook have to be changed. but i am at all bearish

LongTerm DAX-MapThere are still big Risk factors in play for the rest of the year caused by Brexit and tumbling southern Euro countries. Also keep in mind there are elections in the USA… So in Q3-Q4 it can be choppy also in the US Equities.
Nothing new from QE Front. ECB still pumping and ready to use all tools to archive thier goals. That normaly should chill out markets but vola. in DAX and EUR shows traders are still concerned ( as me to ). We see a Grind up in DAX last few days but my opinion is it is only dragged up by S&P. There is a Major RES in DAX around 10400-10.500 after that this is for me “potantial” longterm buy signal. All levels below are only daily for intraday trading.
Here my Longterm ( NOT INTRADAY TRADING!) DAX Map. But keep in mind that S&P can drag levels with it.

Brexit shows the wayBreak of support= Short
New lift=Long
Short to renko support
Long to advised or jump off if Renko crosses MA8 and closes one box below

This could be setting up to a very simple and profitable trade
For confirmation, use renko 1h + MA8 crossover.
Hold until renko negative crossover MA8
CCI seems to point to when its GO! just keep an eye on it
Its a clean and simple setup, you should not be able to do wrong here.
Company has attracted new investors and something is brewing, new members of board to be elected 21 june 2016.
Please do your own research on the rest.
www.intexresources.com
Double bottom is about to build in 0,4 area.
If you use geared broker, be carefull not to put SL too close
Sorry that Renko does not show progress, but you will see in right window.
Happy trading

EURUSD Downside Risk Still Favored Until This ChangesEURUSD momentum is still firmly to the downside at the moment. We are looking for opportunities to short unless we see momentum shift to the upside. If price crosses back into the range of the previous Renko bar based on the daily ATR(52) 92 PIP box, we will close any open short positions. Our bias will shift to long if we see a bullish Renko bar close on this chart.

Crazy attempt : Elliot wave on a Renko chartHey I got this crazy idea of doing a EW count on a Renko chart


Renko chartsNew to trading renko charts.Trading on the renko 1 day chart with a SMMA 4 and MA 9 with Ricardo Santos support and resistance seem to getting quite good results.use a RSI 14 as well to give the extra confirmation.

Possible breakdown in EURUSDPrice has been sideways but is developing a downward bias. Two targets for med and longer term.

EURPLN - PA heading towards level 4.37. Ichimoku and RenkoThe pair is currently bullish and will soon reach a level that it tested back in the mid of December. If it breaks this level, it may head towards the next Fib level (4.438). Note that the cloud is steeper in this new attempt and the PA may have enough force to break through. In this case, a long entry could be foreseen.

EURPLN - Trend analysis using RenkoRenko is fine to check support and trend as it removes time from an already too complex equation. For the EURPLN pair, we clearly see the supporting diagonal for the last 8 months. We also observe that the bounce of this summer is repeating right now with a similar intensity. By copying the pattern of this summer, we may expect a small correction towards the (C) point and then waves heading towards the high of end 2014 (which was subject to a testing attempt in december). This opens opportunities for a long trade as soon as the correction is over.

Tesla Stocks Renko Nearing Cloud Exit.On the daily 2$ Renko chart, TSLA is nearing it's exit oft the ichimoku cloud. This is a good sign for bears and would serve to be a profitable entry.
Enter Short If:
- 1 Renko box closes successfully under the cloud.
- Renko is below the Tenkan-sen
Exit::
- Trailing stop set 2 to 3 boxes behind entry.

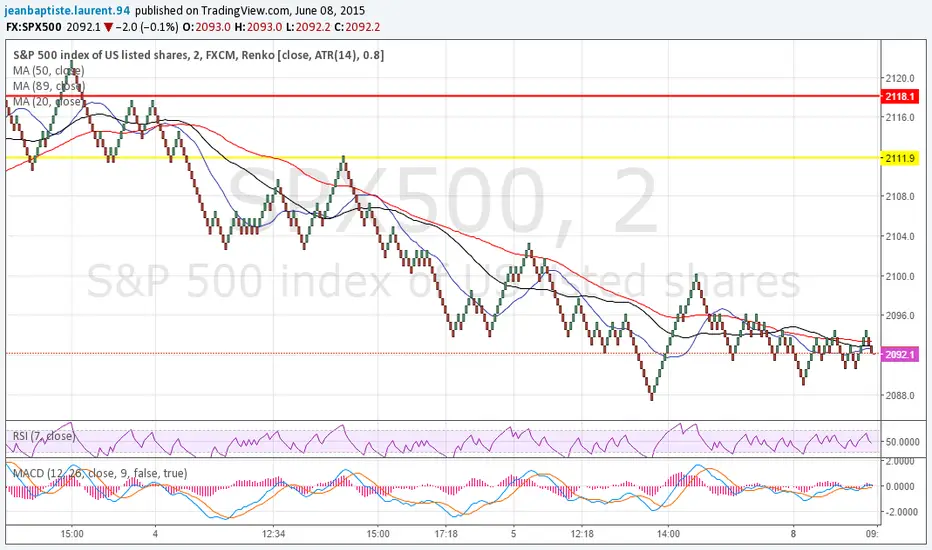
working on a new system ! working on a new system with ranko would love to have your idea ! it 's day trading system ! The basic are above the 89 ma ( red line on the chart ! ) looking for a long below the red line looking for short , need 2 more criteria before entering , Will need two red brick to enter short and 2 green to enter long , I will need to macd in my direction or at least loosing momentum . rules of exit are as follow will need a brick in the other direction to exit the position , 2 brick if I more than 8 bricks in the money , I would to for you to tell me what you think :)
as always don't hesitate to come by our group and drop a hello : www.facebook.com