Resistance_level

SPX: Above an Inflection Point.• The SPX is trying to do a bullish reaction today, just above the key support level at 4,100;
• This reinforces our view that 4,100 is the most important support level for the index, and only if it loses, we would see a sharper correction;
• For now, the index maintains its bullish bias, and there’s no technical evidence pointing to a reversal;
• In theory, it’ll seek the 4,218 next, to fill the last gap;
• What’s more, if it breaks yesterday’s high, it’ll completely reject the bearish candlestick, confirming the bullish bias;
• I’ll keep you updated on this.
Remember to follow me to keep in touch with my daily analyses!


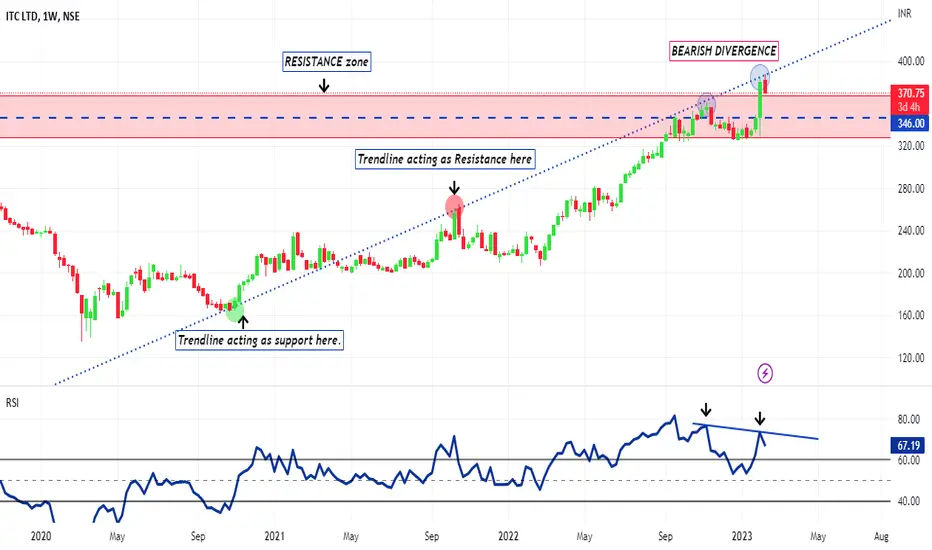
#ITC Bearish Divergence.#ITC Weekly chart showing BEARISH DIVERGENCE beween it's PRICE & RSI. Upward tredline firstly acting as support for the price & now acting as resistsnce for the price. If price holds itself below the resistance of trendline than peice can come toward downside in coming days.
GBPCAD Short Opportunity - FEBRUARYY RECAP Explanation within chart screenshot:
Looking for London downward momentum after DT formed - 2RR


GBP/USD time for a short?FX:GBPUSD
Hey Traders, I just want to share my ideas on XAG/USD with you. Maybe they could give you another perspective on the chart.

DODOUSDT Emerging From Bloodbath!DODOUSDT Technical analysis update
Currently trading at $1.55
Buy zone: Below $0.157
Stop loss : $0.125
Take Profit 1 : $0.190
Take Profit 2 : $0.235
Take Profit 3 : $0.280
Take Profit 4 : $0.350
Spot trade
Always keep stop loss
Thanks
Hexa

Can Dow Jones Rise Above Falling Trend Line?It's FOMC day! The markets have already priced in the 25bps rate hike so Powell's speech will be the most important thing today. A dovish Fed can help Dow Jones break the falling trend line and finally see acceptance above the resistance level of 34000. While I'm expecting a dovish speech from Powell today, the inflation fears are slowly fading away and recession fears are taking over, so in this environment, it's best to trade with minimized risk on stocks.

GBPUSD ShortFX:GBPUSD
After price broke its bearish structure on the 1H. Price continued to rally down. It then made a pullback with multiple candlesticks testing on the 50% Fibonacci retracement level creating a potential lower high and a resistance level. Entries are found on the lower timeframes like the 5min and 15min timeframes

Short on Weekly TradeSaw resistance at that highlighted price point .95571
Also from may and the long wick from Jan 23.
Good risk to reward ratio.
RSI also high at 72.74

Gold to test important resistance of $1920. Gold will test an important level of $1920 soon. Expect a move towards $1880 and extended move to $1848. TVC:GOLD

ENSUSDT Buy Signal!ENSUSDT Technical analysis update
If the ENSUSDT price breaks above resistance then we can expect a bullish move.
Buy zone: Below $16.00
Stop loss: $14.25
Take Profit 1 : $18.40
Take Profit 2 : $21.50
Take Profit 3 : $26.75
Take Profit 4: $36.00
Always keep stop loss
Thanks
Hexa

DYDXUSDT Resistance Zone Breakout!DYDXUSDT Technical analysis update
Buy zone: Below $2.65
Stop loss: $2.15
Take Profit 1: $3.05
Take Profit 2 : $3.70
Take Profit 3 : $4.20
Max leverage: 1x
Always keep stop loss

XAU/USD Possible BreakdownHello friends.
I saw a Strong Trendline Breakdown in Gold and Decide to share
with you my opinion.
I think Gold is in Overbought Area and It will record some correction
in coming days.
So i have some reasons for my opinion:
1-In Daily chart we can see a strong Bearish Engulfing candle (as you see in picture below)
2-in Daily chart we can see a Divergence Between RSI and Price in Overbought Area (as you see in picture below)
3-A Strong Bullish Trendline Breaks down in 1H.
4-We reach an important Resistance near the last High and psycological level of 2000.
so for this reasons i think Gold experience a little correction in coming days.
I think Gold will reach targets like 1900 an after that 1880.
I hope you like my idea and i will be happy if you share me your opinion too.
Thanks for reading my idea.
Just dont forget to set a good Stoploss and enter a trade with at least 1:1 R/R.

COMÍ Resistance and Support This is not a financial advice, but only a personal opinion
Since my last prediction and trend analysis was accurate thanks to god first,
I assume since it stabilized over the 50.834 which was the previous resistance, the next resistance will be @ 51.870 and possibly 52.491.
The stronger support is @ 49.382 and @ 47.96
Please follow and like if you would like to see more trend analysis and stock reviews

GBPUSD SELL RESISTANCE LEVELHello ! According To me GBPUSD Will Fall Next Week . GBPUSD is Around Near Resistance Level Of D1 Chart . You Can Short It From 1.2440 Price With Stop Loss 1.2510 & Take Profit Should Be 1.2310 Level . I Hope We Will Make Good Pips From This Trade .
Thank You .

SELL AUDUSD AT RESISTANCE LEVELHello ! According To Me AUDUSD Will Fall From Resistance Area . AUDUSD is Now Trading Near Daily Resistance Area . When Price Reach At 0.7135 Level Then You Can Take Short Position With SL 0.7180 & TP 0.7050 Price . I Hope We Will Make Good Profit From This Trade .
Thank You .

AUDCHF I Short from top of channelWelcome back! Let me know your thoughts in the comments!
**AUDCHF Analysis - Listen to video!
We recommend that you keep this pair on your watchlist and enter when the entry criteria of your strategy is met.
Please support this idea with a LIKE and COMMENT if you find it useful and Click "Follow" on our profile if you'd like these trade ideas delivered straight to your email in the future.
Thanks for your continued support!

Bitcoin support and resistance for daily tradingHere's four levels of support and resistance to apply based on pvsra high volume candle.
Enjoy your trading !

BTCUSDT BearishBTCUSDT is at its resistance level and also forming double top formation.
Also we can there is a bearish divergence on The relative strength index (RSI) and also BTC is at very mush over bought position.
As we saw on 13 sept 2022 there was a huge bearish candle on this level.
BTC can fall down from this point, we have to wait for today's candle closing, bearish side seems strong.

Short EURCAD, ResistanceSell EURCAD, eurcad is on very strong support and we can short this pair with very minimal stop loss. Trade at your own risk

Gold: Profit takers continue to pushToday’s update, profit takers look to be moving in on gold. Could this become a new retracement that takes price back to the main uptrend point?
After sellers managed to snap buyer momentum yesterday, we are seeing more selling so far today. Price, for now, looks to have found resistance from 1920 up to 1929. Pressure is on the fast uptrend, and we are wondering if sellers can break it. Will we see a further short-term downside?
Today’s video is not looking for short-selling opportunities due to the current uptrend. We will be looking to see if buyers can resume the trend once this reaction or minor correction finishes.
Enjoy your Tuesday.
