BNB/USDT 4H chart reviewKey levels:
• Resistance: 845.64 → 867.39 → 898.75
• Support: 819.84 → 788.98 → 765.21
• Current price: ~ 835 USDT
Structure:
• The upward trend is still in force (black rising trend line).
• After the summit around 867, the market made a correction to 819 and bounced.
• Now the price consolidates between 819 and 845, just above the trend line.
Scenarios:
1. Bullish (advantage of buyers)
• If the price stays over Trendline and 845, a possible attack on 867, and then to 898.
• Confirmation of increases will be closed with a 4h candle above 845.
2. Bearish (sellers' advantage)
• Support loss 819 = weakness signal.
• Further goals: 789 and 765 (key support).
• Trendline fracture will further strengthen the pressure of supply.
📊 Summary:
• As long as 819 and the trend line hold the advantage on the bull side.
• 845–867 is a strong resistance zone - here you have to be careful about the implementation of profits.
• Breaking below 819 will open the way to a deeper correction.
Resistence

ETH/USDT 4H chart review1. Trend
• Direction: a downward trend, confirmed by a series of lower peaks and lower holes.
• The black line is a downward trendline - a course from a few candles reflects it down.
• The increase in volume in declines suggests that the seller is still dominating.
⸻
2. Key levels
• Resistance:
• 4 634 USDT - the last strong resistance from which the price has reflected.
• 4,527 USDT - local resistance, coincides with Trendline.
• Support:
• 4,415 USDT - the current level of support tested, the price consolidates here.
• 4,300 USDT - another strong level of support; Breaking can accelerate the inheritance.
⸻
3. Current situation
• The price has fallen below 4,527 and is currently supporting 4 415.
• The candle formation on support is mixed - small green candles after a large red impulse suggest a temporary pause or a correction attempt.
• The volume on inheritance candles is higher than on growth → Seller still stronger.
⸻
4. Scenarios
🔴 Negative (more likely if the sales volume persists)
• If 4,415 is pierced with an increased volume, the purpose of the inheritance is 4,300 USDT, and in case of further pressure even 4,200.
• The downward trend is maintained.
🟢 positive (less likely at the moment)
• If the course reflects from 4 415 and breaks Trendline + Level 4 527, then possible movement in the direction of 4 630.
• This requires an increased volume of buyers.

BNB/USDT 1DTrend and market structure
• The price moves in an upward trend from the hole around 730 USDT, maintaining support on the trend line (orange line).
• Current price: ~ 840 USDT, close to important resistance at ~ 862 USDT.
• Another strong resistance is located at 940–950 USDT.
• The next support is 809 USDT (local horizontal level) and 758 USDT (earlier hole).
⸻
Medium walking (SMA)
• SMA #1 (red) is below the price - this is a growth signal.
• SMA #2 (green, long -term) is also below and inclined up - confirms the upward trend.
• SMA #5 (blue, very long) is far below - the market is still in the growth phase.
⸻
Indicators
• MacD - MacD line pierces the signal line from below, which is a buy signal. The histogram is slightly positive.
• RSI - ~ 66 points, grows towards the purchase zone (70). There is no extreme yet, but it is approaching - the risk of correction after breaking the resistance.
⸻
• (more likely with current dynamics): breaking the level of 862 USDT and continuation in the direction of 940 USDT. There are more profit realizations possible here.
• Bear: rejection from resistance and decrease in the direction of 809 USDT or even a trend line test and level 758 USDT.

ETC/USDT 1D Chart1. Trend and price structure
• The price is currently 23.71 USDT (+6.75% on the day).
• After an earlier inheritance trend (yellow dotted line - trend line), you can see an attempt to break up and maintain above SMA 1 (approx. 22.30 USDT).
• The next resistance is 24.50 and 26.00 USDT - you can see that the supply of supply was already 24.50.
• The next support is 22.30 and stronger at 21.02 USDT.
2. Medium walking (SMA)
• SMA #1 (red) - short -term, the price is above, which is a bull signal.
• SMA #2 (green) - medium -term, also below the current price, which supports the upward scenario.
• SMA #5 (blue) - long -term, is lower (approx. 18.85), so the main trend is not completely inverted yet, but the momentum is growing.
3. MacD
• The MacD line pierced the signal line from the bottom - buy signal.
• The histogram has gone down in positive values - the growing pressure of buyers.
4. RSI
• RSI around 55–60 - far from the purchase zone (70+), so theoretically there is still space for growth.
• RSI has pierced its average, which is confirmed by bull's sentiment.
5. Scenarios
• Bull: Maintenance of a price above 22.30 and a possible retest 24.50 with an attempt to break in the direction of 26.00. At 26.00 - road to 27.00–28.00.
• Bear: a decrease below 22.30 opens the road to 21.02, and a deeper descent - around 19.80 or 18.85.
6. Applications
• Short -term - advantage of buyers, but strong resistance at 24.50.
• A good moment for swing traders to watch the reaction at 24.50.
• For long -term positions - full confirmation of the trend reversal only after 26.00.

BTC/USD 1D1. Price Structure and Patterns
Medium-Term Trend: Since mid-June, the price has been consolidating between ~$112,000 and ~$121,000, but with a slight upward slope.
Upward Channel: Marked with orange lines – the current candlestick is near the top of this channel.
Triangle Breakout: The white dashed line indicates an upward breakout from the converging triangle (symmetrical) formation, which could signal continued growth.
2. Support and Resistance Levels
Nearest Support:
USD 117,009 (Fib. Level 0.236 and local low)
USD 115,912 (SMA200 – red line)
USD 112,167 (lower consolidation boundary and prior support)
Nearest Resistance:
USD 121,151 (Fib. Level 0.382)
USD 123,966 (Fib. Level 0.5 – key psychological and technical resistance)
USD 126,781 (Fib. Level 0.618 – strong resistance)
USD 130,788 (Fib. Level 0.786 – breakout target)
3. Technical Indicators
MACD: The MACD line is beginning to intersect with the upside signal line – suggesting the beginning of upward momentum.
RSI: 59 – rising, but not yet in the overbought zone (above 70). This means there is room for further growth.
Moving Averages:
The SMA50 (~$114,020) and SMA200 (~$115,912) are below the price – a bullish pattern.
The price has rebounded from the SMA50, which is often a good starting point for further growth.
4. Scenarios
Bullish (more likely at this point)
If the price holds above $118,000 and breaks $121,151, a quick move to $123,966 and then $126,781 is possible.
Confirmation – the daily candle closes above $121,151 on increasing volume.
Bearish
If the price falls below $117,000, a retest of $115,912 is possible, followed by $112,167.
A break of $112,167 could signal a downtrend reversal.
5. Key Observations
Volume is increasing on bullish candles → a sign of accumulation.
The price is near strong resistance at $121,000–$122,000 – a correction is possible here.
Longer term (Fib from the March low), there is potential for a move towards $130,000–$135,000 if the trend continues.

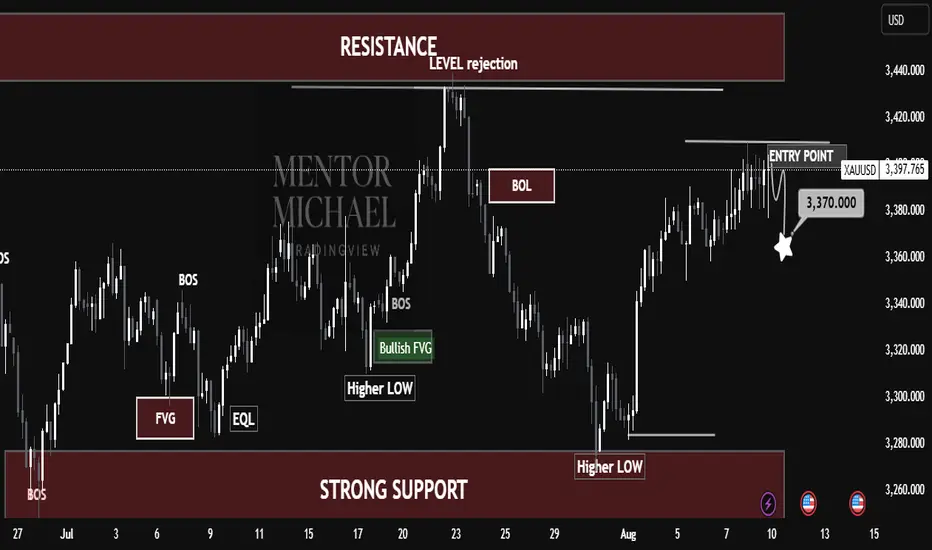
Gold on the Verge of a Big Move – Key Level in Focus!Gold on the Verge of a Big Move – Key Level in Focus!
Market Structure:
BOS (Break of Structure) signals have confirmed bullish momentum in prior swings.
Price created a Bullish FVG (Fair Value Gap) around mid-July, which provided demand for the next upward leg.
Consecutive Higher Lows indicate that buyers remain in control.
Key Levels:
Strong Support: $3,260 – A major demand area where buyers have stepped in multiple times.
Resistance Zone: $3,420–$3,440 – This is a significant supply area where price faced rejection earlier.
BOL (Breakout Level) around $3,390 – Price recently tested and is attempting to break above.
Trade Setup Highlighted:
Entry Point: $3,397 (short bias suggested by chart structure at resistance)
Potential Target: $3,370 – aligns with minor liquidity grab and possible retest of broken structure.
Market Logic:
Price is currently testing a resistance level rejection zone.
The expectation in this setup is a short-term pullback to collect liquidity before a possible continuation.
If $3,370 holds, bulls may resume toward the higher resistance zone at $3,420+.
Educational Takeaway:
BOS indicates a shift in control (bearish BOS = sellers taking over; bullish BOS = buyers taking over).
FVG is a gap in price that often acts as a magnet for retracement.
Higher Lows are key signs of a bullish trend.
Support & Resistance act as decision zones where traders can anticipate reversals or breakouts.
📌 Summary:
XAUUSD is in a bullish structure but is currently testing a resistance rejection zone. A short-term retracement to $3,370 is probable before any continuation higher. Swing traders should watch price behavior at support for a potential long continuation setup.
ETHUSDT 12H chart uptrend1. Breaking out of the downward channel
• Black lines show an earlier inheritance channel.
• The course struck the mountain and it is quite dynamically, which is a strong upward signal.
2. Current price
• ETH is around USD 4,274, just below the resistance at USD 4,304.
• Another resistance is 4,484 USD (potential target if the upward trend persists).
3. Support
• The next support: 4,048 USD - if the course is corrected, then there may be the first "test".
• stronger support below: USD 3,930, $ 3,709, $ 3,487.
4. Indicators
• MacD: MacD line strongly above the signal, the histogram is growing - confirms the upward trend.
• RSI: around 75 - close to the purchase zone, which can mean a short -term correction, but with a strong RSI trend can stay high for a long time.
5. Scenarios
• Bull: Punction and maintenance above USD 4,304 can open the road to 4,484 USD and possibly higher.
• Bear: rejection from USD 4,304 and a descent below 4,048 USD may cause a deeper correction in the direction of $ 3,930 or even $ 3,709.
📌 The short -term market is warmed up, so a small pullback is possible, but the structure looks very bullshit after this burst from the downward channel.

ETH/USDT 12h chart1. Punction of the downward trend
• The black inheritance trend line has been broken up - this is a strong signal of Bycza.
• Breaking was confirmed by a strong candle movement and high growth dynamics.
⸻
2. Key levels of support and resistance
• Support:
• 3930 USDT - previous resistance, now the defensive zone with possible correction.
• 3709 USDT - deeper support.
• 3488 USDT - critical support, below which the upward trend would be negated.
• resistance:
• 4048 USDT - current local resistance (the candle touched and lightly reflected).
• 4304 USDT - another strong resistance.
• 4484 USDT - long -term resistance and potential goal when continuing to grow.
⸻
3. RSI
• RSI is around 70 - close to the purchase zone.
• suggests the possibility of a short correction or consolidation before the upward trend continues.
⸻
4. Scenarios
Bycza (continuation of growth)
• Maintenance above 3930 USDT.
• Breaking over 4048 USDT opens the road to around 4300–4480 USDT.
Bear (correction)
• Rejection to USDTT 4048 and a decrease below 3930 USDT may bring a rate to around 3709 USDT.

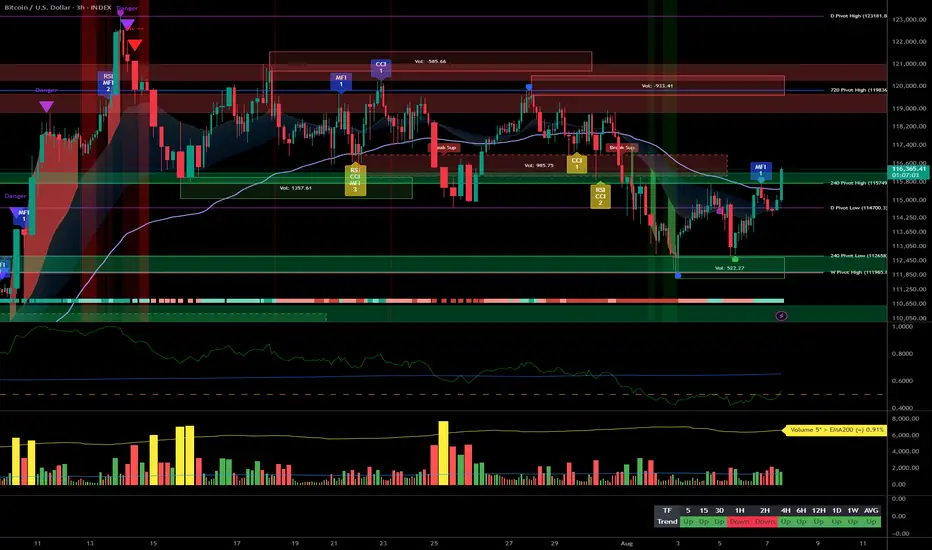
BTC Support Tested, Mixed Cross-TF Signals, Tactical Caution__________________________________________________________________________________
Technical Overview – Summary Points
__________________________________________________________________________________
Momentum & context: Bullish bias confirmed on higher timeframes (1D/4H), but bearish divergences appearing from 2H downward.
Major support/resistance: 114,600–115,000 and 114,667 hold as the critical zone. Key resistance: 116,900–117,000 must break for a bullish trigger.
Volume: Normal on HTF. Very high volumes detected on 30min/15min during the 116,000+ resistance test (climax/reversal risk).
Multi-timeframe behavior: Risk On / Risk Off Indicator = “Strong Buy” from 1D to 1H, short-term sellers active below 2H (ISPD = Sell on 15min).
__________________________________________________________________________________
Strategic Summary
__________________________________________________________________________________
Overall bias: Bullish structure preserved, but fragility evident on intraday.
Opportunities: Tactical buys possible on 114,600–115,000 (stop <114,000) or strong breakout above 116,900.
Risk: Clear break below 114,000 = risk of drop to 110,000. Volume climax/ISPD Sell below resistance = profit taking advised.
Macro catalysts: Ongoing geopolitical news (US/Russia/China), volatility during US announcements; post-Fed digestion.
Action plan: Strict monitoring of ETF flows/funding/US news. Cautious accumulation on daily/4H, short-term shorts only if confirmed by lower timeframe signals.
__________________________________________________________________________________
Multi-Timeframe Analysis
__________________________________________________________________________________
1D: Strong upward bias, price at major support, calm volume.
12H/6H/4H: Robust sectorial momentum (Risk On / Risk Off Indicator “Strong Buy”), daily/4H supports holding, initial bearish signs on 2H/1H.
2H/1H: Growing fragility: “Down” trend confirmed on 2H, momentum loss, buyer exhaustion visible.
30min/15min: Very high volumes under resistance, ISPD Sell 15min: short-term correction alert. Overbought microstructure, trigger risk if rejection at 116,000–116,250.
Cross-TF summary: Market mostly “Up”, but tactical vigilance around supports, increased caution above 116,000.
Summary:
- Bullish structure maintained on daily/4H, but top/reversal warning signals on brief lowest TFs (15/30min).
- 114,600–115,000 pivot zone is decisive: holding = increased stabilization/accumulation probability; break = risk of extension down to 110,000.
- Active monitoring of ETF flows/funding/news is essential.
__________________________________________________________________________________
Macro & Bitcoin Analysis (Twitter Summary)
__________________________________________________________________________________
Geopolitical risks remain high, US/China protectionism & Fed on hold: crypto market in wait-and-see mode.
BTC broke 116k, entered low-liquidity zone; rebound remains “fragile.”
ETF flows: moderate return to buying, funding neutral.
Possible post-pullback accumulation signal, but needs confirmation.
Strategy: swing buy on defended/major supports, strict management if short-term seller signals (volume/ISPD).
__________________________________________________________________________________
Action Steps
__________________________________________________________________________________
Buy on 114,600–115,000 zone if confirmed by daily/4H, stop loss <114,000.
Re-buy or more aggressive swing on clear breakout above 116,900–117,000.
Take profits/short if clear rejection 116,000+ with volume climax/ISPD Sell.
Monitor macro (US events), ETF flows, funding rate, volume behavior.
Chainlink (LINK/USDT) from 1D interval📈 Trend and Market Structure
Current trend: Upward (higher lows and highs)
The price is moving within an ascending price channel, marked by two black trend lines.
The recent rebound occurred from support around 14.83 USDT, which coincides with the lower boundary of the channel.
🔍 Key Levels
✅ Resistance (green horizontal lines)
18.98 USDT – local high
21.16 USDT – main resistance, possible target after breaking $19
18.27 USDT – current local resistance zone, currently being tested
17.62 USDT – mid-range resistance
🛑 Support (red horizontal lines)
15.97 USDT – first local support
14.83 USDT – important support (price reaction, trend confirmation)
13.30–13.50 USDT – key demand zone
12.50 USDT – lower historical support
📊 Indicators
🔄 Stochastic RSI
%K and %D lines cross from below → buy signal
Currently emerging from oversold levels (< 20), which could indicate a continuation Growth
📉 MACD
The histogram is decreasing, but the rate of decline is slowing.
Possible buy signal if the MACD line crosses the signal line from below.
🔊 Volume
Increasing volume during gains, lower volume during corrections – confirms bullish strength.
The recent decrease in volume may indicate consolidation or preparation for the next move.
📌 Scenarios
🟢 Bullish Scenario:
Uptrend maintained within the channel.
Breakout above 18.27 and 18.98 → possible rally to 21.16.
Confirmation by MACD/Stoch RSI.
🔴 Bearish Scenario:
Break of support at 15.97 and the trend line → possible decline to 14.83 or lower (13.30).
MACD may continue to decline if a strong rebound is not achieved.
🧠 Summary
Trend: Bullish
Price is currently testing resistance at 18.27.
Key support levels to watch: 15.97 and 14.83.
Indicators are providing potential buy signals, but confirmation will be needed on higher time frames or on stronger volume.

BNBUSDT 4H Review🔍 Technical Structure
📉 Descending Channel (orange lines)
The price was moving in a clear downtrend within the channel.
A breakout from the channel to the top occurred, which is a potentially bullish signal.
The price is currently testing a level above the channel—a classic retarget (retest) of the breakout.
🟩 Support/Resistance Levels (green and red lines)
✅ Support:
760.97 USDT – currently tested as support after the breakout from the channel.
739.81 USDT – local support, previous resistance.
717.89 USDT – stronger support, lower boundary of the channel.
❌ Resistance:
779.87 USDT – short-term resistance.
809.72 USDT – key resistance on the higher timeframes.
📊 Volume
Volume increased during the breakout from the channel, supporting its credibility.
It is currently declining slightly, which may suggest consolidation or waiting for another impulse.
🔄 Stoch RSI Oscillator (at the bottom of the chart)
Currently leaving the overbought zone (>80) and heading down.
Potential bearish or consolidation signal for the coming sessions.
🧠 Scenarios
1. Bullish Scenario (continuation of the breakout):
If the 760.97 level holds as support,
A move to 779.87 is possible, followed by a test of 809.72.
2. Bearish Scenario (false breakout):
If the price falls below 760.97 and fails to stay above 739.81,
A retest of 717.89 or even a return to the descending channel is possible.
📌 Conclusions
Currently, the key level is 760.97 USDT – maintaining it will confirm the bulls' strength.
Oscillators suggest a possible correction or consolidation.
For a long position: a good place to test 760.97 with a narrow SL below 739.81.
For a short position: a potential signal if 760.97 is not maintained.

ETHUSDT 4H Chart Review🔍 General Technical Context:
Prior Trend: Upward (strong rally from around 3,150 USDT).
Current Structure: After breaking out of the ascending channel, there was a strong decline, but is currently rebounding upward – it looks like a test of prior support as resistance.
📈 Key Horizontal Levels (Support/Resistance):
Resistance:
3,794 USDT – strong resistance resulting from the prior high (green line).
3,943 USDT – high of the ascending channel.
Support:
3,504 USDT – prior support, now potentially acting as resistance (red line).
3,383 USDT – July support.
3,132 USDT – strong base support, potential correction low.
📉 Technical Patterns:
Broken Upward Channel (orange lines): A clear downward breakout suggests a weakening of the previous trend.
Downward Trendline (purple): The current price is approaching it – a test and reaction (bounce or breakout) may occur.
📊 Stochastic RSI (oscillator at the bottom):
The indicator is entering the overbought zone (>80).
This may indicate an impending slowdown or correction, especially if the price encounters resistance at the purple downward trendline.
🔮 Scenarios:
✅ Bullish (if the breakout is upward):
A breakout of the purple trendline and resistance at 3,794 USDT could signal further gains towards 3,943 USDT or higher.
Confirmation could come from a retest of the purple line as support.
❌ Bearish (if resistance rejected):
Rejection from the trendline or the 3,794 USDT zone = possible correction to 3,504 or 3,383 USDT.
Break of 3,383 = potential decline to the 3,132–3,150 USDT zone.
🧭 Conclusion:
The market has regained strength from the local low but is at a potentially strong resistance zone.
Stochastic RSI overbought + near resistance = high risk of a near-term correction.
The key will be price performance within the purple trendline and 3,794 USDT.

BTC/USD 1D Chart 🔼 Resistance:
• USD 123,263 - local peak, strong resistance (green line)
• USD 119,120 - level tested several times, recent reflection
• 116,224 USD - zone of previous consolidations
🔽 support:
• 110,945 USD - SMA #2 (movable average), tested in the past
• 107,804 USD - local hole
• USD 103,542 - strong support from the past (historical retention of declines)
⸻
📊 Technical indicators
📉 Trend:
• The yellow upward trend line has been broken - a potential bull weakness signal.
• The candle pierces the trend line from the bottom - it is possible to change the direction to a side or downward trend.
📈 Medium walking (SMA):
• The red SMA #1 line acted as dynamic resistance.
• The price is currently testing SMA #2 as support.
• SMA #5 (blue, approx. 98,600 USD) is very strong long -term support.
📉 Macd:
• The MacD line is below the signal line → Bear signal (Bearish).
• Red histogram - inheritance impetus is growing.
📉 RSI:
• RSI has fallen below the level of 50 → the advantage of supply.
• Currently, it is approaching the supply of supply overload (<30), which can herald the technical reflection.
⸻
🔮 Scenarios
✅ Scenario Bycza (Bullish):
• Maintenance of a price above 110.945 USD (SMA #2).
• Return above the trend line or testing USD 116,224 and piercing up.
❌ Bear scenario (Bearish):
• Loss of support to 110.945 USD → decrease to USD 107,800.
• If this does not keep the course, the next strong level is USD 103,500.
⸻
🧠 Applications:
• Short -term: the market looks weak, the candle breaks the upward trend.
• Medium -term: still in the game, but if it does not reflect from the current levels, a greater correction is possible.
• Commercial decisions: It is worth waiting for confirmation of the direction (reflection from support or continuation of declines).

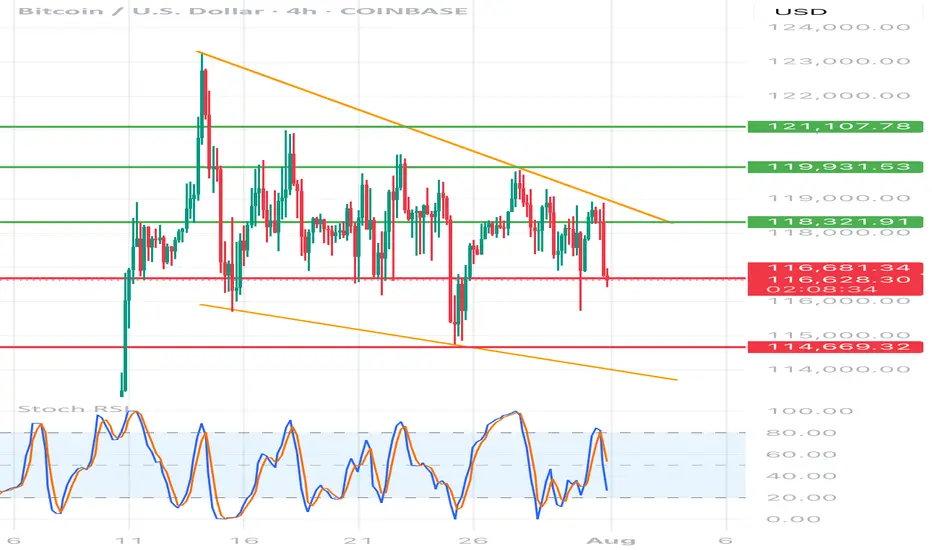
BTC/USD 4h chart🔸 Formation: Triangle descending (descending)
• Upper trend line (orange) - inheritance, connects lower and lower peaks.
• Lower support line (red) - approx. 116,700 USD - key support, tested many times.
🔻 Support
USD 116,700
Tested several times, currently threatened
🔻 Another support
USD 114,669
Target level when struck with a triangle
🔼 Resistance
USD 118,321
The nearest resistance - the former level of support
🔼 Resistance
USD 119,931
Local peak
🔼 Strong resistance
USD 121,107
Upper level of structure
📉 STOCHASTIC RSI (lower indicator)
• Line cutting and a decrease in the purchase area (> 80) towards the center.
• No extreme sales signal, but the trend begins to be negative.
⸻
📌 Applications and possible scenarios:
🔻 Bearish script (more technically likely):
• If BTC breaks below USD 116,700 with a 4H candle closure, possible:
• a decrease around USD 114,669 (lower limit of the triangle)
• Even lower - around 113,500-112,000 USD with an increased volume
🔼 Bullly script (less likely but possible):
• needed quick breaking above USD 118,300 and maintaining above this level
• Then the goal will be USD 119,931, and then possible traffic up to USD 121.107
⸻
📍 Summary:
• We see classic triangle descending-pro-draft formation.
• Support 116,700 USD very close to breaking - if it falls, down movement can be dynamic.
• Stochastic RSI coincides with the deterioration of the moment.
• The inheritance scenario seems dominant, unless there is a strong demand and over 118,300 USD.
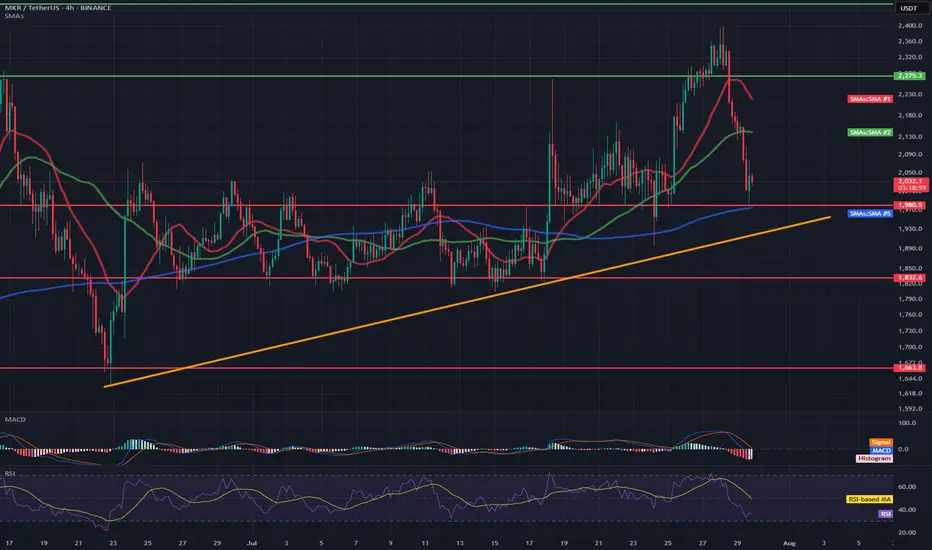
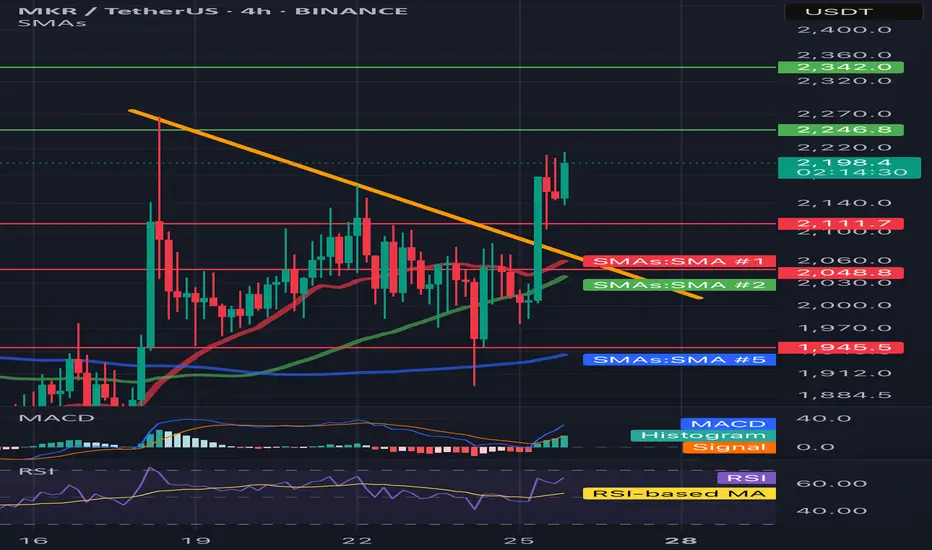
MKR/USDT 4H Chart📉 Short-term situation:
The price is currently trading around 2028 USDT, after a sharp decline from around 2273 USDT (resistance).
The support level around 2000 USDT is currently being tested (coinciding with the SMA 200 – blue line).
A dynamic uptrend line (orange) is also visible, which could act as a key support level in the event of further declines.
🔍 Support and Resistance Levels:
Resistance:
🔴 2188 USDT – recent local high and convergence with the SMA 21.
🟢 2273 USDT – major resistance; previous rebound and point of significant price reaction.
Support:
🔵 1980 USDT – local support + SMA200.
🟠 Uptrend line (~1940–1960 USDT).
🔴 1832 USDT – stronger horizontal support with multiple confirmations.
🔴 1623 USDT – very strong support, from previous lows.
📊 Technical indicators:
RSI (Relative Strength Index):
Current value: ~42, neutral, but approaching the oversold zone (<30).
The RSI is falling rapidly, suggesting selling pressure, but a reaction is possible near current support.
MACD:
Negative signal: signal line crossing from above + descending histogram.
Indicates a continuation of the correction, but we are approaching the potential exhaustion of the downward momentum.
📈 Moving averages:
EMA/SMA 50 and 200:
The price is currently testing the SMA200 – crucial for the medium-term trend.
SMA21 (red) and SMA50 (green) – have reversed downward, which may suggest a weakening of bullish momentum.
🔮 Scenarios:
🟢 Bullish scenario (confirmation of support):
A rebound from 1980–2000 USDT and further upward movement.
Potential target: first ~2180 USDT, then ~2273 USDT.
The condition is a demand response at the current level + an improvement in the RSI/MACD.
🔴 Bearish scenario (breakout of support):
If the 1980 USDT level is broken and the price falls below the uptrend line, a continued decline to 1832 USDT or even lower is possible.
Confirmation will be a strong bearish candle with high volume and a further decline in the RSI/MACD.
M
SOL/USD 4H📉 Price
Current price: approximately $183–$184
We see a decline from the resistance zone around $194.56. The price has broken through support at $187.31 and is heading towards lower support at:
🔴 $183.18 – local support (being tested now),
🔴 $175.58 – key support (potential target if current support breaks).
📊 Market structure
Short-term trend: Downtrend (lower highs and lower lows after a rebound from $194.56).
Volume: Increased volume on bearish candles – confirming supply pressure.
Previous trend: Uptrend with strong momentum from July 18th to July 21st.
🔁 Technical Levels
Resistance:
🟢 USD 187.31 – last broken support, now acting as resistance.
🟢 USD 194.56 – strong resistance (tested twice).
🟢 USD 206.43 – local high, strong resistance level from higher timeframes.
Support:
🔴 USD 183.18 – currently being tested.
🔴 USD 175.58 – stronger support from lower swing highs.
📉 Stochastic RSI
Located in the oversold zone (<20) and pointing down.
No upside crossover yet → no buy signal yet.
If a reversal occurs, a technical rebound is possible.
📌 Conclusions and Scenarios
🔻 Downside scenario (more likely currently):
Breakthrough of support at $183.18 ➜ further decline to $175.58.
Potential entry into a correction of the entire upward movement from July 18-21.
🔺 Upside scenario (alternative):
Support at $183.18 held + Stoch RSI signal ➜ rebound to $187.31.
If buying volume increases, a retest of resistance at $194.56 is possible.

MKR/USDT 4H📈 Trend and price structure
• The price has just been above the downward trend line (yellow line), which suggests the potential reversal of the trend to the upward.
• Breaking was strong - a candle with a large growth volume and an increase +9.13%, which emphasizes the pressure of buyers.
⸻
🔍 levels of support and resistance
• resistance:
• ~ 2342 USDT - a clear level of resistance (green line) - may be the target for the next upward movement.
• 2246.8 USDT - first resistance to overcome.
• Support:
• 2111.7 USDT - level of local support after struggling (earlier resistance).
• 2048.8 USDT - SMA #1 (red medium), can be support at the back.
• 1945.5 USDT - strong support in the form of long -term SMA (blue line, SMA #5).
⸻
📊 Technical indicators
✅ MacD (below)
• The MacD line cut the signal line up - buy signal.
• The histogram is growing, which confirms the growth moment.
✅ RSI
• RSI has bounced from level 40 and is currently above 60 - it suggests upward momentum, but it is not yet purchased, so there may be room for further growth.
⸻
✅ Medium walking (SMAS)
• The price was pierced by SMA #1 (red) and SMA #2 (green) with impetus, which means a change in sentiment.
• If it stays above these medium - a bull signal.
• SMA 50 (green)> SMA 200 (blue) = potentially a golden cross is formed on a longer TF.
⸻
📌 Summary - technical scenario:
🐂 Bycza scenario:
• If the price lasts above 2111.7 USDT, it may continue to increase to USDTt and further up to $ 2,342.
• Confirmation will be the continuation of growth on MacD and RSI over 60-70.
🐻 Bear scenario (threats):
• If the price drops below 2048 USDT, possible correction up to 1945 USDT.
• RSI returning below 50 and Macd Cross down would be a reversal signal.
M
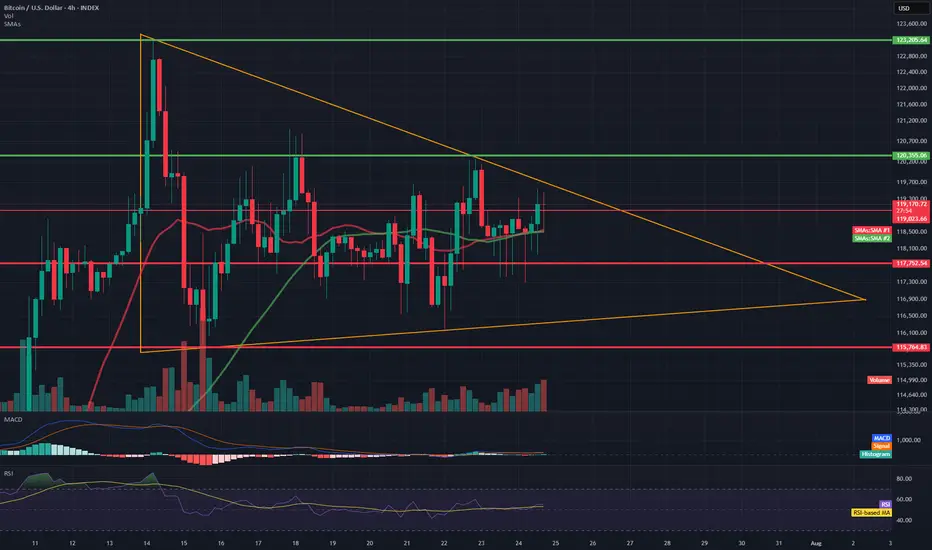
BTC/USD 4H Chart Review📊 Technical Structure (Symmetrical Triangle)
Formation: The symmetrical triangle (orange lines) remains intact—price continues to move within it.
Approaching the apex: The closer to the intersection of the triangle's arms, the greater the probability of a breakout. The current candle is testing the upper boundary of the formation (around $119,300), but has not yet broken it.
Direction: The formation is neutral, but tension is increasing. A breakout of either line (the upper boundary ≈$119,500 or the lower boundary ≈$117,700) could trigger a dynamic move with a range of around $3,000 (the height of the triangle at its widest point).
🧱 Support and Resistance Levels (Red and Green Lines)
Type Level (USD) Description
Resistance 123205 All-Time High – Possible Target After an Upward Breakout
Resistance 120556 Local Resistance – Triangle Breakout Range
Resistance 119200–119300 Currently Tested Level
Support 117752 Lower Triangle Boundary – Critical Defense Line
Support 115764 Next Local Support
📈 Technical Indicators
🔵 RSI (Relative Strength Index)
Currently: ~55 – indicates a neutral situation, having broken down from the overbought level (~74).
Indicates that the market has temporarily cooled down after a previous impulse. There is still room for further upward movement without exceeding 70.
🔵 MACD
The MACD and signal lines are approaching a crossover – if the MACD crosses the signal line upward, it could be a bullish signal.
The histogram is slightly positive – indicating weak but growing bullish momentum.
📊 Volume
Slightly increasing in the last candles – no confirmation of a strong breakout yet, but upward pressure is building.
🧠 Interpretation
Scenario Technical Conditions Movement Objective
🔼 Upward Breakout
Candlestick close above $119,500 USD 122,000–$123,200 USD
🔽 Downward Breakout
Close below 117,750 and confirmed by volume at 115,700, then 114,000 USD
🔄 Consolidation
Inconclusive, continued sideways movement
Between $117,700 and $119,500 USD
✅ Summary
Bitcoin is still in a neutral symmetrical triangle formation but is approaching a turning point.
The RSI has broken out of the overbought range, and the MACD is signaling a potential upside breakout.
Volume confirmation is still lacking, but technical conditions favor the bulls – if it manages to break above 119,500 and hold above, a move towards 122,000–123,000 USD can be expected.
In the event of a rejection, maintaining 117750 will be key; breaking it opens the way to 115700 and below.
Australian dollar rose 0.8% but there is a "Wall" of naked callsAustralian dollar is up 0.8% in 24h — and almost eyeing the 0.66–0.665 zone .
That’s exactly where we’ve been seeing a systematic build-up of naked calls on the futures.
More “bricks” added to the wall yesterday.
Early, looking at the CME data , there’s been a meaningful inflow in deep-out-of-the-money call options at the 0.665 strike . And this has been happening for several days for now
We can’t say it’s one single player — CME reports don’t show that.
But the pattern is too consistent to ignore.
🧠 Why it matters:
As I’ve said before — these long call stacks can easily turn into zero-cost put spreads by selling futures at those levels.
🎯 Bottom line:
Seems the market isn’t betting on a rally in long term.
It’s preparing to defend the range .
Strategy: open shorts at "build-up" resistance zone

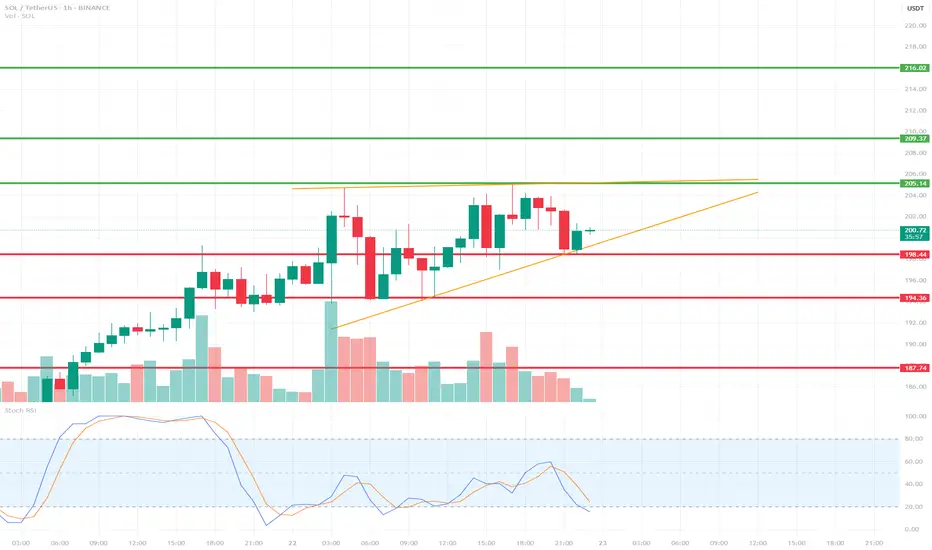
SOLUSDT 1H Short-Term🔍 Technical Structure:
Short-Term Trend:
SOL is currently in an uptrend, with local higher lows. This is evident from the orange uptrend line, which has been tested multiple times.
Local Resistance:
205.14 USDT – yellow line – a resistance level that the price has touched several times but failed to break (this could be a double-top formation).
Local Support:
198.48 USDT – the price is currently testing this level as support.
194.36 USDT – lower, more crucial support (stronger upon a trend breakout).
187.74 USDT – important support that would be tested in the event of a larger breakout.
📉 Oscillator – Stoch RSI:
The Stoch RSI is currently in oversold territory (below 20), suggesting the possibility of a local rebound.
However, there has been no upward crossover yet, so there is no strong buy signal.
🔊 Volume:
We are observing a decrease in volume during the current correction, suggesting that the declines are relatively weak – there is no strong supply impulse.
🧠 Short-term scenarios:
✅ Bullish scenario:
Price is rebounding from the trend line (orange) and the 198.48 USDT level.
A break of the 205.14 USDT resistance could open the way to:
209.37 USDT
216.02 USDT (next target)
❌ Bearish scenario:
A break of the trend line and the 198.48 USDT level with the 1-hour candle closing below.
Possible decline to:
194.36 USDT (first support)
and further to 187.74 USDT if selling pressure increases.
XAUUSD Technical Analysis – Resistance Turned Support, 📈 XAUUSD Technical Analysis – Resistance Turned Support, Bullish Continuation Expected
Gold (XAUUSD) has shown strong bullish momentum after breaking above the key resistance zone around $3,400, which now appears to be acting as a new support level. This structure shift signals a classic break-and-retest scenario, commonly observed in bullish continuations.
🔍 Key Observations:
Structure Shift: Previous resistance near $3,400 has been broken with strong bullish candles, suggesting buyer dominance. This level is now expected to serve as support.
Bullish Momentum: The move from the $3,320 support zone to above $3,430 was accompanied by clear trend formation and clean market structure, indicating sustained momentum.
Retest in Progress: Price is currently pulling back toward the new support zone ($3,400). If this area holds, a bullish reaction is expected.
Next Target: If support at $3,400 holds as expected, price could rally back toward the next resistance and projected target of $3,460.
📚 Educational Insight:
This setup illustrates the principle of resistance becoming support (RBS)—a foundational concept in technical analysis. After a breakout, a successful retest of former resistance often provides a high-probability entry point for trend continuation trades.

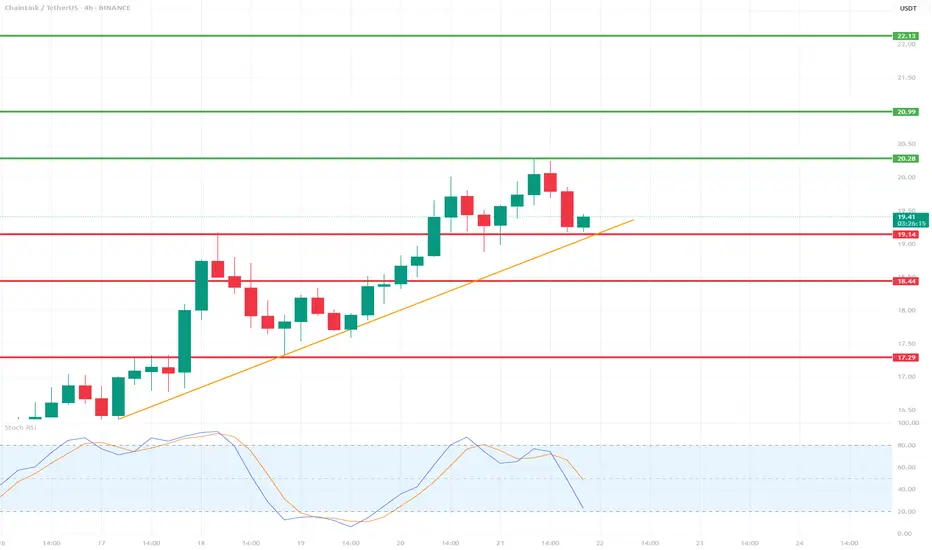
LINK/USDT 4H Chart📉 Indicators and Market Structure:
🔶 Trend:
Current trend: up, as long as it remains above the trend line and the 19.14 USDT level.
Local resistance: 20.28 USDT (recent high).
Next resistances: 20.99 USDT and 22.13 USDT (green lines).
Supports: 19.14 USDT, 18.44 USDT, 17.29 USDT (red lines).
🔷 Stochastic RSI (lower indicator):
Located in the oversold zone (below 20) and starting to reverse upward.
Potential signal of buying pressure if the %K and %D lines cross bullishly.
🧠 Scenarios:
✅ Bullish scenario (trend continuation):
Bounce from the trend line and the 19.14 level → breakout of 20.28 → test of 20.99–22.13.
Confirmation will be a clear bullish candle with high volume and a Stochastic RSI cross up.
❌ Bearish scenario (trend break):
Closing below the trend line and the 19.14 level → correction towards 18.44, and then even to 17.29.
An oversold RSI could support continued declines if a rebound does not occur.
📌 Summary:
Currently, the key level is the trend line and support at 19.14 USDT.
The market is waiting for a reaction – a rebound or a downward breakout.
Stochastic RSI suggests a possible rebound, but candlestick confirmation is needed.
BTCUSD - BEARISH DIVERGENCE DETECTEDCAPITALCOM:BTCUSD
BTCUSD has been in a bullish trend over the past few hours and is now approaching the resistance at 119,500.00.
On the hourly chart, a bearish hammer has formed alongside a stochastic divergence, signaling potential downside.
⚡ This signal is reinforced by a strong resistance level above, adding weight to a possible pullback scenario.
📉 If BTCUSD rebounds from this level, consider Sell setups with take profit at the nearest support.
📈 If it breaks out, look for Buy opportunities on confirmation.
⚡ We use Stoch (14) to spot potential reversals when it exits overbought or oversold zones — helping you catch clear, confident entries.
