Gold plans in Asian and European trading sessions1️⃣ Trend Lines
• Descending Trend Line (Key Dynamic Resistance)
Price has touched this trend line several times but has not broken through, confirming that selling pressure remains dominant.
This is a crucial area: if a breakout does not occur, the price could potentially reverse sharply lower.
• Long-Term Ascending Trend Line
This is the main bullish structure in the market.
A larger decline will likely break through this trend line before the price reacts.
2️⃣ Resistance (Red Zone Above)
This is the intersection of:
✓ Descending Trend Line
✓ Nearest Local Peak (High)
This is the best sell zone under current market conditions.
Only if the price is able to close the candle with a strong breakout can a bullish reversal be confirmed.
3️⃣ Support (Green zone below)
This zone has been a recurring price reaction area, serving as important short-term support.
If the price breaks through this support zone, the downtrend will likely continue towards the long-term uptrend line.
📈 BUY GOLD: 4167 – 4165
Stop Loss: 4155
Take Profit: 100 – 300 – 500 pips
📉 SELL GOLD: 4264 – 4266
Stop Loss: 4276
Take Profit: 100 – 300 – 500 pips
Resistence

Gold price trend ahead of ADP news release on December 31️⃣ Trendline
▪ Rising Trendline (red / upward slope)
Price is moving within a bullish structure, continuously forming Higher Lows.
→ This acts as the main dynamic support guiding the uptrend.
Price is likely to retest this trendline around 4,145 before continuing upward.
▪ Falling Trendline (black / downward slope)
This is the major dynamic resistance, also overlapping with the extended Fibonacci zone.
→ The next potential touchpoint lies near the strong resistance area 4,300–4,340.
2️⃣ Key Support – Resistance Zones
▪ SUPPORT: 4,145 – 4,150
Confluence with EMA + trendline.
This is a high-probability zone where buyers are expected to defend the price.
▪ RESISTANCE: 4,335 – 4,340
Overlaps with the descending trendline.
Matches the 2.618 Fibonacci extension.
This is the main target of the current bullish structure.
→ A reaction or correction is expected when price reaches this area.
Trading Plan
BUY GOLD: 4145 – 4148
Stop Loss: 4135
Take Profit: 100 – 300 – 500 pips
SELL GOLD: 4260 – 4263
Stop Loss: 4270
Take Profit: 100 – 300 – 500 pips

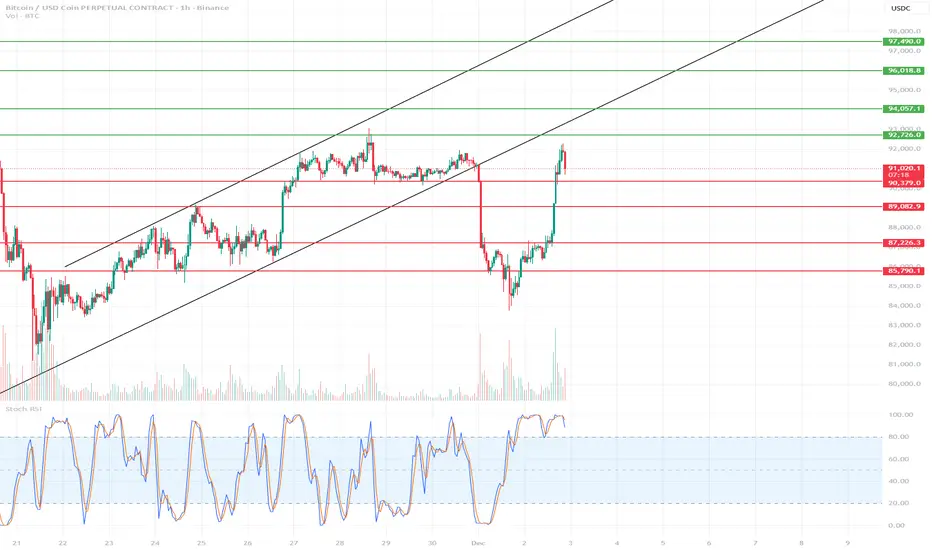
BTC Short-Term Chart 1H🔍 1. Current Market Situation
BTC has made a very strong rebound from around ~87,000 and reached the key resistance zone of 92,700–93,200, where the first signs of a slowdown are currently visible.
The Stoch RSI on the 1-hour timeframe is heavily overbought, which usually suggests a local correction or at least consolidation.
🔴 2. Key Resistance Levels (Short-Term)
92,726 → current resistance; the price has rebounded precisely from this zone.
94,057 → next strong resistance if BTC breaks above 92.7k.
96,018–96,866 → strong supply zone; only after breaking this zone will the uptrend resume in full force.
🟢 3. Major Supports (Short-Term)
90,379 – 90,990 → nearest intraday support zone
89,082 → strong support that halted the previous decline
87,726 → key to the upward structure
85,790 → critical level, a breakout opens the door to a deeper correction
📉 4. Short-Term Baseline Scenario
Most likely in the coming hours:
✔ Scenario A – correction from the current level (preferred)
Stoch RSI overbought
Price rejected from the 92.7k resistance
Large vertical move → market needs to cool down
Correction Targets:
90,900–90,300 → first TP/buy zone
89,100 → deeper correction but still healthy.
Long signal:
Return of h1 candle closes > 91.3k after a pullback.
✔ Scenario B – breakout of 92.7k and continued growth
If BTC breaks and holds above 93,200, upward momentum resumes.
Targets:
94,057
96,000–96,800 (strong supply zone – take profit area)
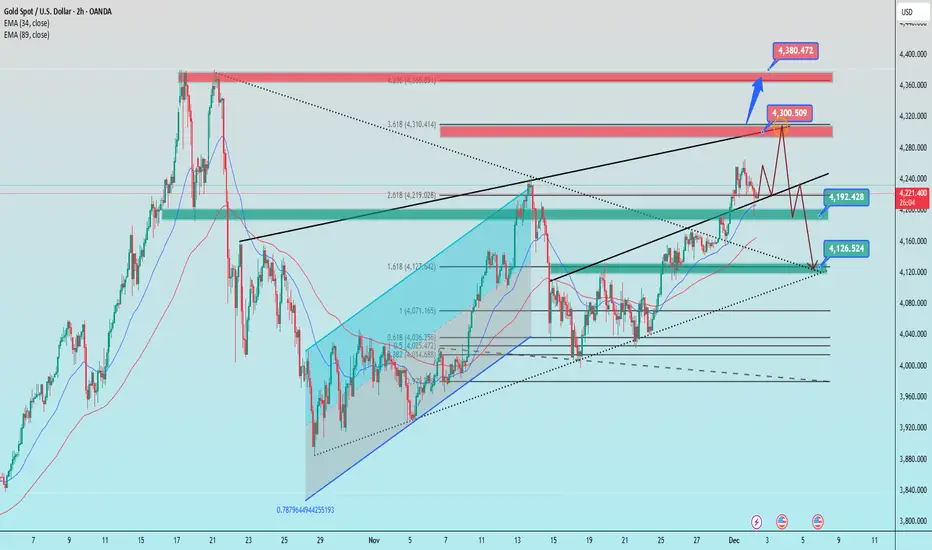
Scenario after the speech of the FED chairman on December 21️⃣ Trendline
Ascending trendline (lower black line)
This is the main dynamic support of the current trend.
Price is retesting the trendline after a strong bounce → holding above it keeps the bullish structure intact.
Descending trendline (upper black line)
A strong dynamic resistance from the higher timeframe, aligning with the 2.618 Fibonacci extension.
Price reacted and weakened when touching it → indicating selling pressure emerging.
2️⃣ Key Support & Resistance Zones
Resistance
4,300 – 4,315: Confluence of
✔ 3.618 Fibonacci extension
✔ Descending trendline
✔ Previous supply zone
→ This is the strongest reversal area.
Upside target if broken:
→ 4,375 – 4,380 (Fibo 4.236 + higher-timeframe supply zone).
Support
4,192 – 4,200:
✔ Demand zone
✔ Confluence with EMA + retest of ascending trendline
→ This is the short-term support.
4,125 – 4,130:
✔ Confluence with major ascending trendline
✔ 1.618 Fibonacci extension
→ This is the strong support – target if breakdown occurs.
3️⃣ Fibonacci Structure
The previous bullish wave completed a classic Fib extension pattern:
✔ 1.618 → 4,127
✔ 2.618 → 4,219
✔ 3.618 → 4,310
→ This reflects a fully extended wave, increasing the probability of a correction.
4️⃣ Price Scenarios
Scenario 1 (primary – correction expected)
Price rejects strongly at 4,300 →
🔻 Drops to 4,192 → if broken → moves toward 4,125 (major bounce zone).
Scenario 2 (bullish breakout)
If an H4 candle closes above 4,310, the move may extend toward 4,375 – 4,380.
Trade Ideas
BUY GOLD : 4193 – 4191
Stoploss: 4183
Take Profit: 100 – 300 – 500 pips
SELL GOLD : 4300 – 4303
Stoploss: 4313
Take Profit: 100 – 300 – 500 pips
BTC/USDT 4H Chart Review🧭 1. Main Market Structure
The chart shows:
A broad downward channel that has been in place since the end of October.
The price bounced off the upper line of the channel, made a local upward impulse (orange trend line), and then broke it, returning back towards the lower regions of the channel.
➡️ This means that the dominant trend is still downward, and upward bounces are corrections.
🧨 2. Current Chart Situation
BTC has broken through:
the local uptrend (orange line)
fell below the 88,500–89,000 zone (green)
is heading towards further support levels
Currently, the price looks like a typical retest of the broken structure and a continuation of the decline.
🟩 3. Key Price Levels (S/R)
Resistance (upper – green):
91,600 – 92,000 – key level, a breakout would negate the local downtrend
95,000 – 97,500 – upper range of the descending channel
Support (lower – red):
85,300 – 85,800 – local support (price is currently reacting here)
83,000 – 83,100 – strong horizontal support
79,800 – strong support, historically strong in this timeframe
76,600
75,000 – lower band of a potential drop + near the lower boundary of the channel
➡️ The most logical downside targets are 83,000 and 79,800.
📉 4. Descending Channel (black) (lines)
The price has rebounded from the upper range of the channel and is heading towards the lower range.
The middle line of the channel has been broken down → a signal of trend continuation.
The lower boundary of the channel indicates a potential low around 75,000–78,000.
🔄 5. Stoch RSI
Currently oversold in the oversold zone, it is starting to curve upwards.
In a downtrend, long signals are weaker, but a short-term rebound is possible.
🧭 6. Scenarios
📉 Bearish scenario (more likely)
Technical rebound to 88,500 – 89,000
Rejection from this zone → continued decline
Targets:
83,000
79,800
Extremes: 76,000 – 75,000
➡️ This scenario is consistent with the trend and a rebound from the upper channel.

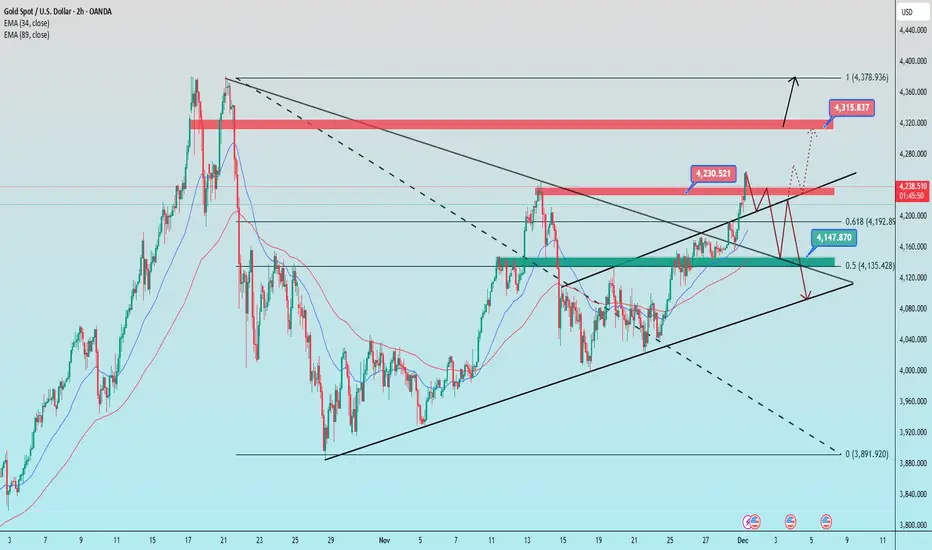
How did gold move in the first week of December? CONCISE & COMPREHENSIVE TECHNICAL ANALYSIS
1. Trend Lines
Ascending trend line (lower black line)
This is the main dynamic support of the current uptrend structure.
The price has bounced off this trend line several times → the short-term trend remains bullish as long as this line is not broken.
Major descending trend line (upper black line)
This is strong dynamic resistance on larger time frames, and the price recently touched this area.
This is an area where selling pressure frequently arises.
2. Support – Resistance
Resistance
4,243–4,245 (red zone):
This is the confluence of the previous peak and the descending trend line → selling pressure appears right in this area.
4,315–4,320 (next major resistance):
If this area is broken, the price will likely head towards 4,375–4,380.
Support
4.147–4.150 (green zone confluence):
Confluence of moving averages, the nearest swing low, and Fibonacci levels → important support that maintains the bullish structure.
4.105–4.120 (lower trendline):
If the price breaks through this area → the short-term trend has the potential to turn bearish.
3. Fibonacci
Fibonacci 0.618 = 4.194
→ Area with a high probability of a rebound if the price corrects.
Fibonacci 0.5 = 4.135
→ Confluence with strong support + trendline → potential buy zone if a deeper pullback occurs.
4. Price Scenarios
Scenario 1 – Continue Upward (Priority)
If the price remains above 4,200–4,215, there is potential for a retest:
➡️ 4,230 → 4,315 → 4,375
Scenario 2 – Downward Correction
If the price breaks through 4,190 and breaks through the green zone of 4,144–4,150, then:
➡️ Risk of a downward movement towards the 4,105–4,120 trend line
📌 Trading Plan
BUY GOLD: 4,148 – 4,250
Stop Loss: 4,138
Take Profit: 100–300–500 pips
SELL GOLD: 4,313 – 4,315
Stop Loss: 4,325
Take Profit: 100–300–500 pip
BNB/USDT ANALYSIS - 4H interval🔶 1. Current Trend and Market Structure
The chart shows:
A clear short-term uptrend – the price is respecting the ascending yellow trend line.
An increase after a bounce from the SMA 50 (green).
However, there are still no new higher highs – the market is consolidating between 888–910.
➡️ Short-term trend: up
➡️ Medium-term trend: neutral/consolidation
🟩 2. Key Support/Resistance Levels
Resistance:
910–912 USDT – currently a key resistance, tested multiple times.
930–935 USDT – local higher resistance (green zone on your chart).
957–960 USDT – stronger resistance from D1 (blue SMA95 visible in the screenshot).
Supports:
USDT 889–893 – local support and the current battleground.
USDT 871 – SMA 50 + previous swing low.
USDT 849 – powerful support from the HTF.
USDT 837 – the final “lifeline” of the bullish structure.
📈 3. Indicators (MACD, RSI)
MACD
MACD > 0 – positive.
The MACD line is starting to point upwards → a signal of bullish momentum.
No divergence.
➡️ MACD supports the bullish scenario.
RSI
RSI ~59 – a healthy zone, far from overbought.
RSI breaks the local downtrend → increasing buyer strength.
➡️ RSI confirms the bullish trend.
🟧 4. Key Price Action Now
The price is currently approaching resistance at 910–912 USDT and simultaneously touching the local trend line.
This is the market's decision point.
A breakout → opens the way to 930–935.
A rejection → a return to 889, and below 871.

Will gold prices rise again in the new week?1️⃣ Trendline
Long-term descending trendline (upper black line)
Price has strongly broken above the long-standing descending trendline.
→ This signals a transition from a bearish phase to a medium-term bullish trend.
Short-term ascending trendline (small channel)
Price is moving inside a short-term ascending channel, consistently forming higher lows.
The recent breakout came with strong momentum → bullish strength is currently dominant.
2️⃣ Support – Resistance
Key Support Levels
4,111 – 4,108:
A confluence zone of the ascending channel’s bottom, EMA, and the 0.618 Fibonacci level → strong support if price pulls back.
4,145 – 4,150:
This is the breakout zone and will act as a retest support if price revisits it.
Key Resistance Levels
4,238 – 4,245 (Fibo 1.618 + previous structure high)
→ First major resistance zone. Price may consolidate or shake before breaking through.
4,375 – 4,380 (Fibo 2.618 + major upper zone, ATH area)
→ Large upside target if price breaks and holds above 4,245.
3️⃣ Fibonacci
The current upward swing is targeting the 1.618 Fibonacci extension at 4,238 – 4,245.
If this zone is broken and price closes above:
→ Next extension target is 2.618 Fibonacci near 4,375 – 4,380.
4️⃣ Trend Outlook
Trend: Short-term bullish → shifting to medium-term bullish after breaking the major descending trendline.
Key level to hold:
Above 4,145–4,150 = bullish continuation.
Upside targets:
4,238 – 4,245
4,372 – 4,380 (if bullish momentum continues)
Trading Plan
BUY GOLD: 4111 – 4108
Stop Loss: 4098
Take Profit: 200 – 400 – 700 pips
SELL GOLD: 4278 – 4281
Stop Loss: 4291
Take Profit: 200 – 400 – 700 pips

BTC Short-Term 15m Chart📉 BTC 15M — Short-Term Analysis
1. Key Levels from the Chart
Support
$90,400–$90,450 – strong, repeatedly tested (orange zone).
$90,178 – lower support (thin red line).
$89,460 – deeper daily support.
Resistance
$90,900–$91,000 – local resistance zone.
$91,214–$91,545 – SMA 72 / SMA 200 (yellow and blue) = strong dynamic resistance.
$91,800–$92,200 – higher structural resistance.
🧠 2. Market Structure
Short-term trend (15m)
Price remains below the SMA 200 and SMA 72 → bearish momentum.
Lower highs and lower lows are visible → bearish structure.
Narrower range: 90,400 – 90,900 → price compression / consolidation.
📊 3. Indicators
MACD – neutral / slightly bearish
Histogram hovers around zero → lack of strong momentum.
Recent downward crossover → downward pressure.
RSI – 48 (neutral)
Not oversold yet, but:
RSI is forming a bearish divergence from previous highs.
RSI often bounces from 50 in a downtrend → confirms bearish pressure.
🔎 4. What's happening now?
The price is retesting the $90,400 zone, a key defensive level for bulls.
The structure indicates:
supply pressure,
buyers exhausting themselves below the 200 SMA,
possible breakout below if 90,400 breaks.
🎯 5. Short-Term Scenarios (15m)
🔻 Bearish Scenario (more likely)
If 90,400 falls:
Target 1: 90,180
Target 2: 89,460
Target 3: 88,960
The structure strongly suggests this because:
Price below the 200 SMA
Weak momentum
No strong rebound from the lows
🔼 Bullish Scenario (only after breaking 90,900)
If the market rebounds from 90,400 and breaks 90,900:
Target 1: 91,200 (SMA 72 + 200)
Target 2: 91,550
Target 3: 91 800

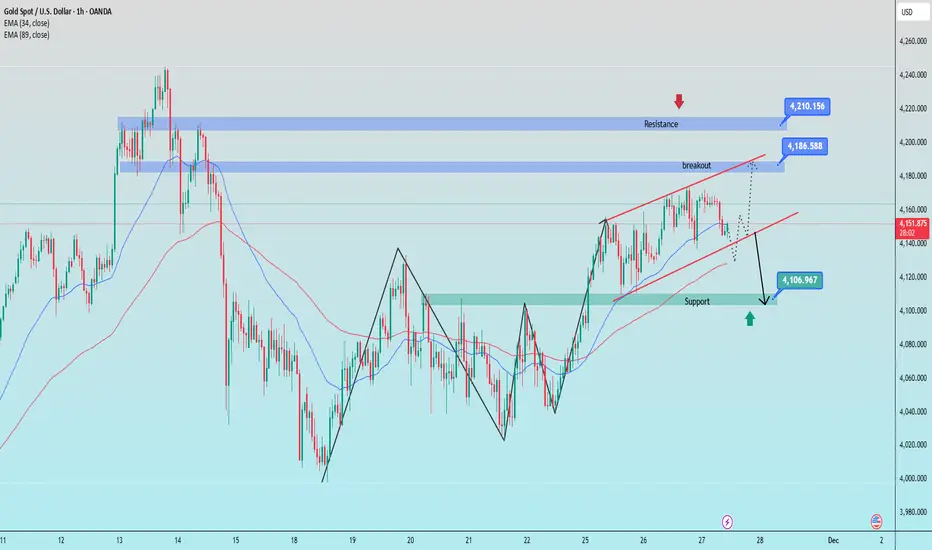
Bank holiday what will gold price be on 28 november 2025?1️⃣ Trendline
Ascending Trendline (red channel)
Price is moving inside a short-term ascending channel, forming higher highs and higher lows.
Recently touched the upper boundary → a technical pullback toward the lower boundary is likely.
Descending Trendline (red dotted)
This is a dynamic resistance from the higher timeframe.
Price has just broken above it; a retest is normal → creating a strong confluence area.
2️⃣ Key Support & Resistance
Resistance
4,240 – 4,245 (Fibo 1.618 + major supply zone)
→ This is the upside target if price continues to hold within the ascending channel.
Support 1 (nearest)
4,165 – 4,170 (trendline + MA + previous consolidation zone)
→ This zone is crucial for maintaining the bullish structure.
Support 2 (stronger)
4,095 – 4,112 (Fibo 0.5 – 0.618 + broad demand zone)
→ If Support 1 breaks, price may retrace deeply into this area.
3️⃣ Fibonacci Levels
Fibo 1.0 at 4,162 → currently the main retest point.
Fibo 0.618 at 4,111 → strong confluence with the major demand zone.
Fibo 1.618 at 4,245–4,255 → matches the top resistance → primary bullish target if the trendline holds.
4️⃣ Scenarios
Bullish Scenario (preferred)
If price holds above 4,165 – 4,170
→ it continues following the ascending channel → target 4,240 – 4,245.
Bearish Scenario
Break of the trendline + candle close below 4,165
→ confirms a correction phase → price likely moves down to 4,109 – 4,105.
Trade Ideas
BUY GOLD:
4165 – 4162
Stoploss: 4152
Take Profit: 100 – 300 – 500 pips
SELL GOLD:
4240 – 4243
Stoploss: 4250
Take Profit: 100 – 300 – 500 pips

ETH/USD 1D chart review1️⃣ Trend and general context
• ETH is trading after a sharp decline from its local high of ~4,000+.
• The price rebounded from a quite strong support zone around ~2,750–2,800.
• Current price: ~USD 3,034 → the market is testing the first local resistance.
Short-term trend: down, but a rebound and the first signs of reversal are visible.
Long-term trend: still upwards (HL/HH on large intervals).
⸻
2️⃣ Key Levels (from your chart)
🟩 Resistances
• USD 3,475 – key resistance + SMA (blue)
👉 if ETH breaks this level and closes 1D above → strong bullish signal.
• USD 4,061 – major resistance from previous highs.
🟥 Support
• USD 2,757 – the nearest strong support after breaking the trendline.
• USD 2,126 – very key macro support (bottom of consolidation).
⸻
3️⃣ Medium SMA
From your chart:
• Red SMA #1 – price is just above it → first positive signal.
• Blue SMA #5 – Acts as resistance and is currently being tested from below.
• Green SMA #2 – higher, acts as resistance at ~USD 3.475.
➡ The price must return above the blue and green SMA to confirm the return of the upward trend.
⸻
4️⃣ MACD
• The MACD at the bottom of the chart begins to curl upwards.
• The histogram decreases towards zero → the downward momentum weakens.
• Bullish cross is still missing, but it's getting closer.
Conclusion: Early signal of trend reversal, but not confirmed.
⸻
5️⃣ RSI
• RSI is in the zone around 40 → quite low, but not extremely.
• Slight divergence: the price made a lower low, the RSI made a higher one.
👉 This is a bullish signal, but only in combination with a resistance breakout.
⸻
6️⃣ Price Action
You can see:
• A long rising candle after a bounce from below.
• We are approaching the first important resistance at ~3.100–3.150.
To confirm continuation, you need:
✔ Closing of the 1D candle above ~3.150–3.200.
⸻
🎯 What might happen next?
Bull scenario (more likely if BTC also increases)
1. Breakout 3,150–3,200 → retest → move to:
• USD 3,475 (major resistance + SMA)
• then 3,800+
2. MACD makes a bullish cross → momentum is growing.
Probability: ~60%, but confirmation only after the breakout.
⸻
The Bears Scenario
1. Rejection from SMA (blue) and return below 3,000
2. Down to 2,750-2,800 again
3. If this breaks → move towards $2.126
Probability: ~40% at this point.

Gold is still moving sideways and waiting for a breakout1. Trendline Structure
Ascending Channel (red)
Upper trendline: price has been repeatedly rejected at the upper boundary → strong dynamic resistance.
Lower trendline: recently pierced slightly → indicates weakening buying pressure and increased correction risk.
2. Key Resistance
4,186 – 4,210: Strong supply zone + confluence with the upper trendline.
This is a zone that price will struggle to break without strong volume.
→ If price breaks above and successfully retests → the next target is the 4,210 area.
3. Key Support
4,105 – 4,110: Major support zone, confluence with EMA & the 0.5 Fibonacci level.
→ High probability that buyers will step in around this area.
4. Overview
Major Resistance: 4,186 – 4,210
Major Support: 4,105 – 4,110
Short-term Trend: weakening, leaning toward a corrective move.
Key Signal: a break below 4,140 → confirms a drop toward the support zone.
Bullish Scenario: only activated if the price reclaims 4,186.
BUY GOLD : 4107 - 4109
Stoploss : 4097
Take Profit : 100-300-500pips
SELL GOLD : 4209 - 4211
Stoploss : 4221
Take Profit : 100-300-500pips
QUICK ANALYSIS (1H) — BTC BOUNCED FROM RESISTANCE✅ 1. Breakout from the downward trendline
On the chart, I see:
a yellow downward trendline—it has been broken,
the candlestick dynamically breaks through it and closes above it.
➡️ This is the first signal of a shift in momentum to upward.
✅ 2. Price is testing the 200 SMA (blue)
BTC is currently:
touching the 200 SMA,
bounces slightly downward—a classic reaction to strong resistance.
➡️ Until we break through the 200 SMA, the market remains in a downtrend.
🟩 3. Nearest resistance levels (green levels on your chart):
90,400 USDT – current resistance (reaction already visible)
92,500 USDT – next important level
93,200–94,000 USDT – strong supply zone
94,900 USDT – strong level from previous bounces
➡️ The closer the price gets to 94–95k, the greater the chance of a downward rebound.
🟥 4. Nearest support levels
From your red levels:
88,700 USDT – first level of defense
87,500 USDT – key support
85,500 USDT – major local bottom
84,150 USDT – extreme support
➡️ If BTC returns below 87.5k, the correction will deepen.
📊 5. RSI — Neutral-Bullet
RSI ~ 55,
Not yet overbought,
RSI trend is increasing.
➡️ There is room for further upward movement.
📉 6. MACD — Bullish Signal
MACD has crossed the signal line upward,
the histogram is rising.
➡️ Upward momentum, shorting here is risky.

EURUSD: double Scenario
Hello Traders,
this is the long-term channel!
We are truly in the way of more bearish days!
However, in the more natural timeframe we see a possible Head and shoulders!
I'm not a pattern trader! but sellers were not able to goes further than the HEAD!
So???
They are not strong enough! new buyers are in! may be a peace in Ukraine could alter it!
but I'm still more bearish for the term of my trade length! Although I aim to long after confirming the H&S and also breaking the latest strong level and breaking the bearish channel up!!

EURUSD - price at critical resistanceFurther to my previous idea on EURUSD, the price respected the resistance at 1.16300-1.16500.
Yesterday the price rebound on (finally) published data and reached the key Resistance at 1.16.
If this is Resistance is respected, We are returning to the downtrend and in my view the price will continue down to ~1.14.
Just my humble opinion

How did gold perform after the PPI news?🧭 1. Trendline
Descending trendline (red – dynamic resistance)
Price has clearly broken out above the descending trendline.
Price is currently in a slight retest of this trendline → if it holds above 4,150–4,160, a short-term uptrend is confirmed.
Ascending trendline (hidden in the underlying structure)
Confluence support zone is around 4,107–4,110
→ This is a very strong area for a pullback if it occurs.
🧱 2. Support – Resistance
Key Resistance
4,209–4,212: Strong supply zone, also a confluence with the previous peak area.
4,240–4,242: 1.618 Fibonacci extension + peak in the major supply zone → important target.
Support
4.107 – 4.110: Confluence of:
Fibonacci 0.5 – 0.618
EMA as support
Retest zone breakout
→ This is a priority buy area if the price pulls back.
📐 3. Fibonacci
The 0.5 – 0.618 Fibonacci of the rising wave is right in the green support zone → confirming strong demand.
The 1.618 Fibonacci extension points to 4.240 – 4.245 → most likely the final target of this rising wave.
BUY GOLD: 4107 - 4110
Stop Loss: 4097
Take Profit: 100-300-500 pips
SELL GOLD: 4209 - 4212
Stop Loss: 4222
Take Profit: 100-300-500 pips

GOLD Bullish Momentum Confirmed – Key Trading Zones for 25 NOV At the moment, gold is transitioning into a short-term consolidation phase, preparing for the next directional move. This creates two important intraday zones for tactical trading.
🔍 Technical Outlook
Short-term trend: Bullish bias remains intact after the breakout.
Momentum: RSI stays above the midline → buyers still have control.
Market structure: The corrective pattern has completed; price is stabilizing before the next impulse.
Order flow: Evidence of accumulation at lower levels followed by aggressive buying.
These factors shape today’s intraday strategy.
Trading Setups (Technical Reference Only)
📌 Setup 1 – Timing Sell Zone
Potential area where short-term profit-taking may appear.
SELL Zone: 4185 – 4188
Take Profit: 4182 – 4177
Stop Loss: 4192
📌 Setup 2 – Timing Buy Zone
Support region where buyers may regain control.
BUY Zone: 4100 – 4103
Take Profit: 4106 – 4111
Stop Loss: 4096
📈 Conclusion
Gold respected the previous forecast with high precision, confirming the current strength of the bullish structure. For today, the two zones above serve as key tactical points, aligning with market structure, flow behavior, and momentum dynamics.

Will LINK recover after the information about the ETF?📌 1. Main trend
• A clear downward trend, confirmed by a strong, long-term downward trend line (black).
• The price is testing this line from below for the first time in a long time → a key moment.
If the price breaks it and retests, the trend structure changes.
⸻
📌 2. Current situation
Price currently: ~13.02 USDT
Upcoming levels:
Support
• 12.71 – local support (yellow line).
• 11.75 – strong support, here a demand reaction appeared.
• 9.95 – the greatest support on the chart (red line).
Resistances
• 1:30 p.m.–1:50 p.m. – trend line test; key resistance.
• 15.25 – the first significant resistance in the upward trend.
• 17.78
• 19.77
• 21.70
⸻
📌 3. Stoch RSI (at the bottom of the chart)
• The oscillator is high, approaching the overheating zone (80+).
• This signals a possible short-term correction, unless the downtrend breaks out - then it may stay high for a long time.
⸻
📌 4. Key setup
🔵 Bullish (upward scenario)
Confirmation of growth appears only if:
✔ The price will break the black downtrend line
✔ Will close the 12H candle above approximately 1:50 p.m
✔ Will retest and bounce up
Targets after breakout:
1. 15.25
2. 17.78
3. 19.77 - only here it will encounter stronger resistance
⸻
🔴 Bearish (downside scenario)
If the price does not break the trendline and is rejected ↓:
❗ Downside targets:
• 12.71 (local support – first test)
• If it breaks → 11.75
• And in case of market panic → 9.95
The latter is a powerful level - the level of accumulation from earlier months.
⸻
📌 5. What looks best?
Currently:
• The market rebounded from the support at 11.75 – healthy demand response.
• However, the price is below a strong trendline, so this is a place where it may be rejected.
➡ If I were to indicate the most likely short move:
Light correction → retest 12.71 → decision.
⸻
📌 6. Summary
• A key moment for LINK - it decides to break the downward trend.
• Only a close above 1:50 p.m. gives a real upward signal.
• Failure to break the trendline = possible return to 12.71 → 11.75.

Gold trend continues today November 25th✅ 1. Trend Lines
Upper trend line (red - descending)
Connects a series of lower highs → acts as strong dynamic resistance.
Price has broken through the trend line and is retesting it → the short-term trend will turn bullish if the retest is successful.
Lower trend line (red - ascending)
Connects the upper lows → acts as dynamic support for a symmetrical triangle pattern (consolidation).
This area coincides with a Fibonacci level → strong support – confluence if the price continues to correct.
✅ 2. Key Support – Resistance
Resistance
4,210 – 4,240:
→ Key resistance – short-term bearish potential.
Breaking above the 1.618 Fibonacci level
→ Strong resistance – take-profit zone for buyers.
Support
4.105 – 4.100 (green zone):
Retest zone after breakout
Fibonacci support 0.5–0.618
→ Best buy zone if price retests.
✅ 3. Fibonacci
0.618 at 4.105: First retest → chart reaction.
On the downside, the 4.071 zone touches the trendline.
Extension 1.618 at 4.240: Maximum target if the uptrend is confirmed.
🎯 Trading Plan
BUY GOLD: 4105 – 4103
Stop Loss: 4093
Take Profit: 100 – 300 – 500 pips
SELL GOLD: 4210 – 4212
Stop Loss: 4222
Take Profit: 100 – 300 – 500 pips

BTC/USDT 4H Chart Review1. Local trend
The chart shows:
✔️ Clear upward trend - the price respects the rising trend line (black diagonal).
✔️ The last candle broke strongly upwards, which suggests bullish momentum.
⸻
🟢 Key resistance levels (green lines)
1. 90,352 USDT - the first stronger resistance (it looks like the price is just reaching it).
2. 93,271 USDT - another strong resistance; there may be a clearer sell-off here.
➡️ If it breaks 90,352 with high volume, the path to ~93k is open.
⸻
🔴 Key support levels (red lines)
1. 86,890 USDT - Local Support/Trendline Retest.
2. 84,989 USDT - Stronger support.
3. 82,545 USDT - key support for the growth structure.
➡️ Loss of 86,890 + breakout from the trendline may mean a correction to around 85,000.
⸻
📉 RSI / Stochastic (bottom of the chart)
Stochastic RSI is:
✔️ In the growth phase
✔️ Approaching overheating level (80-100)
➡️ This often means that the upside momentum continues, but a local correction may be imminent, especially at the 90,352 resistance.
⸻
📌 Summary
🔼 Bullish Signals:
• Uptrend intact
• Breakout with an upward impulse candle
• The price is rebounding from the trend line
🔽 Bearish Signals:
• Stochastic RSI is approaching the “high” zone
• The price is under important resistance at 90,352
• Local pullback possible if resistance is not broken
⸻
⭐ Short-term scenarios (4H)
👉 Bullish scenario
• Maintaining price above 88,800-89,000
• Breakout 90,352
➡️ Target: 93,000 – 93,300 USDT
👉 Bears scenario
• Rejection from 90,352
• Back below 88,900
➡️ Downside target: 86,900 → 85,000 USDT

Gold prepares for the US trading session1. Trendline Structure
Upper trendline (descending – red)
Connects descending highs → acts as key dynamic resistance.
Price has been tested and rejected several times → medium-term trend remains down.
Possible bullish breakout zone: 4105 – 4110.
Lower trendline (ascending – red)
Connects higher lows → key dynamic support.
Price is approaching a convergence point, indicating an imminent breakout from the contracting triangle.
2. Resistance Zone
Strong resistance: 4090 – 4110
Coincides with the descending trendline and the previous supply zone.
If a breakout occurs and consolidation occurs above 4110 → further growth potential opens up.
3. Support Zone
Support 1: 4000 – 4004
Nearest demand zone.
If broken, the breakout of the lower trendline will be confirmed, leading to a sharp decline.
Support 2: 3955 – 3965
Fibonacci extension 2.618 + key low zone.
Deep downside target.
Trading Plan
BUY GOLD: 4004 – 4002
Stop Loss: 3994
Take Profit: 100–300–500 pips
SELL GOLD: 4104 – 4106
Stop Loss: 4114
Take Profit: 100–300–500 pips

BTC/USDT 1W chart review📉 1. Market structure – trend and break
• The chart shows a black upward trend line that has led the market since 2023.
• This line has been clearly broken, which means:
✔ weakening of the structure
✔ the first serious threat to the upward trend
✔ possible move towards lower support levels
A breakout of the weekly trendline usually ends a medium-term upward trend.
⸻
📉 2. Current price
BTC is around USDT 87,770 and the weekly candle is heavily bearish.
This means that buyers do not react to the first support.
⸻
🟥 3. Most important support levels
1) 92,086 USDT – local resistance zone (previously support)
• Price has broken this support from above → now acts as resistance.
• To return to growth, BTC would have to close the week above this zone.
2) 84,583 USDT – first major support
• Price is just above the zone.
• If this fails → there will be an increased chance of continued declines.
3) 74,324 USDT – key macro support (MAIN LEVEL)
This is the most important level of the chart.
• This is the level where demand must occur if BTC is to maintain its long-term structure.
• Breaking this barrier will open the way to declines even to around 60-65k.
⸻
🟩 4. Resistance levels
1) USDT 92,086
Closest resistance – key to recovery.
2) USDT 100,794
Big weekly resistance that stopped the market earlier.
Only a breakout → continuation of the bull market.
⸻
📊 5. Stochastic (week) – very important
At the bottom you can see Stochastic sliding down, almost at the value of 0-20 (oversold).
Interpretation:
• There is no buy signal yet because the lines have not turned upwards.
• Weekly momentum is still down, so the pressure on support continues.
📈 7. Scenarios
Bullish (less likely for now)
1. Maintaining 84.5k
2. Stochastic weekly turns upwards
3. Price returns above 92k
➡️ Target: 100.7k
Bearish (more likely)
1. Breakthrough 84.5k
2. Retest from the bottom
3. Drop to 74.3k
➡️ If 74k breaks → 65-68k

Gold trend in the last week of November⚔️1. Trendline
Descending Trendline (upper red line)
Acts as the main dynamic resistance.
Every retest results in rejection → the overall trend remains bearish.
The 4.150 – 4.160 zone is likely where price may retest the trendline before reversing lower.
Ascending Trendline (lower red line)
Previously the nearest dynamic support but has now been broken.
The downside breakout signals weakening momentum, favoring SELL setups.
⚔️2. Resistance Zones
Resistance 1: 4.148 – 4.150 (Fibo 0.5 – 0.618)
Confluence of Fibonacci retracement and the descending trendline.
High probability that price will retest this area and reject strongly.
Resistance 2: 4.245 – 4.250
The strongest resistance zone (Fibo 1.0).
Only reachable if a strong bullish pullback occurs.
⚔️3. Support Zones
Support 1: 3.995 – 4.000 & 4.028 – 4.030
Confluence of static support + psychological level.
A technical bounce may appear here.
Support 2: 3.890 – 3.900
The strongest support zone.
Main downside target if the price gets rejected from the upper resistance.
⚔️4. Price Scenarios
⭐️Primary Scenario (Bearish)
Price pulls back to 4.148 – 4.152, retests the descending trendline → rejection → moves down toward:
TP1: 3.995
TP2: 3.890
⭐️Alternative Scenario (Bullish)
Valid only if:
Price breaks above the descending trendline
Closes above 4.160
→ Next target: 4.250
TRADING RECOMMENDATIONS
BUY GOLD: 3890 – 3888
SL: 3878
TP: 100 – 300 – 500 pips
SELL GOLD: 4250 – 4248
SL: 4260
TP: 100 – 300 – 500 pips
