Will LINK recover after the information about the ETF?📌 1. Main trend
• A clear downward trend, confirmed by a strong, long-term downward trend line (black).
• The price is testing this line from below for the first time in a long time → a key moment.
If the price breaks it and retests, the trend structure changes.
⸻
📌 2. Current situation
Price currently: ~13.02 USDT
Upcoming levels:
Support
• 12.71 – local support (yellow line).
• 11.75 – strong support, here a demand reaction appeared.
• 9.95 – the greatest support on the chart (red line).
Resistances
• 1:30 p.m.–1:50 p.m. – trend line test; key resistance.
• 15.25 – the first significant resistance in the upward trend.
• 17.78
• 19.77
• 21.70
⸻
📌 3. Stoch RSI (at the bottom of the chart)
• The oscillator is high, approaching the overheating zone (80+).
• This signals a possible short-term correction, unless the downtrend breaks out - then it may stay high for a long time.
⸻
📌 4. Key setup
🔵 Bullish (upward scenario)
Confirmation of growth appears only if:
✔ The price will break the black downtrend line
✔ Will close the 12H candle above approximately 1:50 p.m
✔ Will retest and bounce up
Targets after breakout:
1. 15.25
2. 17.78
3. 19.77 - only here it will encounter stronger resistance
⸻
🔴 Bearish (downside scenario)
If the price does not break the trendline and is rejected ↓:
❗ Downside targets:
• 12.71 (local support – first test)
• If it breaks → 11.75
• And in case of market panic → 9.95
The latter is a powerful level - the level of accumulation from earlier months.
⸻
📌 5. What looks best?
Currently:
• The market rebounded from the support at 11.75 – healthy demand response.
• However, the price is below a strong trendline, so this is a place where it may be rejected.
➡ If I were to indicate the most likely short move:
Light correction → retest 12.71 → decision.
⸻
📌 6. Summary
• A key moment for LINK - it decides to break the downward trend.
• Only a close above 1:50 p.m. gives a real upward signal.
• Failure to break the trendline = possible return to 12.71 → 11.75.
Resistence

Gold trend continues today November 25th✅ 1. Trend Lines
Upper trend line (red - descending)
Connects a series of lower highs → acts as strong dynamic resistance.
Price has broken through the trend line and is retesting it → the short-term trend will turn bullish if the retest is successful.
Lower trend line (red - ascending)
Connects the upper lows → acts as dynamic support for a symmetrical triangle pattern (consolidation).
This area coincides with a Fibonacci level → strong support – confluence if the price continues to correct.
✅ 2. Key Support – Resistance
Resistance
4,210 – 4,240:
→ Key resistance – short-term bearish potential.
Breaking above the 1.618 Fibonacci level
→ Strong resistance – take-profit zone for buyers.
Support
4.105 – 4.100 (green zone):
Retest zone after breakout
Fibonacci support 0.5–0.618
→ Best buy zone if price retests.
✅ 3. Fibonacci
0.618 at 4.105: First retest → chart reaction.
On the downside, the 4.071 zone touches the trendline.
Extension 1.618 at 4.240: Maximum target if the uptrend is confirmed.
🎯 Trading Plan
BUY GOLD: 4105 – 4103
Stop Loss: 4093
Take Profit: 100 – 300 – 500 pips
SELL GOLD: 4210 – 4212
Stop Loss: 4222
Take Profit: 100 – 300 – 500 pips

BTC/USDT 4H Chart Review1. Local trend
The chart shows:
✔️ Clear upward trend - the price respects the rising trend line (black diagonal).
✔️ The last candle broke strongly upwards, which suggests bullish momentum.
⸻
🟢 Key resistance levels (green lines)
1. 90,352 USDT - the first stronger resistance (it looks like the price is just reaching it).
2. 93,271 USDT - another strong resistance; there may be a clearer sell-off here.
➡️ If it breaks 90,352 with high volume, the path to ~93k is open.
⸻
🔴 Key support levels (red lines)
1. 86,890 USDT - Local Support/Trendline Retest.
2. 84,989 USDT - Stronger support.
3. 82,545 USDT - key support for the growth structure.
➡️ Loss of 86,890 + breakout from the trendline may mean a correction to around 85,000.
⸻
📉 RSI / Stochastic (bottom of the chart)
Stochastic RSI is:
✔️ In the growth phase
✔️ Approaching overheating level (80-100)
➡️ This often means that the upside momentum continues, but a local correction may be imminent, especially at the 90,352 resistance.
⸻
📌 Summary
🔼 Bullish Signals:
• Uptrend intact
• Breakout with an upward impulse candle
• The price is rebounding from the trend line
🔽 Bearish Signals:
• Stochastic RSI is approaching the “high” zone
• The price is under important resistance at 90,352
• Local pullback possible if resistance is not broken
⸻
⭐ Short-term scenarios (4H)
👉 Bullish scenario
• Maintaining price above 88,800-89,000
• Breakout 90,352
➡️ Target: 93,000 – 93,300 USDT
👉 Bears scenario
• Rejection from 90,352
• Back below 88,900
➡️ Downside target: 86,900 → 85,000 USDT

Gold prepares for the US trading session1. Trendline Structure
Upper trendline (descending – red)
Connects descending highs → acts as key dynamic resistance.
Price has been tested and rejected several times → medium-term trend remains down.
Possible bullish breakout zone: 4105 – 4110.
Lower trendline (ascending – red)
Connects higher lows → key dynamic support.
Price is approaching a convergence point, indicating an imminent breakout from the contracting triangle.
2. Resistance Zone
Strong resistance: 4090 – 4110
Coincides with the descending trendline and the previous supply zone.
If a breakout occurs and consolidation occurs above 4110 → further growth potential opens up.
3. Support Zone
Support 1: 4000 – 4004
Nearest demand zone.
If broken, the breakout of the lower trendline will be confirmed, leading to a sharp decline.
Support 2: 3955 – 3965
Fibonacci extension 2.618 + key low zone.
Deep downside target.
Trading Plan
BUY GOLD: 4004 – 4002
Stop Loss: 3994
Take Profit: 100–300–500 pips
SELL GOLD: 4104 – 4106
Stop Loss: 4114
Take Profit: 100–300–500 pips

BTC/USDT 1W chart review📉 1. Market structure – trend and break
• The chart shows a black upward trend line that has led the market since 2023.
• This line has been clearly broken, which means:
✔ weakening of the structure
✔ the first serious threat to the upward trend
✔ possible move towards lower support levels
A breakout of the weekly trendline usually ends a medium-term upward trend.
⸻
📉 2. Current price
BTC is around USDT 87,770 and the weekly candle is heavily bearish.
This means that buyers do not react to the first support.
⸻
🟥 3. Most important support levels
1) 92,086 USDT – local resistance zone (previously support)
• Price has broken this support from above → now acts as resistance.
• To return to growth, BTC would have to close the week above this zone.
2) 84,583 USDT – first major support
• Price is just above the zone.
• If this fails → there will be an increased chance of continued declines.
3) 74,324 USDT – key macro support (MAIN LEVEL)
This is the most important level of the chart.
• This is the level where demand must occur if BTC is to maintain its long-term structure.
• Breaking this barrier will open the way to declines even to around 60-65k.
⸻
🟩 4. Resistance levels
1) USDT 92,086
Closest resistance – key to recovery.
2) USDT 100,794
Big weekly resistance that stopped the market earlier.
Only a breakout → continuation of the bull market.
⸻
📊 5. Stochastic (week) – very important
At the bottom you can see Stochastic sliding down, almost at the value of 0-20 (oversold).
Interpretation:
• There is no buy signal yet because the lines have not turned upwards.
• Weekly momentum is still down, so the pressure on support continues.
📈 7. Scenarios
Bullish (less likely for now)
1. Maintaining 84.5k
2. Stochastic weekly turns upwards
3. Price returns above 92k
➡️ Target: 100.7k
Bearish (more likely)
1. Breakthrough 84.5k
2. Retest from the bottom
3. Drop to 74.3k
➡️ If 74k breaks → 65-68k

Gold trend in the last week of November⚔️1. Trendline
Descending Trendline (upper red line)
Acts as the main dynamic resistance.
Every retest results in rejection → the overall trend remains bearish.
The 4.150 – 4.160 zone is likely where price may retest the trendline before reversing lower.
Ascending Trendline (lower red line)
Previously the nearest dynamic support but has now been broken.
The downside breakout signals weakening momentum, favoring SELL setups.
⚔️2. Resistance Zones
Resistance 1: 4.148 – 4.150 (Fibo 0.5 – 0.618)
Confluence of Fibonacci retracement and the descending trendline.
High probability that price will retest this area and reject strongly.
Resistance 2: 4.245 – 4.250
The strongest resistance zone (Fibo 1.0).
Only reachable if a strong bullish pullback occurs.
⚔️3. Support Zones
Support 1: 3.995 – 4.000 & 4.028 – 4.030
Confluence of static support + psychological level.
A technical bounce may appear here.
Support 2: 3.890 – 3.900
The strongest support zone.
Main downside target if the price gets rejected from the upper resistance.
⚔️4. Price Scenarios
⭐️Primary Scenario (Bearish)
Price pulls back to 4.148 – 4.152, retests the descending trendline → rejection → moves down toward:
TP1: 3.995
TP2: 3.890
⭐️Alternative Scenario (Bullish)
Valid only if:
Price breaks above the descending trendline
Closes above 4.160
→ Next target: 4.250
TRADING RECOMMENDATIONS
BUY GOLD: 3890 – 3888
SL: 3878
TP: 100 – 300 – 500 pips
SELL GOLD: 4250 – 4248
SL: 4260
TP: 100 – 300 – 500 pips

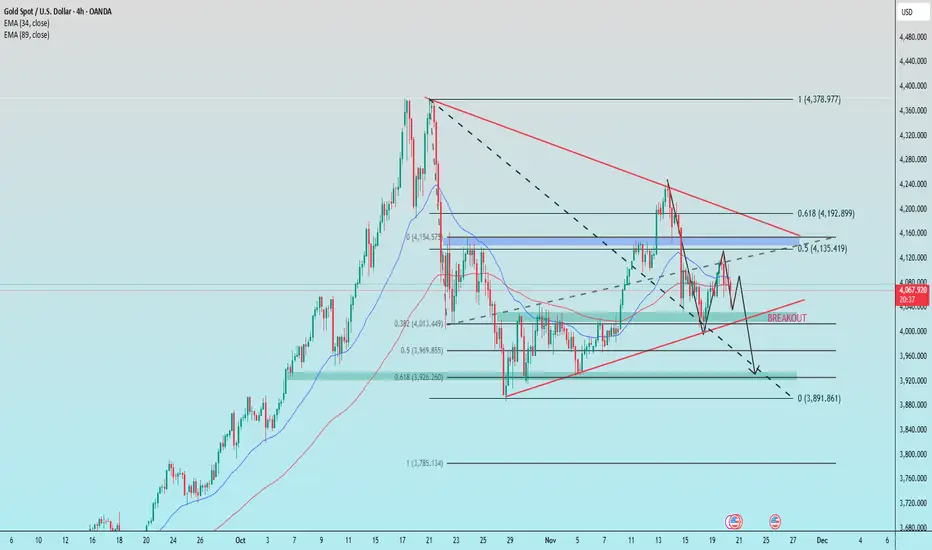
Moving sideways and waiting for a breakout🔍 1. Descending Trendline (red line)
This is an important dynamic resistance.
Price has touched the descending trendline many times and been rejected → the overall trend still leans bearish.
Each retest of the trendline that fails to break gives a sell signal.
👉 Only when price closes above the descending trendline will the short-term trend have a chance to reverse.
🟦 2. Upper Resistance (light blue zone)
This is the area where the market previously made a strong reversal → strong supply zone.
If price breaks the trendline and moves toward this zone, it is a high-probability area where selling pressure may appear again.
🟩 3. Key Support (green zone)
Price has reacted many times at this support zone → strong support.
This is also where price can form a reversal pattern if buyers return.
👉 If price breaks below this support, the bearish trend will continue strongly toward the lower support zone.
🔄 4. Trading Scenarios
Scenario 1: Breakout of the descending trendline → Price moves up to resistance
Price may bounce from the current support area → move up to retest the descending trendline.
If the trendline is broken and retested successfully → target is the major resistance zone above.
For BUY:
Wait for a break & retest of the descending trendline.
BUY GOLD : 4000 - 3998
Stoploss : 3988
Take Profit : 100-300-500pips
SELL GOLD : 4130 - 4132
Stoploss : 4142
Take Profit : 100-300-500pips

ETH/USDT 1W review1. Broken uptrend
The black upward trend line has been clearly broken down.
➡️ This is a signal of a change in the market structure from uptrend → downtrend.
⸻
2. The current candle is under the important support of USD 3,070
You marked the ~3070 level as previous support.
Now the price is clearly below it, which suggests:
• breaking support,
• a retest from below may occur,
• continuation of declines is likely.
⸻
3. Another important support on the chart
I see strong levels:
🔴 #1 Support: $2,830 - $2,900 (current price)
This is the zone where the price is trying to hold – but it looks like there is a weak reaction.
🔴 Backer #2: $2,147
This is a wide zone where the upward impulse previously began.
➡️ If ETH drops below 2800-2830, the next logical target is 2150-2200.
⸻
4. RSI (1W) shows a downward trend
• RSI is around 40, which is close to the oversold zone.
• The RSI trend has been down for months.
• No bullish divergence (no trend reversal signal).
➡️ This supports the narrative of further declines.
⸻
5. Candle structure - clear downward momentum
Some previous candles:
• large red bodies,
• no aggressive buying,
• reflections are weak,
• The weekly candle currently looks bearish.
⸻
📊 Technical Summary
Based on the chart:
Short-term and medium-term trends: downward
The price broke key supports
Most likely scenario:
➡️ Continued declines to USD 2,150-2,200
if the 2830 level is broken and the weekly candle closes below.
⸻
📈 When would things look like they would turn around?
Only if:
✔️ Price will return above 3070
✔️ And will maintain a weekly close above this level
✔️ RSI will bounce up and divergence will appear
Then we can talk about a greater chance of returning to 3,500 and beyond.

NONFARM returns after many days of closure1. Trendline
Descending trendline (upper): Strong dynamic resistance, price is repeatedly rejected → main trend remains bearish.
Ascending trendline (lower): Dynamic support, but has just been broken downward → buying pressure is weakening.
2. Key Support Levels
3,926 – 3,969 (Fibo 0.5–0.618): Strong confluence zone, the main target if the ascending trendline breaks.
3,891 (Fibo extension 1.0): Deep support, potential area for a short-term bottom.
3. Key Resistance Levels
4,135 – 4,155 (Fibo 0.5 + supply): Strongest resistance, price faced strong rejection here.
4,192 – 4,200 (Fibo 0.618): Higher resistance, aligned with the descending trendline → strong selling confluence.
Trade Ideas
BUY GOLD : 3948 – 3950
Stoploss: 3938
Take Profit: 100–300–500 pips
SELL GOLD : 4148 – 4150
Stoploss: 4160
Take Profit: 100–300–500 pips
TECHNICAL ANALYSIS – BTC (4H)📉
1. Main trend – still down
I see a clear downward trend channel (yellow lines) on the chart. The price is moving in the lower half of the channel, which means that supply pressure is still dominant.
2. Rebound, but under strong resistance
The recent upside breakout looks more like a correction in a downtrend than a reversal.
The closest resistance levels I see on the chart:
94,500 – 95,000 → EMA + local level
96,000 – 96,500 → next EMA
98,000 – 99,000 → key level where the SMAs are located
Until BTC breaks above 96,500–97,000, there's no way a sustained trend reversal will occur.
3. Current Reaction at the SMA/EMA
The price touched the red moving average (SMA?) but was rejected—a classic reaction in a downtrend.
This signals:
a lack of buying power,
a predominance of supply in the 93,300–94,500 area.
4. Support Levels I See
At the bottom, you have specific lines that make sense:
89,900–90,000 → key support
89,500 → marked level
87,600–86,500 → lower part of the channel + previous bounce
If BTC loses 89,500, a move to the 87,000–86,500 area is very likely.
5. MACD – early, but cautious signal
The MACD has started to move up, but:
there is no clear crossover yet,
the histogram is weak.
Interpretation:
The rebound continues, but there is no confirmation of a trend change.
6. RSI – slightly bullish, but neutral
RSI ~49, so:
it is not oversold,
it is not overbought,
there is room for both a further rebound and a decline.
The RSI does not provide a strong directional signal.
📌 Summary – what looks most realistic?
Baseline scenario (60% chance): continued decline
Price will rebound to:
94,000–95,000,
possibly to the upper band of the channel (95–96K),
and be rejected → a decline to 89,500, and then 87,000–86,500.
Bullish scenario (40%): breakout of the channel
We need to see:
a 4-hour candle close above 96,500,
preferably a retest and hold,
only then can we talk about a trend reversal and a move towards 98,500–100,000.
📈 Market assessment (neutral–bearish)
Everything indicates that we are only in a correction within the descending channel. Until BTC breaks ~96.5K, the advantage is on the bears' side.

What will be the next gold trend on November 18th?1. Trend and Trend Lines
Prices are trading below a major descending trend line.
→ The overall trend remains down.
The long-term ascending trend line (red) has already broken out,
signaling weakening buying pressure and increased downward pressure.
2. Key Resistance
4.103 – 4.105:
Strong resistance zone where the Fibonacci (0.618–0.5), horizontal resistance, and EMA overlap.
→ Selling is likely to reassert itself in this price range.
3. Key Support
3.932 – 3.940:
This is the strongest support zone, overlapping the Fibonacci extension at 2.618.
This is an important low point in the bearish structure.
4. Price Scenario
If prices fail to retest the resistance at 4.103,
→ A continued decline along the downward trend is likely.
The next target is around 3.932 – 3.950.
Summary
Major Trend: Downward
Strong Resistance: 4.103 – 4.105
Target Support: 3.932 – 3.950
Structure: Trendline Break + Fibo Extension → Prefer Downward Scenario
BUY GOLD: 3932 – 3930
Stop Loss: 3922
Take Profit: 100–300–500 pips
SELL SCALP GOLD: 4064 – 4066
Stop Loss: 4073
Take Profit: 100–300–500 pips
SELL GOLD: 4103 – 4105
Stop Loss: 4115
Take Profit: 100–300–500 pips

BTC Dominance Analysis – 1D📊
1. Main Trend
BTC.D is still moving within a large, ascending trend channel (yellow lines).
The price has currently rebounded from the lower band of the channel and is heading towards its center.
The long-term trend remains bullish, but short-term momentum is weakening.
📈 Key Levels on the Chart
Supports
59.20% – currently tested support + EMA 50 and SMA 50
→ a very important level. Its loss = downward pressure on BTC.D, favorable for altcoins.
58.24% – next strong support level
→ if 59.20% falls, a move to 58.24% is very likely.
57.05% – key structural support
→ breakout = the ascending trend is broken, altcoin season is off to a strong start.
Resistance
60.87% – local resistance from multiple candles + MA/EMA crossover
61.65% – strong upside target
64.68% – trend extreme (upper band of the channel)
→ if BTC moves solo, this level will be tested.
🔵 EMA / SMA 50/200
I can see a few key things in the screenshot:
The 50 EMA is below the 200 EMA – technically a death cross → a short-term bearish structure.
The price is exactly below the 200 EMA and stuck to the 50 EMA.
→ this is a typical consolidation zone before a breakout.
Conclusion:
If BTC.D breaks 60.8% → momentum returns to BTC's side.
If it falls below 59.20% → altcoins receive a signal to rebound.
🔴 MACD
The MACD is above 0, but the crossing line is bearish (the blue line crosses the signal from above).
The histogram turns red.
Conclusion:
Momentum is decreasing → a short-term bearish signal.
🟣 RSI
RSI is around 53, which is neutral.
A downward breakout of the MA onto the RSI → a weakening impulse.
Conclusion:
The RSI does not support a strong move either up or down — but the slight slope suggests a correction.
📌 SCENARIOS
🟢 Bullish (pro-BTC)
Condition: 60.8% breakout
➡️ Targets:
61.6%
64.6% (channel top)
This means:
➡️ BTC dominates the market
➡️ ALTs are bleeding or stagnating
🔴 Bearish (pro-alts)
Condition: 59.20% breakout
➡️ Bearish targets:
58.24%
57.05% → and this is where the real alt season begins
This means:
➡️ Alts are starting to pump harder
➡️ BTC is losing dominance
🟡 Neutral / sideway
BTC.D between 59.2% and 60.8%
→ range consolidation, lack of major market decision
→ typical for periods when the entire crypto market stands still and "waits"

BTC/USDT 1H Short-Term (maintaining support)📉 MARKET STRUCTURE
1. Trend
The chart shows a clear falling wedge, which statistically is a pro-growth pattern—breakouts most often occur upwards.
Upper wedge line: ~96,400 USDT
Lower wedge line: ~93,750 USDT
The price has just rebounded from the lower edge—this is a key demand level.
📊 SUPPORT AND RESISTANCE LEVELS
Support (demand):
93,750 – lower wedge line
93,300 – strong chart level
92,650 – lower support, strong volume reaction
Resistance (supply):
95,000 – 95,450 – local resistance (supply often returns here)
96,400 – resistance key + upper wedge line
📈 INDICATORS
Stoch RSI (1h)
We have rebounded from the oversold level.
The %K line is breaking the %D line upwards → a signal of a potential short-term rebound.
MACD
The histogram is decreasing, but the first signs of flattening are visible.
The MACD line is still below the signal line, but is approaching → momentum for a reversal is beginning.
Volume
Volume increased on bearish candles, but near the bottom, two demand candles with increased volume appeared → buyers reacted at support.
📌 CONCLUSIONS
✔️ Bullish short-term scenario (more likely at this point):
Bounce from 93,750 + rising indicators = local upward correction.
Targets:
94,800 – 95,000
95,450
96,400 (upper band of the wedge — an important decision point)
❌ Bearish scenario (if support breaks):
A drop below 93,750 on strong volume opens the door to:
93,300
92,650 (a large defensive level — aggressive demand could enter here)

What will the gold price be next week 11-21/2025?📊 Support – Resistance – Fibonacci Analysis
1. Trend Overview
Price has broken below the ascending channel, signaling a shift into a corrective downtrend phase.
2. Key Resistance Zone
4,155 – 4,170
Confluence of Fibonacci retracement 0.5 – 0.618
Overlaps with a supply zone + EMA20
→ Strong resistance, high probability of selling pressure.
This is also the expected pullback/retest area before the next bearish leg.
3. Key Support Levels
Support 1 – 4,108
Fibonacci extension 1.0
Horizontal support
→ Likely to generate a short-term reaction.
Support 2 – 3,950 (Fibo 2.618)
Major downside target if the structure fully breaks
→ Primary bearish target for a deeper continuation.
4. Price Scenario
Price may pull back toward 4,155 – 4,170, then:
→ Resume the downtrend, targeting 4,108.
A clean break below 4,108 opens the path toward 3,950 (Fibo 2.618).
BUY GOLD : 3950 - 3947
Stoploss : 3937
Take Profit : 100-300-500pips
SELL GOLD : 4250 - 4253
Stoploss : 4263
Take Profit : 100-300-500pips

BTC 1W Chart !🔥 1. GENERAL TREND (1W)
The long-term trend is still upwards because:
• the price stays in the orange channel,
• the black trend line (key) has not been broken.
But at the same time:
➡️ We see correction after local ATH around 115-120k.
This is a typical cyclical decline after breaking out from the extremes.
⸻
🔥 2. KEY LEVELS OF YOUR CHART
Closest support (S)
1. 94 315 → current retest
2. 85,895 → key trend support
3. 74,896 → the most important defensive level against mega relegation
Nearest resistances (R)
1. 105,901 – the first serious resistance
2. 114 437 – strong ceiling
3. 125,907 – potential target for a new growth impulse
⸻
🔥 3. STOCHASTIC SITUATION (1W)
Stoch is deeply oversold → a signal of a potential rebound.
On a weekly basis, such signals usually mean:
• local minimum,
• beginning of a new growth wave in the 4-8 week window.
⸻
🔥 4. MARKET STRUCTURE (PRICE ACTION)
The current candles suggest:
• a strong defense attempt on 94k,
• getting closer to the black trend line,
• there is still room to move higher in the orange channel.
This looks like:
➡️ a correction in the upward trend, not a change in the trend.
⸻
🔥 5. SCENARIO FOR THE NEXT WEEKS
🟢 Growth scenario (more likely)
Condition: maintaining 94k or black trendline
Targets:
• 105,900 – first target
• 114,400 – medium target
• 125 900 – full swing to the upper edge of the channel
Probability: 60-70%
(because Stoch is sold out + entry to support the channel)
⸻
🔴 Downside scenario (less realistic)
Condition: weekly close below the black trendline
Only then do we fly:
1. 85,900
2. 74,900 – an absolute must-hold
A break of 74,900 would mean:
➡️ end of the growth channel
➡️ entering a long-term bear market
Probability: 30-40%
⸻
🔥 6. Summary in points
Current situation
• BTC is sitting right on support.
• Weekly Stochastic = buy signal.
• Growth channel still intact.
• The market looks like it's getting ready to rebound.
If 94k stays → we go to 105k+, then 114k.
If he hits the black line → 85k and 74k in the game.

Gold price developments today, November 141. Trendline
Descending trendline (upper red): Price is repeatedly rejected here → a strong dynamic resistance.
Ascending trendline (lower red): Price has bounced multiple times → an important dynamic support, forming a confluence with the 0.618 Fibonacci level.
2. Resistance
4,215 – 4,225:
Supply zone + confluence with the descending trendline → a high-probability selling area.
If price breaks strongly above 4,225, the next expansion target is 4,244.
3. Support
4,172 – 4,155 (Fibo 0.5 – 0.618):
Nearest support, likely to see a reaction.
4,127 – 4,130:
The strongest support zone, aligned with the ascending trendline → a potential buying area.
4. Price Scenarios
Scenario 1 (primary):
Price retraces to retest 4,215–4,225, gets rejected → declines toward 4,155 or deeper to 4,127.
Scenario 2:
If the descending trendline breaks, price could rally strongly toward 4,244.
BUY GOLD : 4127 - 4130
Stoploss : 4113
Take Profit : 100-300-500pips
SELL GOLD : 4221-4224
Stoploss : 4233
Take Profit : 100-300-500pips

BTC/USD 4H chart 🧭 1️⃣ Market structure
• We see a clear upward channel (black trend lines) - the price has been moving within it for several days/weeks.
• Current price: ~USD 101,630, which is just above the lower border of the channel (dynamic support).
• Latest high: ~$107,360 - this is local resistance.
• Final low: ~$99,000 - this is key psychological and technical support.
➡️ Medium-term trend: still upwards, but currently in a downward correction wave 📉 3️⃣ Technical indicators
🔸 Stochastic RSI (bottom panel)
• Both components (blue and orange lines) are close to the oversold zone (<20).
• This is a signal that sellers may be losing momentum, and a rebound from the lower support is possible in the coming hours.
⸻
⚖️ 4️⃣ Short-term scenarios (4H – 1D)
🟢 Bull scenario (probability around 60%)
• The rate remains above USD 101,400 (lower border of the channel).
• Stochastic RSI begins to rebound → buy signal.
• Potential move up to:
• USD 103,900 (first target)
• USD 105,900 (second target)
• USD 107,300 (main resistance)
➡️ Scenario invalidation: 4H candle close below USD 101,000.
⸻
🔴 Bear scenario (probability approx. 40%)
• Breakout of the USD 101,000 level with a 4H close below.
• Decline to $99,000-99,200 zone (major support).
• If this support breaks, next goals:
• $97,800
• $95,000
⸻
📊 5️⃣ Technical signal (4H)
➡️ Decision Zone: $101,000-$101,800
➡️ Technical signal: possible short-term rebound (RSI oversold, close to channel support).
➡️ Confirmation: 4H candle closing above USD 102,000 with volume - then a chance of a move to USD 104-106k.

BTC/USD 1D Chart🧭 Overall Market Picture
Bitcoin is in a medium-term downtrend, as confirmed by:
a descending channel (marked with white lines),
lower highs and lower lows,
price below the key EMA and SMA.
The price is currently testing the upper boundary of this channel, so it will be crucial whether it manages to break out of it to the upside or rebounds further down.
🔹 Key Price Levels
Support:
$100,650 — short-term support, previously seen price reactions.
$98,550 — next demand level from late October.
$96,950 — lower boundary of the descending channel, potential target for continued declines.
Resistance:
$106,300–$106,500 — current resistance (upper boundary of the channel + SMA100).
$109,700–$110,000 — strong resistance converging with the EMA200 and SMA200.
$112,000+ — channel breakout and trend change.
🔸 Technical Indicators
1. MACD
The histogram is starting to turn positive (descending red).
The MACD line is attempting to cross the signal from below — a potential bullish signal, but not yet confirmed.
➡️ Indicates a possible short-term upward correction within a downtrend.
2. RSI (14)
Value: ~40.5 — low, but has rebounded from oversold levels.
No bullish divergence, but the RSI is rising from below, suggesting a potential technical bounce.
➡️ Still more upside than downside before entering the overbought zone.
🔹 Moving Averages
EMA50 (~109,970 USD) and EMA200 (~110,380 USD) are above the price, confirming the downtrend.
The EMA50 < EMA200 cross holds – a classic death cross.
SMA100 (~106,300 USD) has just been tested – a key level that could determine the direction of the coming days.
🔸 Short-Term Scenarios
🟩 Bullish (30–40% chance)
Breakthrough of the upper channel line (~106.5k USD) + daily close above 107k USD.
Confirmation of the MACD and RSI signal > 50.
Targets: 109,700 → 111,500 → 113,800 USD.
➡️ A medium-term trend reversal is then possible.
🟥 Bearish (60–70% chance)
Bounce from the upper channel line and fall below 102k–101k.
Continuation of the downtrend.
Targets: 100,600 → 98,500 → 96,900 USD.
➡️ In this scenario, the market will maintain a lower high/lower low structure.
⚙️ Summary
Trend: Down, but with a short-term rebound attempt.
Key moment: reaction to the 106k–107k USD level.
If the channel with volume breaks, a bullish reversal.
If a rebound, a new low around 97k–99k USD is very possible.

Taking tiny profits from very short-term trades USDJPY USDJPY Technical Outlook - 11 Nov 2025
USD/JPY consolidates at 154.322 (8:25 AM UTC+4) within a critical decision zone
━━━━━━━━━━━━━━━━━━━━━━━━━━━━━━━━━━━━
⚡ EXECUTIVE SUMMARY
Price action reveals Wyckoff distribution characteristics following the October surge. Dow Theory signals weakening momentum with lower highs forming. Gann analysis identifies 154.50 as a pivotal resistance level, while 153.80 provides critical support through Square-of-9 calculations.
━━━━━━━━━━━━━━━━━━━━━━━━━━━━━━━━━━━━
🔬 CROSS-TIMEFRAME ANALYSIS
💠 Daily Perspective: Spinning top candlestick cluster near 154.00 suggests indecision; Ichimoku cloud support rests at 152.50; RSI 48 (neutral territory)
💠 4-Hour View: Rectangle consolidation pattern (153.80-154.50); bearish divergence on RSI; EMA50/EMA200 flat (trend exhaustion)
💠 1-Hour Structure: Potential head-and-shoulders formation with neckline at 153.80; VWAP oscillating around 154.15; volume declining
💠 30-Minute Action: Descending triangle forming; Bollinger Bands in extreme squeeze (bandwidth 0.6%); hidden bear divergence
💠 15-Minute Setup: Bearish pennant below 154.40; Tenkan55 + VWAP reclaim
━━━━━━━━━━━━━━━━━━━━━━━━━━━━━━━━━━━━
🎯 BREAKOUT SCENARIOS
⬆️ Upside Break: Sustained 1H close above 154.50 opens 155.00 target (invalidates H&S;)
⬇️ Downside Break: 1H close below 153.80 activates 153.20 measured move (H&S; completion)
━━━━━━━━━━━━━━━━━━━━━━━━━━━━━━━━━━━━
📉 TECHNICAL INDICATOR CONSENSUS
RSI (Multiple TFs): Bearish divergence on 4H; neutral 1H; overbought 15M
Bollinger Bands: Extreme squeeze on 30M signals imminent volatility expansion
VWAP: Acting as dynamic resistance; sellers defending 154.20
Moving Averages: Death cross risk on 4H (EMA21 approaching EMA50 from above)
Ichimoku: Price below cloud on 1H; Chikou span trapped below price (bearish)
━━━━━━━━━━━━━━━━━━━━━━━━━━━━━━━━━━━━
⚠️ CRITICAL PATTERN ALERTS
🚨 Head-and-shoulders neckline at 153.80 (breakdown = -70 pip target)
🚨 Harmonic bearish Gartley forming; PRZ completion at 154.50
🚨 Bull trap risk above 154.40 if volume remains weak
🚨 Elliott Wave suggests Wave C correction targeting 153.50-153.20
━━━━━━━━━━━━━━━━━━━━━━━━━━━━━━━━━━━━
🕐 TIMING & CATALYSTS
Tokyo session close at 09:00 UTC typically triggers volatility
BoJ intervention zone historically around 155.00+ (extreme caution)
Gann time cycle suggests reversal window 10:00-12:00 UTC
ATR(14) = 0.85 (elevated intraday range expected)
━━━━━━━━━━━━━━━━━━━━━━━━━━━━━━━━━━━━
🛡️ RISK PARAMETERS
Position Size: Limit to 0.75% account risk (intervention uncertainty)
Avoid holding through London open (08:00 GMT) without stops
Scale out 40% at first target; trail remainder with 20-pip buffer
False breakout probability HIGH—wait for confirmation closes
━━━━━━━━━━━━━━━━━━━━━━━━━━━━━━━━━━━━
This analysis serves educational purposes. Central bank intervention risk remains elevated. Trade with strict risk management and adapt to evolving price action.

GBPJPY IDEA FOR OCT, 11TH 2025.The price is breaking new highs, which signals bullish momentum. If the price holds its current zone of resistance, that signals expectations of short-term selling power. Before it continues upwards, the price is still overall bullish.
As usual, my calls or analysis are based on what I see, the current Bias, and from a probability standpoint, meaning that this projection may be or may not be validated, so tread carefully. This is not financial advice; trade responsibly.

Chart Talk - Nifty it not yet Complete Bullish Hey Guys Welcome to Chart Talk
Today Nifty opened Gap-up and sustained went upside but after that the resistance came so market down over all trend looks down for tomorrow I have explained my View
Thank you

ETH/USDT 1D Chart📊 Current situation
• Price: approx. USDT 3,402
• Main trend: downwards - there is a clear downtrend line (black line) which acts as strong resistance.
• Key zones:
• Resistance: 3490-3990 USDT (green zones)
• Support: 3185 and 2700 USDT (red zones)
⸻
🧠 Market structure
• ETH moves below the trendline, confirming the dominance of sellers.
• After the recent decline, there was a rebound from the support at USDT 3185, but buyers' power is limited - daily candles have long upper wicks → supply pressure.
• If the price does not break through USDT 3,490–3,500, there is a risk of a retest of the USDT 3,185 support, and if it is broken, a possible decline to around USDT 2,700.
⸻
⚙️ Stochastic RSI (bottom of chart)
• Stochastic RSI is in the oversold zone (approx. 30), but the lines have not moved significantly upwards yet - i.e. there is no confirmed buy signal.
• If the indicator starts to curve upwards and crosses above 20, it could indicate a short-term rebound (upside potential to USDT 3,490).
⸻
🧭 Scenarios
🔺 Growth scenario (less likely)
• Breaking the trendline and staying above 3490 USDT will open the way to 3990 USDT.
• Requires increased buying volume (volume looks rather neutral for now).
🔻 Downside scenario (more likely)
• Rejection from 3490 USDT or from the trendline → drop to 3185 USDT.
• Breakout of 3185 = move to 2700 USDT (strong support from previous consolidations).
⸻
📈 Summary
• Trend: downward
• Short term: possible rebound to 3490, but the risk of further decline remains high.
• Key level to watch: 3,490 USDT (if it does not break, it is better to avoid longs).
• Potential long signal: only after breaking the trendline and retesting with confirmation of RSI > 50.

LTC/USDT 1D🕵️♂️ The overall picture
• Price: 102.50 USDT
• Trend: The current downtrend is down (black downtrend line), but we are currently breaking above the trendline, which may signal a change in direction.
• Interval: Daily (1D)
⸻
📊 Key technical levels
• Resistance 1: 106.99 USDT
• Resistance 2: 119.25 USDT
• Support 1: 95.61 USDT
• Support 2: 89.65 USDT
• Support 3: 79.90 USDT
The current candle has broken above the downtrend line and the level of 95.6 USDT, which is a bullish signal.
⸻
🔥 Volume
• You can see a big increase in volume during today's bullish candle - this confirms that the buyers are in control.
• This is a classic example of a confirmed breakout from a downtrend.
⸻
📈 Candles
• Today's candle is a strong demand candle (green) with a large body.
• If today's close stays above the trend line (~100 USDT), it will be a technical confirmation of the breakout.
⸻
⚙️ Stochastic RSI indicator
• The blue line (RSI) is rebounding from the oversold area (<20) and heading upwards - this is a buy signal.
• The orange line begins to turn in the same direction, which may indicate the beginning of an upward impulse.
⸻
💡 Scenarios:
🟢 Growth scenario (more likely):
• Maintaining the price above 100 USDT = breakout confirmed.
• Potential targets:
• 106.99 USDT – first test of resistance, possible short pullback.
• 119.25 USDT – main target in the medium term (approx. +16%).
🔴 Downside scenario (if the breakout turns out to be false):
• Return below 95.6 USDT and closing of the daily candle there = false breakout signal.
• Then a possible decline to 89.65 USDT, and with further weakness even 79.90 USDT.
