Target (TGT) Could be attempting to Reverse Bear TrendThis is an analysis of the 1 Week or Macro timeframe. We zoom out to get a feel for the big picture moves.
Where Target's current price action has reached, it warrants attention and to me is a critical area to watch.
Why critical? Well, we have reached the Upper bounds of Targets Bearish Channel so we either attempt for a break of the resistance holding us down or we continue the Bearish trend downwards.
Why Bearish channel or trend? Because technical analysis 101 says that the observation of Lower Highs and Lower Lows are indicative of a bearish trend.
It can't be any clearer. With this established, its always important to remember:
The Trend Is Your Friend. Probabilities dictate that price action will continue to move in the direction of the established trend. Until ofcourse it doesn't by printing reversal signs/ signals, etc.
Notice the Green rectangle highlighting the Price action of the last 10 months-ish.
In April 2025, we reached a price of around $86.00, bounced from here to around $105.00 and again fell back down to around $86.00 in the Fall of 2025.
Reaching $86.00 twice, is a Double bottom formation. A potential sign of an attempt to reverse trend.
Now in recent Price Action we are currently around $112.00. This is our first Higher high since we began our Bearish trend in October 2021.
The Green Zone can also potentially becoming a multi year consolidation range.
Which is why again i would say is a critical area and warrants attention.
What i'm looking to see is how price action interacts with this current price zone highlighted in Orange, titled "Confluence of Resistance". Its not going to be easy as people will look to unload stock, as many have held stock since the highs of $231.00.
A clear sign that Bullish Trend is getting stronger is if we break above the Red Resistance Trend line and Confirm Support and show clear signs of moving above the Orange zone as well.
Another sign would be a clear HIgher Low Print.
But do keep in mind, probabilities point to Current Trend Continuing unless something big happens.
So its exciting to see what plays out in the coming weeks to months as Target attempts big things or the big things fizzle out.
Follow for more updates.
Retailstocks

WALMART reached the Top of the 10-month Channel Up.Walmart (WMT) has been trading within a 10-month Channel Up with the price just hitting its top (Higher Highs trend-line) today. With the 1D RSI also vastly overbought on its Resistance Zone, this is the most optimal medium-term Sell Signal.
Most previous short-term corrections hit at least the 1D MA100 (green trend-line) but the previous similar rally that was as strong as the current one (+31.20%) bottomed not only on the 1D MA100 but also just above the 0.382 Fibonacci retracement level.
As a result, we have a short-term Target on Walmart at $118.
---
** Please LIKE 👍, FOLLOW ✅, SHARE 🙌 and COMMENT ✍ if you enjoy this idea! Also share your ideas and charts in the comments section below! This is best way to keep it relevant, support us, keep the content here free and allow the idea to reach as many people as possible. **
---
💸💸💸💸💸💸
👇 👇 👇 👇 👇 👇

Bark | BARK | Long at $0.84BARK, Inc. NYSE:BARK is a dog-focused company offering subscription-based products like BarkBox and Super Chewer, delivering monthly toys, treats, and pet supplies. It operates in Direct-to-Consumer and Commerce segments, selling through its website, retail partners, and e-commerce platforms. While not overly bullish here, especially given the economic / recession-fear headwinds, I think this is one of those stocks that may have a future "pop" as interest rates are lowered, or news emerges of the company expanding to new retail partners. A few insiders have recently purchased shares (~$75k under $1.00) and others have been awarded options. The book value currently rests near $0.64. It may dip between that price at $0.50 in the near-term. However, that's just been the trajectory of SO many of these SPAC stocks... dip then pop or bust.
Fundamentally, nothing to uproar over and this is a risky investment (Nasdaq delisting may occur). The positive is the debt-to-equity in 0.9x, which is pretty good for a small company. But 2026 is expected to be its worst earnings year. The future may look bright in 2027 and beyond, but can the company last? Time will tell.
Thus, for a swing trade, NYSE:BARK is in a personal buy zone at $0.84 with a risk of further near-term decline between $0.50 and $0.64.
Targets into 2027
$0.95 (+13.1%)
$1.25 (+48.8%)

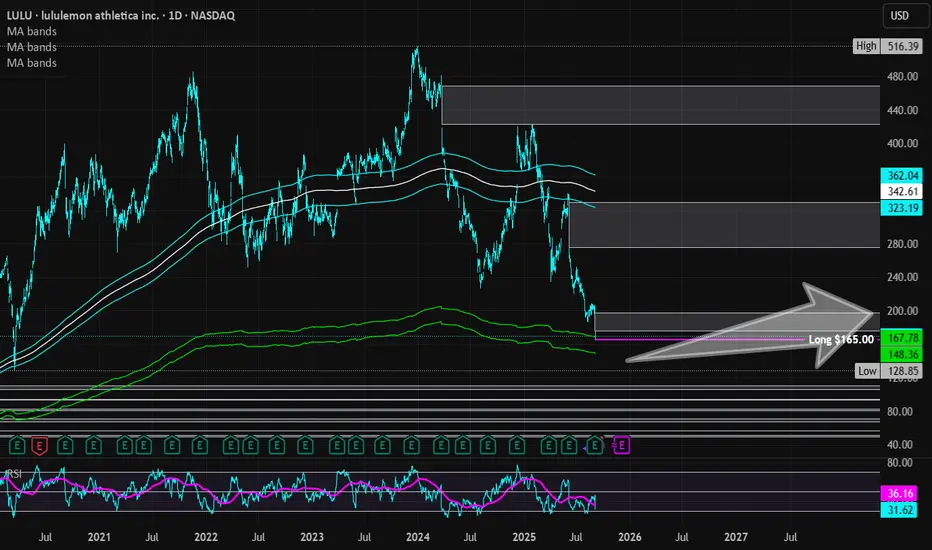
Lululemon Athletica | LULU | Long at $165.00Lululemon $NASDAQ:LULU. If you don't think the US is in a recession, examine most retail stocks right now. But this doesn't mean doom and gloom are here from a US government/news narrative - in fact, the complete opposite. AI and tech are solely propping up the US stock market ... but pay no attention to the issues behind the curtain! Once interest rates start dropping, trading and investing are going to get wild before the cracks open up.
Okay, off my soap box...
NASDAQ:LULU entered by "crash" simple moving average zone (green lines) today after earnings. Competition is finally catching up to the company, but expansion into China and other foreign areas *may* revive them in the next 1-2 years. While most analysts are relatively bullish, I'll stay centered. I wouldn't be surprised if the stock dips into the $140's and $150's in the near-term. Bigger news will have to come out for me to stay long-term, but I'm holding here or even lower. Additional entries will be made in the $140's-$150's to swap out the position I just made at $165.00 for the future.
Thus, at $165.00, NASDAQ:LULU is in a personal buy zone with the risk of a continued drop to the $140's and $150s. Christmas rally potential...
Targets into 2028:
$185.00 (+12.1%)
$197.00 (+19.4%)
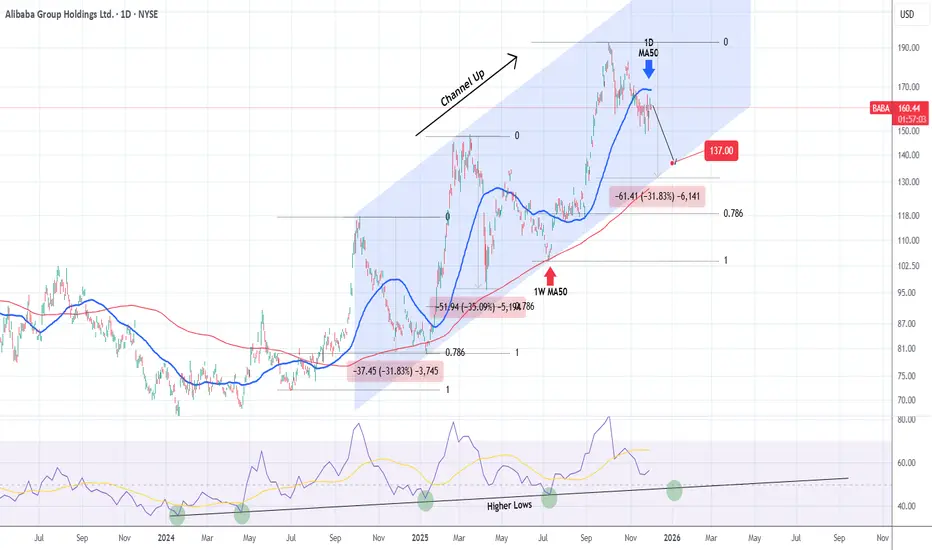
ALIBABA This correction isn't over.Alibaba (BABA) has been trading within a Channel Up since the October 07 2024 High. Right now it is on the 3rd Bearish Leg of this pattern, confirmed below the 1D MA50 (blue trend-line).
Both previous Bearish Legs touched the 1W MA50 (red trend-line) and the 1W RSI Higher Lows trend-line.
We expect that to happen at $137.00 (at least), which still puts the stock above both the 0.786 Fibonacci retracement level of the Bullish Leg and the -31.83% drop of the first Bearish Leg.
---
** Please LIKE 👍, FOLLOW ✅, SHARE 🙌 and COMMENT ✍ if you enjoy this idea! Also share your ideas and charts in the comments section below! This is best way to keep it relevant, support us, keep the content here free and allow the idea to reach as many people as possible. **
---
💸💸💸💸💸💸
👇 👇 👇 👇 👇 👇
COSTCO may be the most durable choice in this Bear Cycle.Costco (COST) has been trading within a 17-year Channel Up ever since the 2008 Housing Crisis. Since its June 2025 High, it has been on a steady decline, contrary to the big gains of other high cap stocks (mainly tech).
During this decline, it has broken below its 1W MA50 (blue trend-line), which has been the main Support of the Bull Cycle since May 2023, confirming its Bear Cycle.
However, it just hit its 1W MA100 (green trend-line), a critical level as it is the one that not only formed the bottom of the 2022 Bear Cycle but has also been holding since September 2017, providing numerous excellent buy entry opportunities.
With the 1M RSI also approaching its 9-year Support Zone, we believe that Costco may be one of the most durable stock investment choices during the upcoming Bear Cycle on stock indices. The Sine Waves are laying out a rather solid mapping of key market top formation periods long-term and we are currently far from one.
The 17-year Channel Up is currently on its 3rd major Bullish Leg and remarkably enough the previous two both rose by the exact same percentage, 347.16%. If the current Bullish Leg repeats that from its 2022 bottom, then we can expect this stock to reach $1800 around 2028.
---
** Please LIKE 👍, FOLLOW ✅, SHARE 🙌 and COMMENT ✍ if you enjoy this idea! Also share your ideas and charts in the comments section below! This is best way to keep it relevant, support us, keep the content here free and allow the idea to reach as many people as possible. **
---
💸💸💸💸💸💸
👇 👇 👇 👇 👇 👇

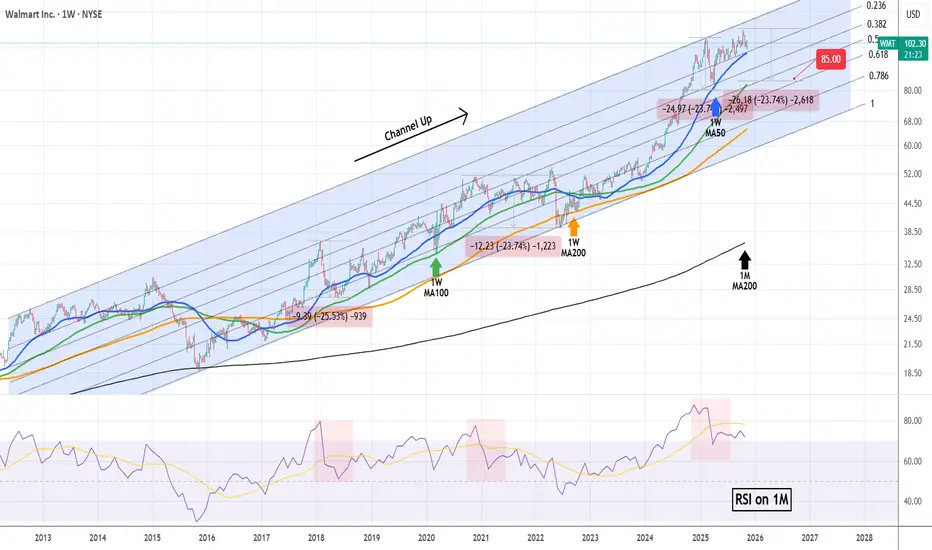
WALMART can correct to $85.00 if this level breaks.Exactly 5 months ago (June 12, see chart below), we gave a strong buy signal on Walmart (WMT) right at the bottom of its trend, which eventually hit our $110 Target and then got rejected:
This time we move to the larger 1W time-frame as our former Target was eventually a new All Time High (ATH) almost at the top of the 13-year Channel Up. The price is hanging tightly now on the 1W MA50 (blue trend-line), which is where the previous correction (Feb-March 2025) found Support and rebounded.
With the 1M RSI printing a formation that previous delivered two technical pull-backs of -23.74%, we expect the stock to start correcting again if it closes below the 1W MA50. All previous breaks below it, eventually led to a 1W MA100 (green trend-line) test.
If that takes place, we expect Walmart to hit at least $85.00 inside 2026.
---
** Please LIKE 👍, FOLLOW ✅, SHARE 🙌 and COMMENT ✍ if you enjoy this idea! Also share your ideas and charts in the comments section below! This is best way to keep it relevant, support us, keep the content here free and allow the idea to reach as many people as possible. **
---
💸💸💸💸💸💸
👇 👇 👇 👇 👇 👇
WShort
Global E-Online | GLBE | Long at $34.55Global-e Online NASDAQ:GLBE provides a direct-to-consumer, cross-border e-commerce platform. It enables merchants to sell internationally and shoppers to buy globally, handling localization, payments, shipping, and logistics for worldwide transactions. Some companies NASDAQ:GLBE handles transactions for include Bath & Body Works, Victoria's Secret, SKIMS, Forever 21, and many more.
Technical Analysis
NASDAQ:GLBE is currently in a consolidation / "share accumulation" phase (i.e. trading sideways, overall), and the price is riding within my selected historical simple moving average. Often, the price will bounce along this area until momentum picks up and then it's off to the races to fill all the open price gaps above on the daily chart. The only concern I have is there is an open price gap on the daily chart near $21 that will likely get filled at some point. However, the earnings and revenue projections, if accurate, may delay this area from being filled for some time.
Revenue and Earnings Growth into 2028
538% earnings-per-share growth expected between 2025 ($0.34) and 2028 ($2.17).
98% revenue growth projected between 2025 ($946 million) and 2028 ($1.87 billion).
www.tradingview.com
Health
Extremely healthy, financially.
Debt-to-Equity: 0x (can't beat that)
Quick Ratio / Ability to Pay Today's Bills: 2.5x (no issues)
Altman's Z-Score/Bankruptcy Risk: 11.6 (extremely low risk)
Action
The projected growth of NASDAQ:GLBE makes sense if there is continued rapid on-boarding of blue-chip clients. There is always the chance other companies, like Shopify, will partner, too. The company is also extremely financially healthy. It should be able to weather the storm in the near-term if there is a financial downturn. That is the only major risk I see here. If the economy flips globally, such companies, regardless of their performance, will get hit hard. However, if the growth is accurate, this is a no-brainer value/growth play. Time will tell.... thus, at $34.55, NASDAQ:GLBE is in a personal buy zone with near-term risks of a drop to $21 or below if the world economy flips.
Targets into 2028
$50.00 (+44.7%)
$60.00 (+73.7%)

Wayfair (W) — Omnichannel Fuels ComebackCompany Overview:
Wayfair Inc. $W is a leading online retailer focused on home furnishings, décor, and furniture. With a tech-forward approach and efficient logistics, it delivers a premium customer experience while expanding into physical retail to blend scale with showroom appeal.
Key Catalysts:
🛋️ Q2 2025 Turnaround
Net revenue: $3.3B (+5% YoY)
Adjusted EBITDA margin: 6.3%, highest since 2021
Generated $230M in free cash flow, signaling operational strength
🏬 Retail Expansion
Launch of Perigold luxury showroom in Houston
New flagship Denver store bridges online and offline presence
Strengthens brand equity and engages tactile shoppers
📦 Operational Discipline
Despite 4.5% decline in active customers, Wayfair grew margins
Focused on higher order values and cost efficiency amid macro headwinds
Investment Outlook:
Bullish above: $72–$74
Upside target: $140–$145, supported by margin gains, omnichannel growth, and consumer demand rebound
#W #Wayfair #RetailStocks #Ecommerce #HomeFurnishings #Omnichannel #TechRetail #Investing

COSTCO Looking for a bottom to fuel rally to $1250.Last time we looked at Costco (COST) was 6 months ago (January 21) when we gave the most optimal buy signal exactly at the bottom of the Channel Up at the time, easily hitting our $1045 Target:
Since then, the stock has entered a new Accumulation Phase in the form of a Triangle and this week broke below its 1W MA50 (blue trend-line), which is where its previous bottom (Higher Low) was formed.
The last similar Triangle pattern was formed straight after the May 16 2022 market bottom and once it broke upwards it led to a massive rally. Even the 1W RSI sequences between the two fractals are similar.
Our Target is $1250, just below the 1.786 Fibonacci extension.
-------------------------------------------------------------------------------
** Please LIKE 👍, FOLLOW ✅, SHARE 🙌 and COMMENT ✍ if you enjoy this idea! Also share your ideas and charts in the comments section below! This is best way to keep it relevant, support us, keep the content here free and allow the idea to reach as many people as possible. **
-------------------------------------------------------------------------------
💸💸💸💸💸💸
👇 👇 👇 👇 👇 👇

WALMART testing its 1D MA50! Will it bounce?Walmart (WMT) hit yesterday its 1D MA50 (blue trend-line) for the first time since April 21. It appears that the rebound from the Trade War Low has turned sideways on a Double Top formation and the 1D MA50 is the first Support to be tested, with the 1D MA200 (orange trend-line) following.
This pattern resembles the August - September 2022 Bull Flag, which despite breaking below its 1D MA50, it resumed the uptrend shortly after and hit the 1.382 Fibonacci extension before the next 1D MA50 pull-back.
As a result, we expect the stock to reach $110.00 (Fib 1.382) by the end of the Summer.
-------------------------------------------------------------------------------
** Please LIKE 👍, FOLLOW ✅, SHARE 🙌 and COMMENT ✍ if you enjoy this idea! Also share your ideas and charts in the comments section below! This is best way to keep it relevant, support us, keep the content here free and allow the idea to reach as many people as possible. **
-------------------------------------------------------------------------------
💸💸💸💸💸💸
👇 👇 👇 👇 👇 👇
W

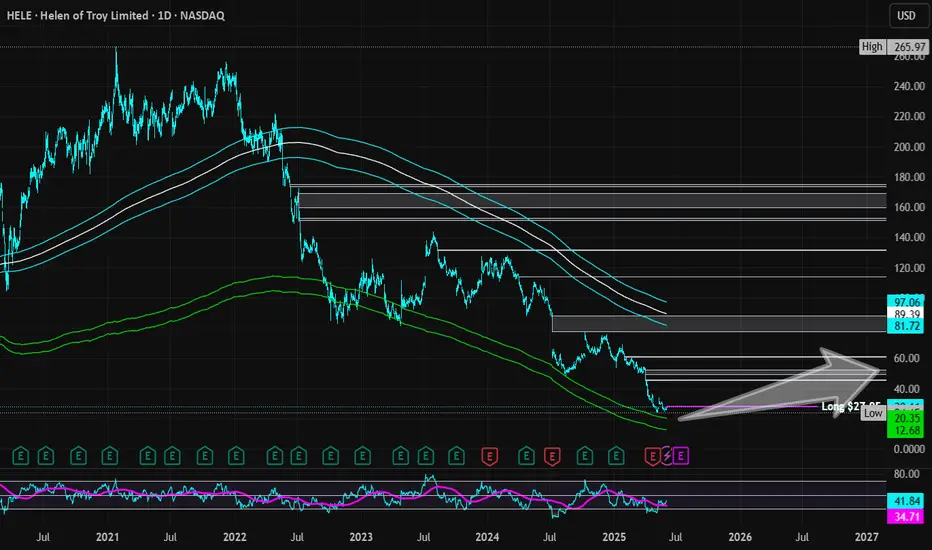
Helen of Troy | HELE | Long at $27.95Helen of Troy NASDAQ:HELE , owner of brands such as OXO, Hydro Flask, Osprey, Vicks, Olive & June, etc, has witnessed an immense decline in share price since its peak in 2021 when it hit just over $265. Now, trading in the $20s... Growth has been a problem for this company (now and future projections) and a major turnaround is needed. However, NASDAQ:HELE is implementing several growth strategies for 2025-2030 under its Elevate for Growth plan and Project Pegasus, so they are very aware of the need to re-inspire investor confidence. They also announced last month the appointment of an interim CEO and CFO. With a 22M float and 12% short interest, this could get interesting.
Excluding the current growth issue, the fundamentals of NASDAQ:HELE are quite strong:
P/E Ratio: 5x (undervalued)
Book Value: ~$70.00 a share (undervalued)
Debt-to-Equity: 0.6x (healthy)
Quick Ratio: Over 1 (healthy)
From a technical analysis perspective, it may have just formed a double-bottom near $24-$25, but a quick drop between $10-$20 is absolutely possible if bad economic news emerges.
At $27.95, NASDAQ:HELE is in a personal buy zone with a caution regarding the US economy and this company's ability to turn things around moving forward.
Targets:
$40.00 (+43.1%)
$52.00 (+86.0%)
Miniso: Holding SteadyMNSO showed little volatility last week, recording only minor single-digit percentage pullbacks. Still, we expect further downside ahead. As the decline continues, the stock should reach the green Target Zone between $9.90 and $7.33. Within that range, we anticipate the low of the green wave . This bottom should then set the stage for a new upward move, which should eventually break above the resistance at $35.22 via a turquoise five-wave structure.

WALMART 1W MA50 rebound makes a solid long-term investment.Walmart (WMT) ended its 2 month correction with an emphatic rebound on its 1W MA50 (blue trend-line). This is the first time it touches the 1W MA50 since December 11 2023 but it's not uncommon at all within its 10-year Channel Up.
Every time the stock hi its 1W MA50 while the 1W RSI was this low, it was the most common long-term buy opportunity. Better than that was only the one time it hit the 1W MA200 (orange trend-line) during the 2022 Inflation Crisis.
As a result, we expect at least a 2.0 Fibonacci extension rebound similar to the May 2018 Low, and our long-term Target is now $135.00.
-------------------------------------------------------------------------------
** Please LIKE 👍, FOLLOW ✅, SHARE 🙌 and COMMENT ✍ if you enjoy this idea! Also share your ideas and charts in the comments section below! This is best way to keep it relevant, support us, keep the content here free and allow the idea to reach as many people as possible. **
-------------------------------------------------------------------------------
💸💸💸💸💸💸
👇 👇 👇 👇 👇 👇
WLong

WALMART: Recovery will take time but it's worth the investment.Walmart is headed to an oversold condition on its 1D technical outlook (RSI = 36.324, MACD = -2.580, ADX = 37.504) but remains marginally neutral on 1W (RSI = 45.418). Based on its 13 year Channel Up and the 1W RSI pattern, it got rejected on its top but this 2 month decline is a usual correction inside this Channel. In fact we do expect the 1W MA50 to break but most likely the trend will find support on the Channel's middle trendline and start to gradually recover in 2026. The recovery process will be long but the prices are already to low and oversold, still one can wait for the 1W MA50 to break in order to confirm that, and buy for the long term. After all, the stock gained more than +160% in less than 3 years and an investment on the world's biggest groceries company with such amazing return, is a worthwhile one. Our target is $140 by the end of 2027/early 2028.
See how our prior idea has worked out:
## If you like our free content follow our profile to get more daily ideas. ##
## Comments and likes are greatly appreciated. ##
W

AMAZON ($AMZN) Q4—$187.8B REVENUE UPSWINGAMAZON ( NASDAQ:AMZN ) Q4—$187.8B REVENUE UPSWING
(1/9)
Good afternoon, TradginView! Amazon ( NASDAQ:AMZN ) posted Q4 ‘24 net sales of
187.8 B,up 10 637.959 B here’s the breakdown.
(2/9) – REVENUE GROWTH
• Q4 Sales: $ 187.8B, 10% up from $ 170B 📈
• Full ‘24: $ 637.959B, 10.99% rise 📊
• AWS: $ 28.8B, 19% YoY boost 💻
NASDAQ:AMZN ’s steady climb continues.
(3/9) – EARNINGS LIFT
• Q4 Op. Income: $ 21.2B, up from $ 13.2B 💰
• NA Op. Income: $ 9.3B, from $ 6.5B 🌞
• AWS Margin: 38%, decade high 🌟
NASDAQ:AMZN ’s profit engine hums strong.
(4/9) – KEY MOVES
• AI Push: GenAI apps rolled out 📡
• AWS: Cash flow dynamo shines 🌍
• Stock: 207−230 range 🚗
NASDAQ:AMZN ’s tech bets fuel growth.
(5/9) – RISKS IN FOCUS
• Spending: Retail feels price pinch ⚠️
• Regs: Antitrust looms large 🔒
• Comp: Azure, Walmart press hard 📉
NASDAQ:AMZN ’s solid, but hurdles lurk.
(6/9) – SWOT: STRENGTHS
• Retail: $ 115.6B Q4 NA sales 💪
• AWS: $ 28.8B, 38% margin 🏋️
• Scale: Ads, subs diversify 🌱
NASDAQ:AMZN ’s a titan, built to last.
(7/9) – SWOT: WEAKNESSES & OPPORTUNITIES
• Weaknesses: Capex weighs 📚
• Opportunities: AI, emerging markets 🌏
Can NASDAQ:AMZN vault past the risks?
(8/9) – AMZN’s $ 187.8B Q4, your view?
1️⃣ Bullish, $ 300+ by ‘26 😎
2️⃣ Neutral, Steady, risks balance 🤷
3️⃣ Bearish, Growth stalls 😕
Vote below! 🗳️👇
(9/9) – FINAL TAKEAWAY
NASDAQ:AMZN ’s $ 187.8B Q4 and $ 637.959B ‘24 stack up, tech titan 🪙 AWS shines, risks loom, gem or pause?

$GRAB yourself some GAINS!NASDAQ:GRAB yourself some GAINS!
The longer the base, the higher the space!
Lots of retail and super investors buying this name.
A train that goes in motion stays in motion...
- Wr% is in motion to the Green Support Beam.
Typically, this name would probably pull back with the direction of the Wr%, BUT... this stock is getting hyped up by a lot of super investors and retail investors right now. I think this week we will see a large move upward as HYPE creates FOMO which takes the stock HIGHER!
Staying patient here...
Not financial advice

WALMART Bullish Leg of Channel Up on full extent.Walmart (WMT) has been trading within a Channel Up since January 2024 and is being supported by the 1D MA50 (blue trend-line) since August 14. The last contact with the 1D MA50 has been on January 16 and is what started the current Bullish Leg.
The standard %rise within this pattern has been +21.86% and as a result our short-term Target is $108.00.
-------------------------------------------------------------------------------
** Please LIKE 👍, FOLLOW ✅, SHARE 🙌 and COMMENT ✍ if you enjoy this idea! Also share your ideas and charts in the comments section below! This is best way to keep it relevant, support us, keep the content here free and allow the idea to reach as many people as possible. **
-------------------------------------------------------------------------------
💸💸💸💸💸💸
👇 👇 👇 👇 👇 👇
WLong

COSTCO New uptrend about to begin.Costco (COST) gave us the most optimal buy signal on our previous analysis (October 07 2024, see chart below) right at the bottom of the Channel Up, and easily hit our 1000 Target:
Yet again, we are ahead of a strong bullish break-out and the only Resistance level that remains is the 1D MA50 (blue trend-line). The 1D RSI has already given a buy signal right on its oversold barrier (30.00) on January 02 2025.
Once the 1D MA50 breaks, we will have a confirmed break-out buy signal. The previous tree Bullish Legs have been of at least +16.08%, so our new Target as of today is 1045.
-------------------------------------------------------------------------------
** Please LIKE 👍, FOLLOW ✅, SHARE 🙌 and COMMENT ✍ if you enjoy this idea! Also share your ideas and charts in the comments section below! This is best way to keep it relevant, support us, keep the content here free and allow the idea to reach as many people as possible. **
-------------------------------------------------------------------------------
💸💸💸💸💸💸
👇 👇 👇 👇 👇 👇

Fraser's Group - negative From the bottom of the pandemic they went from 180 to 995.
In Oct 24 they broke to the downside after forming a triangle pattern from July 22 to Oct 24.
There was no indication that the price would break out to the upside from that pattern.
In technical analysis, the target for Shorters would be 409.
GLA and DYOR. This is not a solicitation to hold or trade.

$HIMS THE NEXT EXPLOSIVE RETAIL STOCK! NYSE:HIMS THE NEXT EXPLOSIVE RETAIL STOCK!
3 Reasons Why in this Video: 📹
1⃣ My "High Five Trade Setup" strategy
2⃣ Massive Cup N Handle Pattern, 88%+ measured move.
3⃣ Review my "HOMEMADE" Valuation Metric for NYSE:HIMS , showing us a fair value of $35!
Video analysis 1/5 dropping today. Stay tuned!🔔
Like ♥️ Follow 🤳 Share 🔂
X Account in Bio
Comment what stock you want to see charting analysis on below.
Not financial advice.
NASDAQ:TSLA NASDAQ:SOFI NYSE:PLTR NASDAQ:NVDA AMEX:IWM NASDAQ:QQQ AMEX:SPY NASDAQ:IBRX NASDAQ:WULF NASDAQ:UPXI #TradingSignals #TradingTips #options #optiontrading #StockMarket #stocks #Retail

SOFI LONG: SYMMETRICAL TRAINGLE BREAKOUT! 80% MOVE INBOUND! NASDAQ:SOFI LONG: SYMMETRICAL TRAINGLE BREAKOUT! 80% MOVE INBOUND!
Everything is FINALLY looking on track for NASDAQ:SOFI stock! See analysis below and my Symmetrical Triangle Breakout trade details at the bottom of the post! Not Financial Advice.
STOCHASTIC UPTREND
MACD UPTREND & BREAKOUT OVER ZERO LINE
RSI UPTREND
STOCK PRICE UPTREND
SYMMETRICAL TRIANGLE BREAKOUT
- MEASURED TRIANGLE: 727 BARS
- BREAKOUT MOVE 727 BARS HIGHER
(86.87%) $15.63
- TAKE PROFITS: TOP OF THE TRIANGLE
(39.78%) $11.70
- STOP-LOSS BELOW MA's AND VOLUME SHELF
2.5 RISK TO REWARD (15.89%) $7.04

COSTCO needs one more Low before it bottoms.Costco (COST) has been trading within a Channel Up pattern since the March 07 High and last week it hit the 1D MA50 (blue trend-line) for the first time since August 09. Even though this is the standard short-term Support level, we expect the price to break it and approach the bottom of the Channel Up where both previous Higher Lows were priced.
Our Target is $1000, just below the 2.0 Fibonacci extension, where the last Higher High was priced.
-------------------------------------------------------------------------------
** Please LIKE 👍, FOLLOW ✅, SHARE 🙌 and COMMENT ✍ if you enjoy this idea! Also share your ideas and charts in the comments section below! This is best way to keep it relevant, support us, keep the content here free and allow the idea to reach as many people as possible. **
-------------------------------------------------------------------------------
💸💸💸💸💸💸
👇 👇 👇 👇 👇 👇
