DXY — Daily RetracementPrice retraced deeply into the prior daily expansion near 98.455, and movement slowed.
Market data behavior observation.
No prediction. No instruction.
— Danel Fadejev
CORE5 Tradecraft
Retracement

Bullish Shark in EG Waters!OANDA:EURGBP is getting ready to finish the formation of a rare Harmonic Pattern, the Bullish Shark!
When it comes the Shark Patterns, certain Fibonacci levels and set of rules must be be met:
Point B must be a 38.2% - 61.8% Retracement of XA
Point C must take out Point A High / Extension around 113.1% - 161.8% of XA
Point D must fall around the 88.6% - 113.1% Fibonacci Levels of XC

XAUUSD TO DROP TO 4300?Gold has been trading above 4k for the past few months before 2026, and still on a strong uptrend as it recently broke through a recent all time high, but currently the metal paired together with the USD is retracing backdown as we watch its movement. Is this a manipulative move or just a reversal downward as it broke an all-time high? From the fractal framework below, we see a recent pull to the upside which left a gap below, so I may guess the instrument is trying to fill its Gap then resume its move to the upside, but then we sit and watch.

UCAD Gets Ready To Serve A "Cup" This Morning!Price on OANDA:USDCAD has made a impressive rally up and based on the parameters, has completed what looks to be the "Bowl" of a popular Reversal Pattern, the Cup and Handle!
Now, since price has pushed above the Confirmation of Pattern @ 1.38056, we should expect price to make a retracement down to no lower than the 50% Fibonacci level @ 1.37289 to create the "Handle" or Higher Low, suggesting Bulls are reversing price.
Long Opportunities will be generated when:
1) Price is supported on the retracement at the 50% level
2) Once Price Breaks and Retests the completion of the pattern altogether
When price completes the pattern, I'll be looking for price to head to the next Resistance level around 1.39575 - 1.39774.

XAUUAD READY FOR PULLBACK (READ CAPTION)Hi traders what do you think about gold
Gold (XAUUSD) is currently forming a sell retest setup, where price is retracing upward into key resistance zones before a potential bearish continuation. This structure supports a sell-on-retest strategy.
🔹 Resistance Zone: 4527–4531
This is the primary sell zone where price is expected to face rejection.
If the market retests this zone and shows bearish price action (rejection wicks or bearish candles), it confirms seller dominance.
🔹 Second Resistance: 4555
This level represents the upper resistance and invalidation zone.
A strong rejection from 4555 would further strengthen the bearish outlook, while a sustained break above it may weaken the sell setup.
🔹 Support: 4496
This is the first downside target where price may pause or form a minor bounce.
A confirmed break below 4496 signals continuation of bearish momentum.
🔹 Demand Zone: 4457
This is the main downside target and demand area.
If price breaks below 4496, Gold is likely to move toward 4457, where buyers may step in for a reaction or short-term consolidation.
📉 Market Outlook (Retest Logic)
Retracement into 4527–4531 → Sell opportunity
Rejection from resistance → Confirms bearish continuation
Break below 4496 → Opens path toward 4457 demand zone
Demand zone reaction will determine next move
The overall structure favors a bearish retest → continuation setup, unless price breaks and holds above 4555
please don't forget to like comment and follow thank you

Potential Top On XAGUSD, Possible Chance At FOMO Remedy!?OANDA:XAGUSD has seen an impressive rally in price all month of December since breaking out of the grip of the Resistance Level @ 54.45 that held it from October until late November, but the rally may be showing signs of exhaustion at new All Time Highs!
Starting this week we see OANDA:XAGUSD put in a new All Time High @ 83.921 and since then has put in a Low @ 74.874, just above the 23.6% Fibonacci Retracement level.
Now, if price fails to continue pushing higher and falls below the current Low at the 23.6% level, this Bullish momentum will have cooled down and we could then see OANDA:XAGUSD put in a deeper Pullback.
The favorable level I see is the 50% Fibonacci Retracement level @ 64.728.
Fundamentally, metals seem to be softening with Trump and Zelensky "closer to a peace deal" with the Ukraine/Russian conflict but with all the global and economic uncertainty, future rate cuts and struggle with the TVC:DXY , we should not count out that this mere decline is anything more then a simple Pullback.
www.tradingview.com

Long Term Silver Bull Going ShortThis post is a follow up to my "Grand Silver Supercycle" chart posted on 2/2/2023. I recommend referencing that chart to understand my commentary here. In that chart, I called for silver to double in price by the end of 2025 and to reach $95 by 2027. Since then, silver has overshot my near term price targets. I'm here to argue that silver has gone up too far too quickly and is due for a sharp pullback to the $50-$55 range.
Why am I calling this the near term top?
Silver has very neatly followed Elliot Wave Theory throughout its history. In 2023, I predicted Wave 3 of the current cycle, which began with the low in the summer of 2022, to have a 1.618 extension of Wave 1. Instead, silver just reached the 2.618 extension, which back in 2023, I thought was too bold of a prediction. While it is possible for a 4.618 extension to 102.5, these extensions are very rare. The bias is towards a pullback here.
There is also a convergence between the Elliot Wave extension, a fib retracement level, and logarithmic trendline. This indicates that any attempts to breakout higher will face strong resistance.
Finally, I need to talk about gold. The monthly RSI has been over 90 for 3 months, closing in on 4 months. Gold has only held an RSI above 90 for 4 consecutive months at one point prior in its charted history. Gold is still silver's big brother and will determine the direction the two move.

Double Top Formed After 88.6% Retracement on AJHere on the Hourly chart, OANDA:AUDJPY has formed a Bearish Reversal Pattern, the Double Top.
Price attempted to make a Higher High but was cut short by the 88.6% Fibonacci level where we now see price dropped back down to the Confirmation or "Neckline" of the Pattern @ 103.836.
Once the Confirmation is broken, this will generate Short Opportunities to take price down to the next Support Level @ 103.344 - 103.198!

AMD — [2D] WEEK 49 TREND REPORT | 12/04/2025AMD — WEEK 49 TREND REPORT | 12/04/2025
Ticker: NASDAQ:AMD
Timeframe: 2D
This is a reactive structural classification of AMD based on the weekly chart as of this timestamp. Price conditions are evaluated as they stand — nothing here is predictive or forward-assumptive.
⸻
1) Current Trend Condition [ Numbers to Watch ]
Current Price @ 217.20$
• Trend Duration : +27 Days (Bearish)
• Trend Reversal Level ( Bullish ): 226.29$
• Trend Reversal Level ( Bearish Confirmation ): 210.93$
• Pullback Support : 226.29$
• Correction Support : 194.27$
• Structural Support : 149.29$
⸻
2) Structure Health
• Retracement Phase:
Correction (approaching 61.8%)
• Position Status:
Caution (interacting with structural layers)
⸻
3) Temperature :
Neutral Phase
⸻
4) Momentum :
Coiling
⸻
Methodology Overview
This classification framework evaluates directional conditions using internal trend-interpretation logic that references price behavior relative to its structural layers. These relationships are used to identify when price movement aligns with the framework’s criteria for directional phases, transition points, or regime shifts. Visual elements or structural labels reflect these internal interpretations, rather than explicit trading signals or preset indicator crossovers. This framework is observational only and does not imply future outcomes.

AMD — WEEK 49 TREND REPORT | 12/03/2025AMD — WEEK 49 TREND REPORT | 12/03/2025
Ticker: NASDAQ:AMD
Timeframe: WEEKLY
This is a reactive structural classification of AMD based on the weekly chart as of this timestamp. Price conditions are evaluated as they stand — nothing here is predictive or forward-assumptive.
⸻
1) Current Trend Condition [ Numbers to Watch ]
• Current Price @ 216$
• Trend Duration: +0 weeks (Bearish)
• Trend Reversal Level (Bullish): 230.68$
• Trend Reversal Level (Bearish Confirmation): 191.07$
• Pullback Support : 217.79$
• Correction Support : 179.09$
⸻
2) Structure Health
• Retracement Phase:
Correction (approaching 61.8%)
• Position Status:
Healthy (price above both structural layers)
⸻
3) Temperature :
Cooling Phase
⸻
4) Momentum :
Neutral
⸻
5) Market Sentiment
Bullish
⸻
Author’s Note
This analysis is fully reactive, not predictive. Market conditions, trend structure, and behavior are classified as they appear in real time. The objective is to identify where directional shifts first occurred, where structural integrity remains intact, and where it would begin to weaken if key levels were breached.
Predictive analysis projects outcomes that do not exist yet. Without price confirmation, prediction is built on baseless assumptions. This framework avoids that entirely by responding only to verified structural changes and live conditions.
The levels shown simply identify where the current trend structure first shifted and where it would begin to lose integrity if breached. Recognizing these boundaries allows for clearer interpretation of market behavior without relying on forward guarantees, speculative projections, or unsupported assumptions.
⸻
Methodology Overview
This classification framework evaluates directional conditions using internal trend-interpretation logic that references price behavior relative to its structural layers. These relationships are used to identify when price movement aligns with the framework’s criteria for directional phases, transition points, or regime shifts. Visual elements or structural labels reflect these internal interpretations, rather than explicit trading signals or preset indicator crossovers. This framework is observational only and does not imply future outcomes.

META — WEEK 49 TREND REPORTNASDAQ:META — WEEK 49 TREND REPORT
Ticker: NASDAQ:META — 12/02/2025 @ 647.10$
Timeframe: WEEKLY
This is a reactive structural classification of NASDAQ:META based on the weekly chart as of this timestamp. Price conditions are evaluated as they stand — nothing here is predictive or forward-assumptive.
⸻
1) Current Trend Condition
• Trend Duration: +9 weeks (Bearish)
• Trend Reversal Level (Bullish): 670.20$
• Trend Reversal Level (Bullish Confirmation): 688.75$
• Pullback Support: 645.90$
• Correction Support: 525.73$
⸻
2) Structure Health
• Retracement Phase:
Correction (approaching 61.8%)
• Position Status:
Unstable (price below both structural layers)
⸻
3) Temperature :
Cooling Phase
⸻
4) Momentum :
Bearish
⸻
5) Market Sentiment
Bearish
⸻
Author’s Note
This analysis is fully reactive, not predictive. Market conditions, trend structure, and behavior are classified as they appear in real time. The objective is to identify where directional shifts first occurred, where structural integrity remains intact, and where it would begin to weaken if key levels were breached.
Predictive analysis projects outcomes that do not exist yet. Without price confirmation, prediction is built on baseless assumptions. This framework avoids that entirely by responding only to verified structural changes and live conditions.
The levels shown simply identify where the current trend structure first shifted and where it would begin to lose integrity if breached. Recognizing these boundaries allows for clearer interpretation of market behavior without relying on forward guarantees, speculative projections, or unsupported assumptions.
⸻
Methodology Overview
This classification framework evaluates directional conditions using internal trend-interpretation logic that references price behavior relative to its structural layers. These relationships are used to identify when price movement aligns with the framework’s criteria for directional phases, transition points, or regime shifts. Visual elements or structural labels reflect these internal interpretations, rather than explicit trading signals or preset indicator crossovers. This framework is observational only and does not imply future outcomes.

AAPL — WEEK 49 TREND REPORTNASDAQ:AAPL — WEEK 49 TREND REPORT
Ticker: NASDAQ:AAPL — 12/02/2025 @ 286.19$
Timeframe: WEEKLY
This is a reactive structural classification of NASDAQ:AAPL based on the weekly chart as of this timestamp. Price conditions are evaluated as they stand — nothing here is predictive or forward-assumptive.
⸻
1) Current Trend Condition
• Trend Duration: +22 weeks (Bullish)
• Trend Reversal Level (Bearish): 265.7$
• Trend Reversal Level (Bearish Confirmation): 241.24$
• Pullback Support: 237.27$
⸻
2) Structure Health
• Retracement Phase:
Uptrend (operating above 78.6%)
• Position Status:
Healthy (price above both structural layers)
⸻
3) Temperature
Warming Phase
⸻
4) Momentum
Bullish
⸻
5) Market Sentiment
Bullish
⸻
Author’s Note
This analysis is fully reactive, not predictive. Market conditions, trend structure, and behavior are classified as they appear in real time. The objective is to identify where directional shifts first occurred, where structural integrity remains intact, and where it would begin to weaken if key levels were breached.
Predictive analysis projects outcomes that do not exist yet. Without price confirmation, prediction is built on baseless assumptions. This framework avoids that entirely by responding only to verified structural changes and live conditions.
The levels shown simply identify where the current trend structure first shifted and where it would begin to lose integrity if breached. Recognizing these boundaries allows for clearer interpretation of market behavior without relying on forward guarantees, speculative projections, or unsupported assumptions.
⸻
Methodology Overview
This classification framework evaluates directional conditions using internal trend-interpretation logic that references price behavior relative to its structural layers. These relationships are used to identify when price movement aligns with the framework’s criteria for directional phases, transition points, or regime shifts. Visual elements or structural labels reflect these internal interpretations, rather than explicit trading signals or preset indicator crossovers. This framework is observational only and does not imply future outcomes.

SOL — WEEK 49 TREND REPORTSOLUSD — WEEK 49 TREND REPORT
Ticker: COINBASE:SOLUSD — 12/02/2025 @ 139.43$
Timeframe: WEEKLY
This is a reactive structural classification of SOL based on the weekly chart as of this timestamp. Price conditions are evaluated as they stand — nothing here is predictive or forward-assumptive.
⸻
1) Current Trend Condition
• Trend Duration: +8 weeks (Bearish)
• Trend Reversal Level (Bullish): 179.71$
• Trend Reversal Level (Bullish Confirmation): 187.51$
⸻
3) Temperature :
Cooling Phase
⸻
4) Momentum :
Bearish
⸻
Author’s Note
This analysis is fully reactive, not predictive. Market conditions, trend structure, and behavior are classified as they appear in real time. The objective is to identify where directional shifts first occurred, where structural integrity remains intact, and where it would begin to weaken if key levels were breached.
Predictive analysis projects outcomes that do not exist yet. Without price confirmation, prediction is built on baseless assumptions. This framework avoids that entirely by responding only to verified structural changes and live conditions.
The levels shown simply identify where the current trend structure first shifted and where it would begin to lose integrity if breached. Recognizing these boundaries allows for clearer interpretation of market behavior without relying on forward guarantees, speculative projections, or unsupported assumptions.
⸻
Methodology Overview
This classification framework evaluates directional conditions using internal trend-interpretation logic that references price behavior relative to its structural layers. These relationships are used to identify when price movement aligns with the framework’s criteria for directional phases, transition points, or regime shifts. Visual elements or structural labels reflect these internal interpretations, rather than explicit trading signals or preset indicator crossovers. This framework is observational only and does not imply future outcomes.

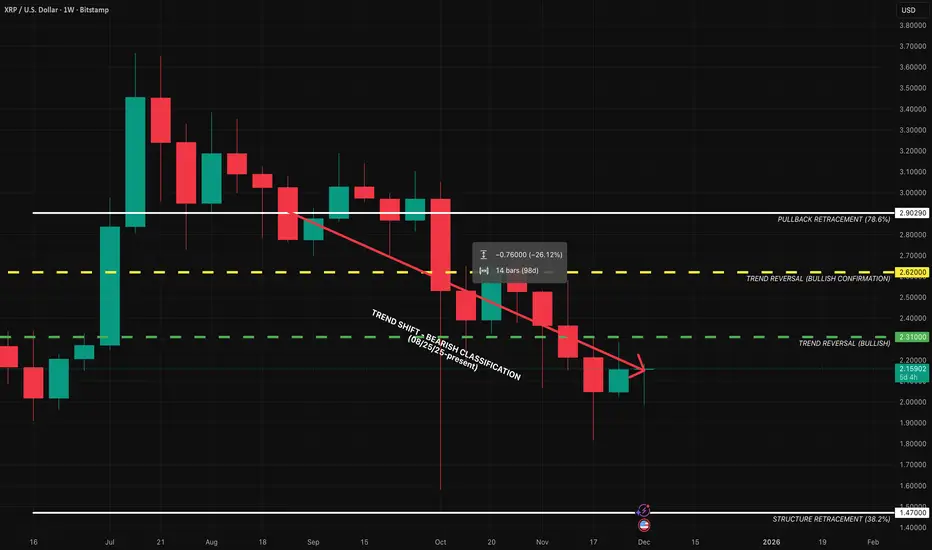
XRP — WEEK 49 TREND REPORTCRYPTOCAP:XRP — WEEK 49 TREND REPORT
Ticker: BITSTAMP:XRPUSD — 12/02/2025 @ 2.15$
Timeframe: WEEKLY
This is a reactive structural classification of XRP based on the weekly chart as of this timestamp. Price conditions are evaluated as they stand — nothing here is predictive or forward-assumptive.
⸻
1) Current Trend Condition
• Trend Duration: +14 weeks (Bearish)
• Trend Reversal Level (Bullish): 2.31$
• Trend Reversal Level (Bullish Confirmation): 2.62$
• Pullback Support: 2.90$
• Structural Support: 1.47$
⸻
2) Structure Health
• Retracement Phase:
Testing Structure (approaching 38.2%)
• Position Status:
Unstable (price below both structural layers)
⸻
3) Temperature
Cooling Phase
⸻
4) Momentum
Bearish
⸻
Author’s Note
This analysis is fully reactive, not predictive. Market conditions, trend structure, and behavior are classified as they appear in real time. The objective is to identify where directional shifts first occurred, where structural integrity remains intact, and where it would begin to weaken if key levels were breached.
Predictive analysis projects outcomes that do not exist yet. Without price confirmation, prediction is built on baseless assumptions. This framework avoids that entirely by responding only to verified structural changes and live conditions.
The levels shown simply identify where the current trend structure first shifted and where it would begin to lose integrity if breached. Recognizing these boundaries allows for clearer interpretation of market behavior without relying on forward guarantees, speculative projections, or unsupported assumptions.
⸻
Methodology Overview
This classification framework evaluates directional conditions using internal trend-interpretation logic that references price behavior relative to its structural layers. These relationships are used to identify when price movement aligns with the framework’s criteria for directional phases, transition points, or regime shifts. Visual elements or structural labels reflect these internal interpretations, rather than explicit trading signals or preset indicator crossovers. This framework is observational only and does not imply future outcomes.
$BTC — WEEK 49 TREND REPORTBTC — WEEK 49 TREND REPORT
Ticker: BITSTAMP:BTCUSD — 12/02/2025 @ 90,800
Timeframe: WEEKLY
This is a reactive structural classification of BTCUSD based on the weekly chart as of this timestamp. Price conditions are evaluated as they stand — nothing here is predictive or forward-assumptive.
⸻
1) Current Trend Condition
• Trend Duration: +9 weeks (bearish)
• Trend Reversal Level (Bullish): 103404.5$
• Trend Reversal Level (Bullish)( Confirmation ): 103405$
• Pullback Support: 100,074$
• Correction Support: 79,507$
⸻
2) Structure Health
• Retracement Phase:
Correction (approaching 61.8%)
• Position Status:
Unstable (price below both structural layers)
⸻
3) Temperature:
• Cooling Phase
⸻
4) Momentum :
• Bearish
⸻
Author’s Note
This analysis is fully reactive, not predictive. Market conditions, trend structure, and behavior are classified as they appear in real time. The objective is to identify where directional shifts first occurred, where structural integrity remains intact, and where it would begin to weaken if key levels were breached.
Predictive analysis projects outcomes that do not exist yet. Without price confirmation, prediction is built on baseless assumptions. This framework avoids that entirely by responding only to verified structural changes and live conditions.
The levels shown simply identify where the current trend structure first shifted and where it would begin to lose integrity if breached. Recognizing these boundaries allows for clearer interpretation of market behavior without relying on forward guarantees, speculative projections, or unsupported assumptions.
⸻
Methodology Overview
This classification framework evaluates directional conditions using internal trend-interpretation logic that references price behavior relative to its structural layers. These relationships are used to identify when price movement aligns with the framework’s criteria for directional phases, transition points, or regime shifts. Visual elements or structural labels reflect these internal interpretations, rather than explicit trading signals or preset indicator crossovers. This framework is observational only and does not imply future outcomes.

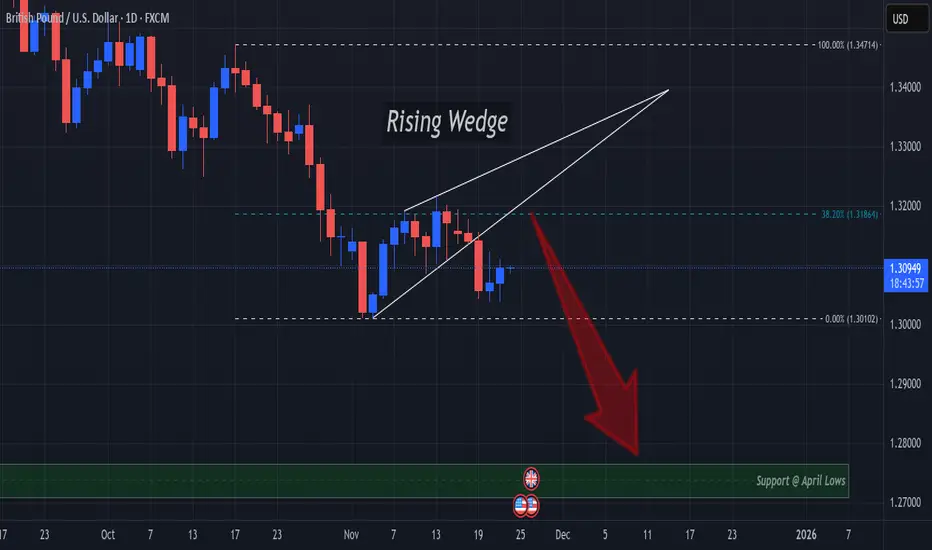
Rising Wedge Breakout Spells Decline Continuation For GUFX:GBPUSD delivered a Breakout of A Rising Wedge to end the week last week!
Next, we should suspect a Retest of this Breakout @ the 38.2% Retracement level around 1.31864.
This level proved to hold price below it through the formation of the pattern and would serve as a great area of opportunity to short the pair and ride Price down!
If the Retest of the Breakout is successful, Price would next find Support at the April Lows around the 1.28 - 1.27 area!
Fundamentally its a heavy week for USD with events for GBP littered throughout so keep a close eye on how the results end up affecting the markets!
BTC/USDT (MACRO OUTLOOK) Price speculation Bitcoin is in a macro bull trend but currently experiencing a necessary and healthy retracement toward key support levels.
As long as BTC holds above $64,800 on the monthly timeframe, the bullish structure remains intact.
A strong bounce from this zone could reopen a move back toward $97,000 and later $120,000+.
If $64,800 breaks on a monthly close, expect a deeper correction to $48,000–$40,000 before the next leg of the bull cycle.
📌 Macro Bias: Bullish, with short-term correction.
📌 Strategy: Wait for monthly confirmation around $64,800 support.

EURJPY Forms Rare Reversal, Aiming For Price Gap??OANDA:EURJPY has formed a rare Reversal Pattern, the Three Drives Pattern, lets break it down!
The Three Drives Pattern consists of 3 Bullish attempts to continue pushing price higher. The 3rd attempt is a Fibonacci Extension of the DE Leg giving us Point F where Price, encountering Resistance at the 138.2% Extension @ 180.008, should reverse and head lower!
We can see starting the week that OANDA:EURJPY is opening below this level and if Price is unable to move higher, we can expect it to fall from here!
When it does, there is a big Price Gap in the 174.712 - 173.249 Range to fill with the Low or Point A being the next line of support @ 172.260 being the Price Target!
This could generate a great Short Opportunity!

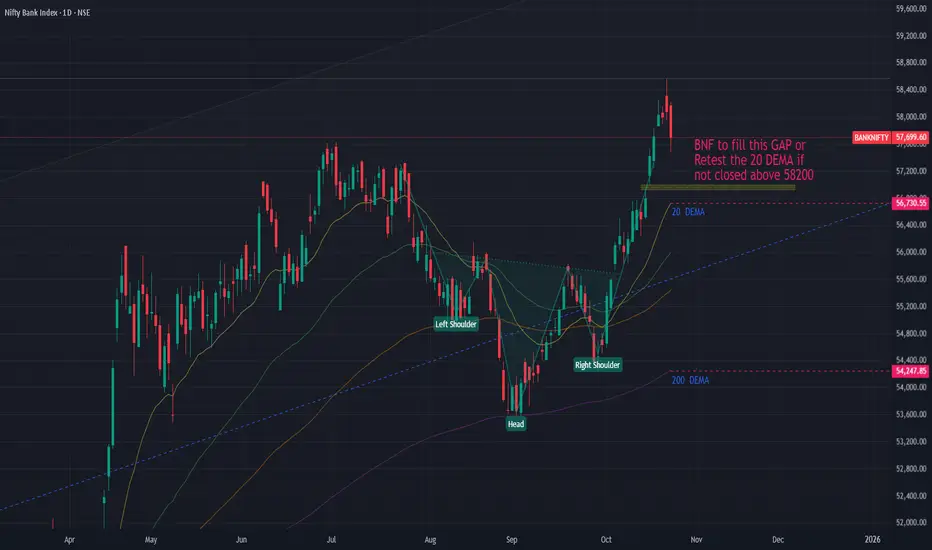
BNF to fill the GAP or retest 20 DEMA if not sustained higher!This scenario involves a temporary pullback, which is normal after a sharp rally.
Scenario A: Filling the Gap: The price drops to fill the recent price gap created during the ascent.
Support Target: The Lower edge of the gap area. Once filled, the market may resume its upward trajectory.
Scenario B: Retest the 20 DEMA: The selling pressure is strong enough to push the price down to retest the 20 DEMA (56,730.55).
Key Level: If the 20 DEMA holds, it would be a healthy correction and a high-probability buying opportunity to resume the rally.
Risk: A decisive break below the 20 DEMA would signal a deeper correction, potentially towards the neckline of the Inverse H&S or the next significant support, which could be the 200 DEMA (54,287.85)—though this seems less likely in the immediate term without a strong catalyst.
The scenarios are probable if the levels are not sustained higher and any close above 58200 would negate this view.
EURJPY – Dealing Range + BB + FVG Confluence SetupPrice has clearly defined a Dealing Range between the 4H highs (DRH) and lows (DRL).
After sweeping the Buy-Side Liquidity (BSL) we observed a Market Structure Shift (MSS) to the downside — signaling a potential bearish dealing range rotation.
Now, price is retracing into a confluence zone between the Breaker Block and Fair Value Gap (FVG) around 177.20–177.50, aligning perfectly with the equilibrium of this dealing range.
Expecting continuation lower toward Sell-Side Liquidity (SSL) around 174.80.
📊 Flow Summary:
Buy-side liquidity taken (BSL ✅)
Market structure shifted bearish (MSS ⚡️)
Retracement into premium zone (Breaker + FVG confluence 🎯)
Targeting sell-side liquidity below DRL (174.80 📉)
🔁 ICT Logic:
Liquidity → Shift → Retrace → Deliver

Pour Yourself A "Cup" of Cola, Grab A Share of KONYSE:KO has made a 61.8% Fibonacci Retracement of the Low @ $60.62 to the High @ $74.38 and begun to form what looks to be a Cup and Handle Pattern!!
On Wednesday, Price on NYSE:KO managed to Confirm the Pattern by reaching the Equal High of $71.61, completing the "Cup".
Now based on the Cup and Handle Pattern, we want to see Price make a Retracement to form the "Handle" of the Pattern and currently Price on NYSE:KO is falling. We can expect Price will Close the Gap from Last Week and find Support at the 50% Fibonacci Level @ $68.48.
Once the Retracement is successful, we should see Price move up to Complete the "Handle" and Pattern altogether!
Fundamentally, NYSE:KO CFO, John Murphy, plans to make changes to products with affordability in todays economy in mind for both High and Low income earners.
www.tradingview.com
NYSE:KO also posted greater than forecasted Earnings for Q3 this year!
www.tradingview.com
If Technicals and Fundamentals can align, NYSE:KO may be a great company to get stock in soon!

IQV - BUY ON DIPS IQV - CURRENT PRICE : 184.08
From May to July, IQVIA (IQV) staged a strong upward rally, supported by rising volume. Following this advance, the stock underwent a healthy retracement, consolidating recent gains without breaking its long-term uptrend. Take note that the up trendline is still intact.
Currently, price action shows signs of support around the Fibonacci 38.2% retracement level , coinciding with both the Ichimoku Cloud and the 50-day EMA . This confluence suggests the retracement phase may be complete, presenting a good opportunity to apply a Buy on Dips strategy as the stock prepares for its next upward leg.
ENTRY PRICE : 183.50 - 184.50
TARGET : 205.00 and 215.00
SUPPORT : 166.00

USDJPY IDEA FOR 28, OCT 2025.The US Dollar against the Japanese Yen is still overall bullish but short-term bearish, which is currently trying to form an M pattern on the Daily timeframe and 4Hour respectively and also the market may be coming back down to clear a previous Gap of inactivity it had left behind during the previous trading weeks which will be propelled by new information and volume through News which is expected to be coming into the markets shortly at the beginning of the new trading month.
