XRP - From Support to Momentum Shift!Let’s break this one down step by step.
On the left chart, (Weekly chart) XRP just rejected a very strong weekly support zone around $1.75 – $1.90. This level has been rejected multiple times in the past, and once again, buyers stepped in!
Now shifting to the right chart , (Daily chart) this is where things get interesting.
After months of downside pressure, momentum officially flipped from bearish to bullish. XRP managed to:
• Break above the falling red channel
• Take out the last major daily high marked in blue
That’s a classic sign of a momentum shift, not just a random bounce.
At the moment, price is correcting, which is healthy after such a move.
As long as this correction remains controlled, my focus is simple:
I’ll be looking for longs, targeting the supply zone marked in green above.
If structure continues to hold, dips are no longer something to fear... they’re something to watch closely.
Is this the start of a larger XRP rotation… or just the first step? 🤔
⚠️ Disclaimer: This is not financial advice. Always do your own research and manage risk properly.
📚 Stick to your trading plan regarding entries, risk, and management.
Good luck! 🍀
All Strategies Are Good; If Managed Properly!
~Richard Nasr
Reversal

AUDCAD - From Shorts to Potential Longs!!Earlier in this range, we sold 📉AUDCAD near the upper boundary, fading resistance as price showed clear exhaustion. That idea played out well, with price rotating back into the middle and now pressing toward the lower bound of the range.
This is where things shift.
⚔️As long as range support holds, the bias flips from selling rallies to looking for longs from support. In a well-defined range, edges matter more than direction, and the lower boundary is where buyers historically step in.
The plan from here is simple and disciplined.
No chasing. No guessing....
🏹If price holds above support and shows bullish reaction on lower timeframes, longs become valid back toward the range highs. A clean breakdown below support would invalidate this idea and put sellers back in control.
Range trading is not about prediction, it’s about location and reaction.
Will buyers defend the floor once again, or is this range finally ready to break? 🤔
⚠️ Disclaimer: This is not financial advice. Always do your own research and manage risk properly.
📚 Stick to your trading plan regarding entries, risk, and management.
Good luck! 🍀
All Strategies Are Good; If Managed Properly!
~Richard Nasr

Bitcoin - Compression Before Expansion?⚔️Bitcoin has been absorbing pressure above a rising base , with price holding firmly above the ascending blue trendline. Despite the prior selloff, bears are no longer able to push price lower, signaling structural strength building beneath the surface.
Price is now pressing against a key resistance band. This zone is acting as the final barrier between consolidation and continuation. A clean break and hold above this area would shift control decisively back to the bulls and open the door for a move toward the 100K psychological level and beyond.📈
🏹Until then, the bias remains cautiously bullish , with buyers clearly defending dips and preparing for a potential expansion phase.
Is this the calm before Bitcoin’s next leg higher?🤔
⚠️ Disclaimer: This is not financial advice. Always do your own research and manage risk properly.
📚 Stick to your trading plan regarding entries, risk, and management.
Good luck! 🍀
All Strategies Are Good; If Managed Properly!
~Richard Nasr

Challenges of Fading and OverextensionIntroduction
Fading is a strategy where a position is taken against the prevailing move, based on the expectation that it is overextended and likely to reverse. While mean reversion is a valid market phenomenon, some methods are built on incomplete beliefs about how markets operate.
From Normal to Deviation
Markets can be evaluated relative to their recent or average behavior. Price movement within these bounds is considered normal, while a notable move beyond them is referred to as a deviation. This is interpreted as an overextension, where indicators tend to show overbought or oversold values.
However, overextension does not necessarily imply that exhaustion is present. It simply marks a departure from normal behavior. Whether this leads to reversal or continued movement depends on broader market context.
Markets also tend to exhibit volatility clustering; periods of high volatility are followed by further volatility, and calm periods tend to persist. In other words, a strong move often leads to another. This challenges a common bias that an extended move must suspend or reverse.
The Limitations of Indicators
Indicators can show when price has moved outside a reference point. For example, oscillators, boundaries, or momentum values may signal overbought or oversold conditions. However, these readings are not signals on their own. The broader context matters more and determines whether the move is likely to reverse or continue.
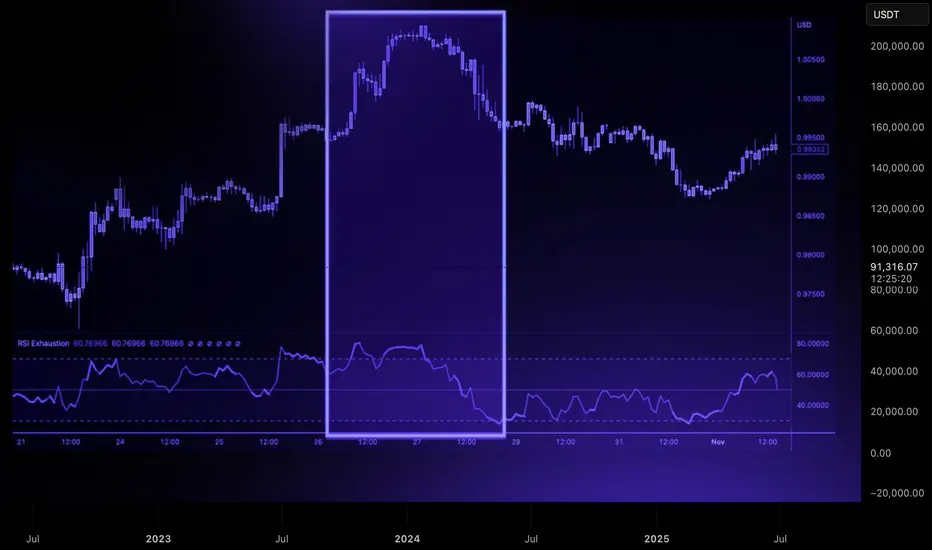
In this chart, price moves outside the upper envelope on two separate occasions, each showing a deviation from recent average behavior. In the first case, the move results in a successful reversion. In the second, price remains extended above the band for several weeks, maintaining persistent momentum. Both instances show similar values, but the outcomes were different. This illustrates that tools should not be interpreted in isolation.
In this chart, RSI reaches overbought levels on two separate occasions. In the first case, the overextension is followed with a mean reversion. In the second, the same condition marks the beginning of a strong upward momentum move. Both events show similar indicator values, but the results were different. This reinforces that identical values can lead to different outcomes depending on the context and underlying structure.
Low Volatile Trends
Low volatility trends present recurring challenges and are worth consideration. These environments are characterized by price moving along structural boundaries with minimal retracement or mean reversion. The absence of counter-movement makes them difficult to fade, as directional drift may persist longer than expected. Attempts to fade these trends or build positions over time can introduce notable risk and limited potential, as reversion remains uncertain. A better approach is to wait for a sharp reversal or the formation of a new structure before considering any setup.
The Risk in Fading Systems
Fading can produce high win rates in range-bound or indecisive markets. Positions tend to be averaged down as price extends further, based on the expectation of a return to the mean. This approach can be effective over a series of trades, but its success depends on eventual reversion.
The risk emerges in less frequent but severe scenarios where momentum persists and price continues to expand beyond expectations. These low-probability but high-impact outcomes tend to be overlooked, but when they occur the consequences can be severe without proper risk control.
This simulation models a high win-rate fading strategy using an initial account size of $100,000. Each trade targets a gain of 0.5% of the account, or $500 based on the starting balance, and the win rate is set at 91.20%. These values are intended to simulate frequent small wins with the assumption that losses will be infrequent.
Losses in this case are set to 5% of the account size, or $5,000, to represent situations where a trader continues to average into a losing position until a maximum loss threshold is reached. In real conditions, some traders may exceed this amount, either deliberately through increased exposure or due to loss of control.
Across 50 simulation runs of 1,000 trades each, the average final balance was $118,109. The best case ended at $240,858, while the worst case dropped to $47,090. The average maximum drawdown was over 43%, and the worst drawdown reached nearly 70%. Half of all simulations finished below the starting balance. These results illustrate that while most trades may perform as expected, rare but oversized losses can and do occur. Despite a strong win rate, the long-term outcome becomes increasingly dependent on avoiding a handful of catastrophic trades.
Strategies like this often appear stable because of their high success rate, which can create a false sense of security. This perceived consistency can lead to increased confidence, relaxed risk limits, or more aggressive sizing. However, the simulation makes clear that even a few failed trades are enough to reverse months of profits or endanger the entire account. Without strict risk control and structural awareness, the strategy becomes vulnerable to failure with little warning and limited opportunity to recover.
Fading as a Valid Approach
Fading strategies are not inherently wrong. In fact, a lot of profitable and well-developed systems are built on the concept of fading strength or weakness. The concepts explored, such as excursion from the mean, structural failure, or climactic behavior, can all serve as valid references.
The problem arises when a move is assumed to have extended too far and must reverse, without clear reference and in opposition to strong momentum. This, combined with poor risk management, can have notable consequences. Therefore, it is essential to have a proper understanding of market structure and disciplined risk control.
Trend Context and Deviation
For traders who prefer to align with the prevailing trend, an overextension can be evaluated as a potential momentum move. In such cases, one approach is to wait for price to pause or pullback, then enter on continuation. This process can be repeated as long as the trend remains intact. A full reversal should not be considered until there is evidence of structural failure, such as a trend break followed by momentum developing in the opposite direction.
Indicators that show overbought or oversold can be helpful in these events. Their purpose would not be to predict reversion, but to serve as a filter that helps avoid continuation entries when price is extended. This can reduce the risk of entries near potential exhaustion, which is a reasonable practice.
This example shows a case where entries are withheld while price is above the upper envelope, which helps to not chase the move. This illustrates how overbought conditions can serve as a simple filter. Note, towards the end price continued even further, which is to be expected at times. Therefore the purpose is not to predict the reversion but to avoid entries at overextended levels without a pause or pullback.

IREDA NEW YEAR PICKHello everyone and Happy New year.
Ireda after a long consolidation and correction it has broken its previous lower high and marking a trend change. This can be a good reversal trade. One can look to accumulate Ireda at 142-144 levels.
SL - 136
Target- 155, 163 and long-term investors can hold for all time highs.
Disclaimer- This is just for educational purpose.
Jai Shree Ram.

EURCHF Looking To "Head" Down To Next Support??OANDA:EURCHF has made a successful formation and breakout of a Head and Shoulders, a strong Bearish Reversal Pattern!
Now all we need is a Successful Retest of the Breakout of the "Neckline" or Support Level that helped form the pattern.
Currently, price is trading @ .9312
Looking for a Retest around .9320 - .9325
If the Retest is successful and price is rejected down, this will generate a great Short Opportunity to take price down to the next Support level from the Low @ .9230 - .9180!

BTC - Where the 2026 Bottom Might Actually FormLet me be clear from the start.
This is not about calling a bottom today.
It’s about comparing this cycle to the previous ones.
📉 From a structural point of view:
Price is trading below the key moving average, and as long as that MA is not reclaimed to the upside, the trend remains bearish.
At the same time, momentum confirms this view.
The MACD has flipped bearish, which historically marks the transition from expansion into a corrective cycle.
In previous BTC cycles, the real bottom never formed until both conditions were met:
- MACD flips back bullish
- Price reclaims the moving average
Until that happens, we stay in a bearish or corrective regime, even if price bounces short term.
🧠 Now zooming out.
When you compare this structure to prior cycles, Bitcoin tends to:
• Correct deeply
• Find support at prior major resistance
• Reset momentum near long term demand
• Then flip trend again
On this chart, that area is very clear.
The green zone around 55k to 65k aligns with:
• Previous cycle highs
• Strong historical demand
• The lower boundary of the long-term rising structure
If history rhymes again, this is where we would expect:
• Momentum to stabilize
• MACD to start curling bullish
• Price to eventually reclaim the moving average
⏳ Timing wise , based on previous cycles, this process usually takes time.
That points toward late 2026, roughly October and beyond, not before.
⚠️ Disclaimer: This is not financial advice. Always do your own research and manage risk properly.
📚 Stick to your trading plan regarding entries, risk, and management.
Good luck! 🍀
All Strategies Are Good; If Managed Properly!
~Richard Nasr

Bullish Divergence Weekly TTD Trade #00020Bullsh div, V1 trigger, sR coming from oversold, both EFI's coming from < -3 ATR extremes
Montly flipping from red impulse to blue, but factor 3 is already blue.
TP 1: 44,49
TP 2: 49,86
E: 38,4
35,41
R/R: 1:2,2
I plan to enter around 38,4 with 80%, possibly more entries when it goes below
70% exit on TP1, 30% exit on TP2
Trade #00020

GBPCAD - Trend Intact, Buyers Watching This Zone!!📈GBPCAD remains overall bullish on the higher timeframe, with price respecting a well-defined rising channel.
📹The key focus right now is the confluence zone where horizontal support aligns with the lower blue trendline. This intersection has already proven its importance in the past, and as long as it continues to hold, the bullish structure remains valid.
🏹From a trend-following perspective, this is the type of location where I’ll be looking for longs, not chasing price higher. The plan is simple: patience at support, confirmation on lower timeframes, and alignment with the broader uptrend.
Only a clean breakdown below this support–trendline intersection would weaken the bullish bias and force a reassessment. Until then, dips into this zone favor buyers.
Will this support fuel the next leg higher, or do sellers finally break the structure? 🤔📊
⚠️ Disclaimer: This is not financial advice. Always do your own research and manage risk properly.
📚 Stick to your trading plan regarding entries, risk, and management.
Good luck! 🍀
All Strategies Are Good; If Managed Properly!
~Richard Nasr

How to Trade Reversals Like a Pro | CADJPY Wave 5 Entry hey Traders,
This is a live example of reversal trading using completed bullish wave structure. Entry executed, currently +10 pips, targeting 113.36 38:1 risk: reward.
🌊 Wave Structure Analysis:
Pattern Identified: Completed Bullish Wave Structure
What This Gives Us:
When a wave structure completes, it provides absolute clarity. We know exactly what our options are—no guessing, no confusion.
Our Two Options:
Sell the reversal (what we did)
Do nothing (if conditions aren't perfect)
That's it. No ambiguity. No emotional decision-making.
💡 The Power of WavesOfSuccess:
This is what proper wave counting provides:
✅ Objectivity - Remove emotion, follow structure
✅ Clarity - Know exactly what to do (or not do)
✅ Flawless Execution - Enter at precise levels
Important Reality Check:
Having clarity doesn't mean we never lose. Losing is an essential part of trading. We teach traders to accept losses quickly and immediately move to the next opportunity. The edge plays out over time, not on every single trade.
📊 Trade Execution Breakdown:
Focus Area: Last leg of bullish wave structure
Entry Method:
Counted the internal bar structures within the major Wave 5 swing. Precise entry at the 2nd Higher High (HH) bar of the internal wave count.
Entry: 114.42
Stop Loss: 114.46 (4Pips)
Why This Level:
The 2nd HH bar of Wave 5's internal structure represents peak momentum—the final push before exhaustion. This is where reversals should begin.
⚠️ Advanced Execution Warning:
This is NOT for novice traders.
Requirements for this type of execution:
Flawless wave counting ability
No guessing on wave positions
Internal bar structure recognition
Precise entry timing
When you master this:
Trading becomes effortless. You're not predicting—you're reading structure and executing mechanically. All you need to control is risk through proper stop placement.
✅ Trade Outcome (So Far):
Status: Success - Risk-free position
What Happened:
Price broke below the internal Wave 4 structural bar within the Wave 5 swing. This created immediate downside momentum and allowed us to move the stop to break-even (risk-free).
Current Profit: +10 pips (and counting)
Current Risk: 0 pips (break-even stop)
👍 Boost if you want more reversal trade breakdowns
👤 Follow for advanced wave structure execution
💬 Can you count internal waves? Comment below

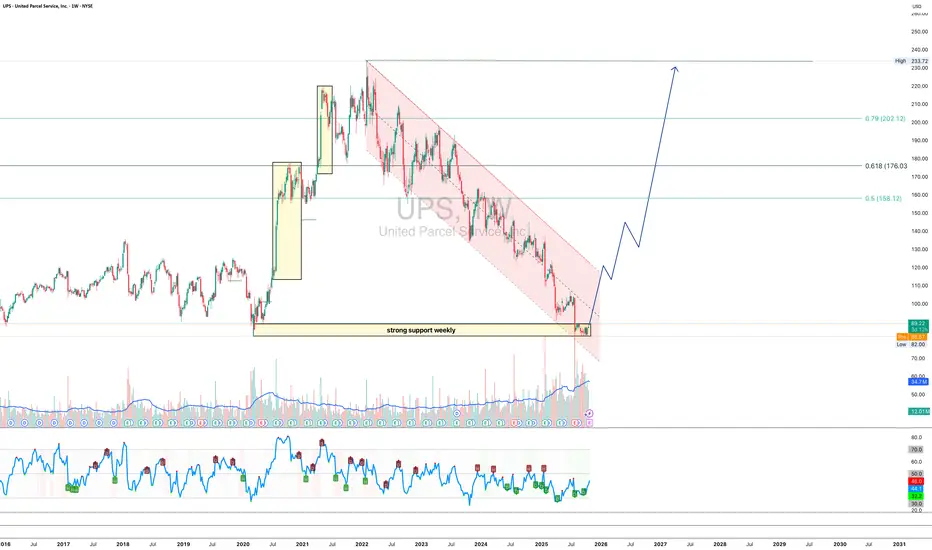
UPS 1W - delivery of a trend reversal is on the way?On the weekly chart, UPS is holding strong around the $82–90 support zone - a key level where buyers historically step in. The structure suggests the end of the long corrective channel and the potential start of a bullish reversal.
Technically, a confirmed breakout above the channel could trigger momentum toward $158, $176, and $202 - attractive targets for mid-term traders.
From a fundamental standpoint, UPS continues to streamline operations, improve automation, and prepare for peak season shipping. Growing e-commerce volumes and steady fuel costs may support stronger margins ahead. If earnings start to reflect these improvements, the stock could easily shift gears into a sustainable uptrend.
* UPS announced that it will report its Q3 results on October 28, 2025.
* The company is introducing increased seasonal charges and shipping rates starting October 26 ahead of the holiday season, which may temporarily reduce demand.
* UPS also announced plans to equip 5,000 of its trucks with air conditioning in the hottest regions of the US, a step to improve working conditions but at a cost.
* The high dividend yield (~7.5%) raises questions about sustainability, as the payout is almost equal to free cash flow.
Tactical play: as long as $82–90 holds, bulls have the initiative. Once the breakout is confirmed - the next big delivery might just be profits.
USDCHF - Same Structure, Different Plays!!🏹USDCHF has been respecting its rising wedge structure beautifully.
📈We initially bought near the lower bound of the wedge, where buyers stepped in with clear support. 📉Later on, we sold near the upper bound, capitalizing on exhaustion at resistance. Classic structure-based trading.
⚔️Now price is rotating back toward the lower bound of the rising wedge, which aligns perfectly with a well-defined support zone. This intersection is where we’ll be looking for fresh trend-following long setups, as long as price shows acceptance and bullish reaction from this area.
🏹As long as the lower wedge support holds, the bias remains for another rotation higher within the structure. A clean break below would invalidate this bullish scenario and shift the narrative.
Same chart. Same structure. Different opportunities. 🤔
Are buyers ready to defend it again?
⚠️ Disclaimer: This is not financial advice. Always do your own research and manage risk properly.
📚 Stick to your trading plan regarding entries, risk, and management.
Good luck! 🍀
All Strategies Are Good; If Managed Properly!
~Richard Nasr

Why the Reaction Matters More Than the Level!!!Most traders spend their time hunting for the perfect level.✖️
Support. Resistance. Demand. Supply.
They draw the zone… and assume price must react.
But professionals know something crucial:
The level itself is not the edge.
The reaction is.
Here’s why.
1️⃣ Levels Are Common Knowledge
Everyone sees the same support.
Everyone sees the same resistance.
If levels alone were enough, everyone would be profitable.
A level is just a location.📍
It doesn’t tell you who is in control.
2️⃣The Reaction Reveals Intent
What matters is how price behaves at the level.
Ask yourself:
- Does price reject immediately or hesitate?
- Are candles impulsive or overlapping?
- Does price leave the level with strength or drift away slowly?
A strong reaction tells you:
➡️ One side stepped in aggressively.
A weak reaction tells you:
➡️ The level exists… but conviction doesn’t.
3️⃣ Clean Rejections Beat Perfect Levels
A slightly imperfect level with a violent reaction
is far more valuable than a textbook level with no follow-through.
Professionals wait for:
- sharp rejections
- momentum expansion
- structure confirmation
They don’t assume... they observe.
4️⃣ Failed Reactions Are Warnings
When price reaches a level and does nothing…
that silence is information.
Failed reactions often lead to:
- level breaks
- deeper moves
- trend continuation
The market is telling you:
➡️ “This level no longer matters.”
📚The Big Lesson
Levels tell you where to look.
Reactions tell you what to do.
If you shift your focus from drawing levels to reading behavior at levels,
your trading instantly becomes clearer and more objective.
⚠️ Disclaimer: This is not financial advice. Always do your own research and manage risk properly.
📚 Stick to your trading plan regarding entries, risk, and management.
Good luck! 🍀
All Strategies Are Good; If Managed Properly!
~Richard Nasr
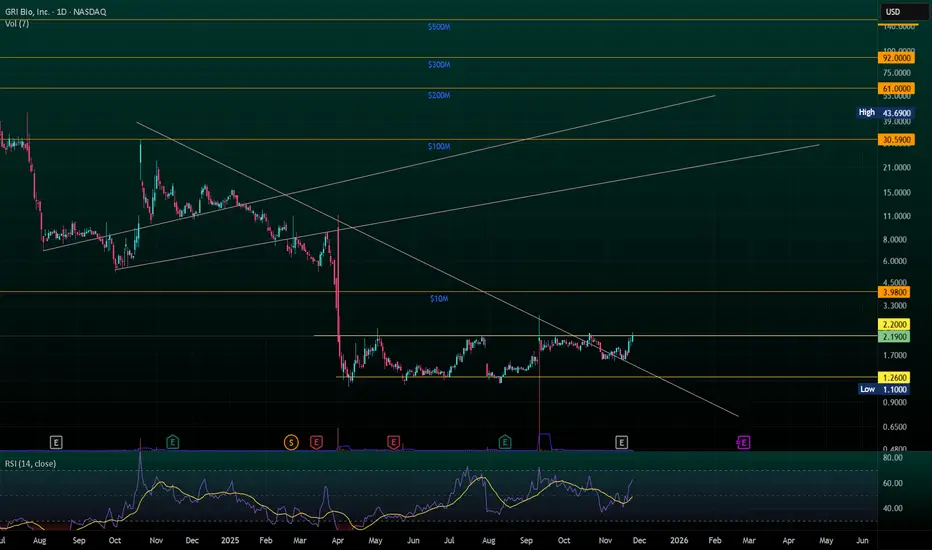
$GRI tap tap tapping $2.2 resistanceNASDAQ:GRI will release topline 12-week study data this week. All indications are that data will be positive. The price continues to test $2.2 resistance. This will be broken soon.
While all price movements are relative and unique, other companies with failed IPF trials lost ~$300M in market cap upon announcement. Others with successful trails have gained billions. GRI is worth approximately $6M today. Lots of room for upward valuation.
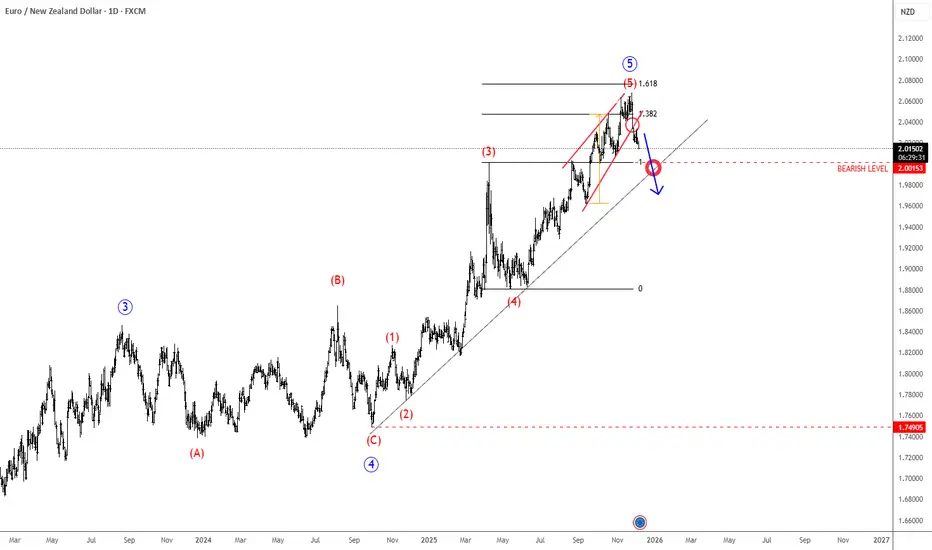
EURNZD May Have ToppedEUR is coming sharply to the upside against NZD, hitting new highs, however, looking at the wave structure, we still see the market is in a fifth wave, but it appears that this wave five has a much more extended structure than initially expected. Still, it looks like the final leg of the impulse up from the 1.7490, with the shape of a wedge now at the top, with potential reversal happening as prices comes down from a wedge, signals more weakness, especially if slips back below 2.00 level.
H&S Scenario on 4H | Jobless Claims could decideFX_IDC:XAUUSD H&S SCENARIO
Until Thursday morning, trader sentiment about another rate cut was around 80%-90% in favor, but the sentiment on the Gold price since the beginning of the week has been highly undecided 🤔 due to several economic data releases which were not strong enough to give Gold a clear direction.
Data: ( Actual | Forcasted | Previous)
Monday, December 1, 2025 🗓️
S&P Global Manufacturing PMI (Nov) 52.2 | 51.9 | 52.5 ⬆️
ISM Manufacturing PMI (Nov) 48.2 | 49.0 |48.7 ⬇️
ISM Manufacturing Prices (Nov) 58.5 | 59.5 | 58.0 ⬇️
Fed Chair Powell's speech omitted any important mentions of economic conditions or the rate cut process, focusing instead on the political processes surrounding the selection of a new Chair. 🏛️
Tuesday, December 2, 2025
CPI (YoY) (Nov) 2.2% | 2.1% |2.1% ⬆️
Wednesday, December 3, 2025
ADP Nonfarm Employment Change (Nov) -32K | 5K | 47K ⬆️
S&P Global Services PMI (Nov) 54.1 | 55.0 | 54.8 ⬇️
ISM Non-Manufacturing PMI (Nov) 52.6 | 52.0 |52.4 ⬆️
ISM Non-Manufacturing Prices (Nov) 65.4 | 68.0 | 70.0 ⬇️
U.S. President Trump Spokes about drugs and car costs mostly 🗣️
If the Gold price continues to decline past $4225 and reaches the Neckline support at around $4174 - $4179, then a further drop could send the price breaking through the Neckline and Gold could drop primarily to $4110, and secondarily down to the $4070 to $4020 mark. 📉
The Initial Jobless Claims announcement at 8:30 AM ET on Thursday, December 4, is expected to determine the next step for Gold and potentially provide a clear direction. 📰
If the actual Initial Jobless Claims figure is higher than expected, this could push Gold back toward the $4250 resistance level. ⬆️ Conversely, if the figure is lower, I anticipate the price will either fall or continue to trade sideways in the $4186 - $4225 range. ⬇️ ⚖️
The Initial Jobless Claims data may be ineffective in driving Gold's price due to the significant economic data releases scheduled for Friday, December 5. ⚠️
Core PCE Price Index (MoM) (Sep)
Core PCE Price Index (YoY) (Sep)
The technical analysis regarding the Head and Shoulders (H&S) pattern is primarily a trader-driven sentiment result. While it typically acts as a reversal signal following a recent uptrend, the pattern on higher time frames (such as the 4-hour chart) does not always offer a clear direction, and the price does not consistently follow its implications. Keep this in mind and monitor economic data releases closely.
My bias remains bearish until a clear market shift occurs.
Buy for Sell: $4200 - $4215
Late entry could be $4179 when Initial Jobless Claims look good.
Stop Loss: $4230
TP 1: $4167
TP 2: $4153
TP 2: $4116
TP 3: $4070
-------------------------------------------------------------------------
This is just my personal market idea and not financial advice! 📢 Trading gold and other financial instruments carries risks – only invest what you can afford to lose. Always do your own analysis, use solid risk management, and trade responsibly.
Good luck and safe trading! 🚀📊

USDJPY POSSIBLE TRADE IDEA?Could the USD against the JPY be in for a reversal?
currently as we can see that the pair is abit paused in price at a key support level so therefore we expect further movement to the next price balance area as we wait for price distribution.

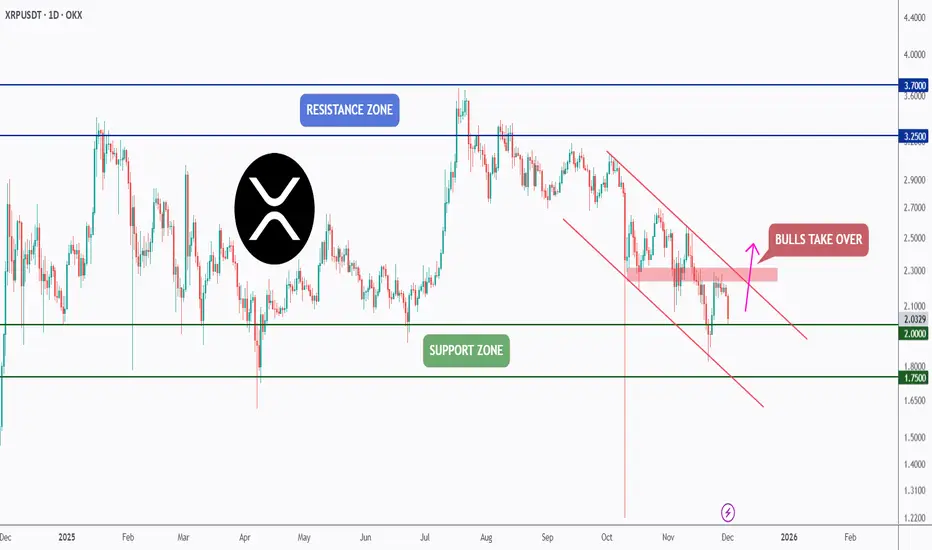
XRP - Support First, Breakout Second!📦XRP has been holding well above its key support zone , and as long as this level continues to act as a floor, we will be looking for long setups. Buyers have defended this zone multiple times, making it a critical area for a potential bullish reaction.
🏹However, for the bulls to fully take over, XRP needs more than just a bounce. A confirmed break above the falling channel and the last major high in red is needed to shift the momentum and open the door for a larger bullish leg.
Until then, the plan remains simple:
Support holds → look for longs.
Structure breaks → bulls take control.
Will XRP finally break free from this falling channel? 🤔
⚠️ Disclaimer: This is not financial advice. Always do your own research and manage risk properly.
📚 Stick to your trading plan regarding entries, risk, and management.
Good luck! 🍀
All Strategies Are Good; If Managed Properly!
~Richard Nasr
SPX WEEK 48 — Strong Bounce Into Year-End! 2026 BULL RUN COMING?Strong week for the SP:SPX index. After two weeks of hesitation candles, price finally shifted back into strength and pushed decisively higher. This week’s candle not only reclaimed momentum but fully erased last week’s cooling-off behavior.
Price also moved well above the key mid-range levels that traders usually watch to define trend health. It’s now sitting firmly above the major risk zone and continues building distance away from it — a clear sign of strength. From the moment this week’s upside break triggered, the index has gained roughly 1.9%, and that kind of move typically translates into solid returns for options traders playing directional setups.
Major support zones sit lower around 5900, 5100, and the deeper structural support near 4000. As long as price holds above the upper layers of support, momentum remains intact.
On the higher-timeframe monthly chart, the trend has been active for eight straight months with no signs of exhaustion. Price is still far above the level where the monthly trend began, and even further above the long-term midline — showing how dominant the larger trend still is.
The 2-day chart continues to support the overall bullish structure, breaking above short-term levels and maintaining strength after multiple confirmations earlier in the week.
This week was a clean continuation of the broader uptrend — strong candle, strong momentum, and strong positioning above every major structural region.
Elite clarity. Elite precision. More coming soon.

ETH - Bulls Waiting at the Intersection Zone!📈ETH remains overall bullish, moving steadily inside its rising channel. Every dip toward the lower bound has acted as a clean continuation point for the next push upward.
🏹As price pulls back , we will be looking for long setups once ETH retests the intersection of the lower trendline and the demand zone. This confluence area has been respected multiple times, making it a high-probability level for trend-following entries.
⚔️As long as ETH holds above this orange zone, the bullish structure remains intact, and the next impulse toward the upper channel boundary becomes the most likely scenario. Only a break below the demand zone would weaken the bullish outlook.
Now we wait for the retest… then let the structure guide the entries. 🤔
⚠️ Disclaimer: This is not financial advice. Always do your own research and manage risk properly.
📚 Stick to your trading plan regarding entries, risk, and management.
Good luck! 🍀
All Strategies Are Good; If Managed Properly!
~Richard Nasr

Trend Exhaustion: How to Spot a Reversal Before It HappensReversals rarely start with dramatic candles. They begin quietly, through subtle shifts in momentum and structure that most traders overlook.
A strong trend doesn’t collapse all at once. It loses strength in stages, and those stages are visible long before price turns in the opposite direction.
The first sign of exhaustion is weakening impulse strength. In a healthy trend, impulsive moves are clean and decisive, and retracements are controlled. When each new push produces smaller higher highs or lower lows, it signals reduced participation.
Buyers or sellers are still present, but the force driving the trend is fading.
The second clue lies in how price interacts with liquidity. Strong trends break key levels with conviction. Exhausted trends start reaching above highs or below lows only to reject immediately.
These sweeps show that the market is clearing liquidity without gaining follow-through, often trapping late entries and signaling that larger players are offloading positions.
A third indication appears when structure begins to fracture. An uptrend losing its higher-low sequence or a downtrend failing to maintain lower highs is a shift in narrative. A single break is not confirmation, but when it aligns with slowing impulses and liquidity failures, momentum is clearly changing.
Volatility then begins to compress. Candle ranges shrink, movement becomes less directional, and price enters a tightening pattern.
This compression often precedes expansion in the opposite direction. When a decisive candle breaks out of this cluster, the reversal typically accelerates.
Trend exhaustion is about recognizing when the conditions that supported continuation no longer exist.
By reading momentum, liquidity, and structure together, you can anticipate shifts earlier, manage risk more effectively, and position yourself on the right side of the next move.
NZDUSD - Trio Rejection… Now Waiting for the Retest!📈NZDUSD has just rejected a strong TRIO retest zone , marked by the blue circle — the intersection of the demand zone, the falling channel support, and the oversold lower trendline. This confluence has already generated a strong bullish reaction.
⚔️Now, after the initial bounce, we will be waiting for price to retest the red demand zone. That’s where we will be looking for long setups, aligning with the new bullish momentum that formed after the trio rejection.
🏹As long as NZDUSD stays above the major green demand area , the bullish correction toward the upper orange trendline remains the most likely scenario. A strong reaction from the red zone would confirm buyers stepping back in.
Will NZDUSD give us the clean retest entry? 🤔
⚠️ Disclaimer: This is not financial advice. Always do your own research and manage risk properly.
📚 Stick to your trading plan regarding entries, risk, and management.
Good luck! 🍀
All Strategies Are Good; If Managed Properly!
~Richard Nasr

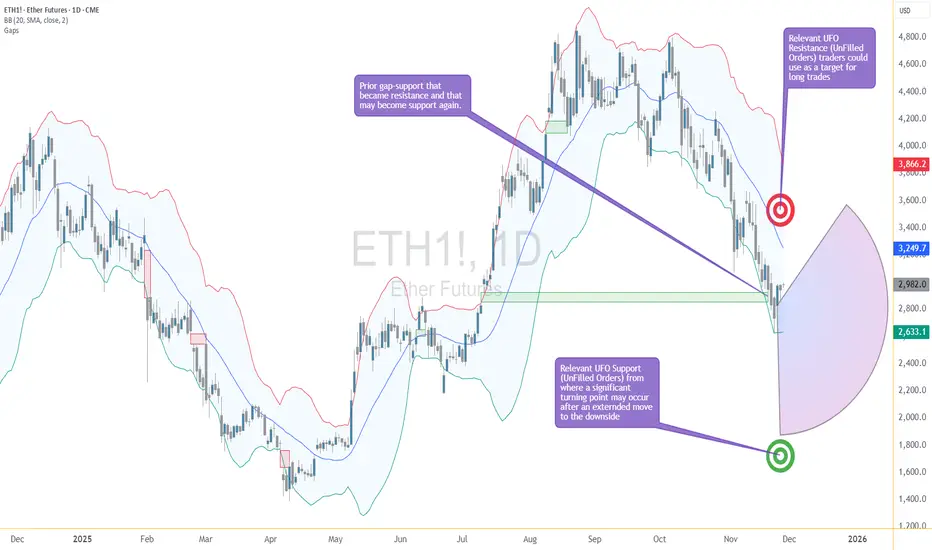
Ether Breaks the Ceiling: Is This the First Real Clue of a Turn?Ether Futures just pulled an interesting move — it finally pushed above the upper edge of the stubborn gap that has been capping price below 2853.5.
For a while, ETH was sliding down the lower Bollinger Band like a chilled skier who forgot how to turn. Now? It just jumped over the fence.
This changes things. A gap break doesn’t guarantee a trend reversal, but it’s the market’s way of saying:
“Hey, sellers… your seat might not be reserved anymore.”
The Old Barrier Is Now the New Test
That closed gap was acting like a reinforced ceiling. Buyers hitting their heads on it didn’t get far — until now. Trading above 2853.5 means the market is testing whether:
Sellers still have ammunition
Buyers can hold the reclaimed turf
Momentum is finally shifting gears
A close and hold above this zone is usually where early reversal logic starts to form.
Next Target: UFO Resistance at 3376.5
If buyers keep control, the next structural “magnet” is near 3376.5, where a cluster of unfilled sell orders waits. Markets love revisiting old unfinished business, and this is the next shelf of potential friction.
It’s not a prediction — it’s just where the roadmap naturally leads once the gap breaks.
Support Below: The New Battleground
What used to be resistance is now a potential support zone. If price pulls back toward the gap’s top edge and stabilizes, it would confirm that buyers have actually taken the wheel.
If price slips back into the gap, then this “break” was just a false alarm — the chart equivalent of stepping on a stair that wasn’t actually there.
Two Quick Read-Through Scenarios
Scenario 1 — Reversal Gains Traction
ETH stays above 2853.5
Buyers defend the reclaimed gap
Market may gravitate toward 3376.5
This would suggest the downtrend is losing its grip.
Scenario 2 — Rejection Back Into the Gap
ETH falls back below the gap ceiling
Sellers reclaim control
Market may return to prior support zones
This would keep Ether in a broader corrective environment.
The key here is not guessing — it’s waiting to see whether the breakout holds.
Futures Traders Have Two Contract Sizes to Play With
Ether Futures (ETH) are the big, fast movers.
Micro Ether Futures (MET) offer the same chart logic, but at 1/500th the size, which makes scaling more controlled.
Whether large or micro, the structure is the same — only the sizing changes.
Quick Specs (Fast & Simple)
ETH contract: 50 Ether
Tick: 0.25 per Ether = $12.50 per contract
Margin: ≈ $44,000 (varies)
MET contract: 1/500th of ETH (good for precision adjustments)
Bottom Line — The Story Just Got Interesting
For the first time in a while, Ether has stopped drifting and started acting. Breaking above the upper gap is the market’s first real sign of a potential power shift.
Now the question becomes simple:
Can buyers hold the line they just captured?
If yes → the path toward 3376.5 opens.
If no → the market falls back into its old bearish rhythm.
Either way, the quiet slide is over — this is where things get lively.
Want More Depth?
If you’d like to go deeper into the building blocks of trading, check out our From Mystery to Mastery trilogy, three cornerstone articles that complement this one:
🔗 From Mystery to Mastery: Trading Essentials
🔗 From Mystery to Mastery: Futures Explained
🔗 From Mystery to Mastery: Options Explained
When charting futures, the data provided could be delayed. Traders working with the ticker symbols discussed in this idea may prefer to use CME Group real-time data plan on TradingView: www.tradingview.com - This consideration is particularly important for shorter-term traders, whereas it may be less critical for those focused on longer-term trading strategies.
General Disclaimer:
The trade ideas presented herein are solely for illustrative purposes forming a part of a case study intended to demonstrate key principles in risk management within the context of the specific market scenarios discussed. These ideas are not to be interpreted as investment recommendations or financial advice. They do not endorse or promote any specific trading strategies, financial products, or services. The information provided is based on data believed to be reliable; however, its accuracy or completeness cannot be guaranteed. Trading in financial markets involves risks, including the potential loss of principal. Each individual should conduct their own research and consult with professional financial advisors before making any investment decisions. The author or publisher of this content bears no responsibility for any actions taken based on the information provided or for any resultant financial or other losses.