Mastering the Hanging Man PatternAlright, traders, let’s talk about the Hanging Man candlestick pattern.
This one’s a classic, and if you know what you’re looking at, it can be a game changer when you’re spotting potential reversals. So, what exactly is the Hanging Man pattern, and how can you use it to your advantage? Let’s break it down.
What Is the Hanging Man Pattern?
The Hanging Man pattern appears when the market has been pushing higher, and then—bam—a sign that it could be running out of steam. It’s called the Hanging Man chart pattern because the candlestick looks like a little figure hanging by its feet, with a long lower wick. The body is small, and the lower shadow is long—typically at least twice the size of the body. This shows that while buyers were in control, sellers came in strong towards the end of the session, pushing prices lower.
Hanging Man candles can be red or green. Even though the candle is green, it still suggests the same potential reversal because the rejection of higher prices by the sellers shows weakening bullish pressure. The key point to remember is that the Hanging Man candle pattern signals potential exhaustion in an uptrend. It doesn’t guarantee that the trend is reversing, but it highlights that the bullish momentum is waning, which could be a sign that a reversal is near.
Where to Look for the Hanging Man Pattern?
Context is everything. The Hanging Man pattern is much more significant when it appears at the top of an uptrend. In this case, it suggests that buyers are losing control, and the market could soon turn bearish. If it appears after a downtrend, it’s known as an Inverted Hammer, and its interpretation is different—it could signal a potential reversal to the upside.
So, while the Hanging Man is typically seen as a bearish reversal indicator after a sustained uptrend, it is crucial to recognize that the context matters. A Hanging Man at the peak of a strong bullish trend often attracts attention from traders as a potential signal for a shift in momentum.
How to Confirm the Reversal?
The key to using the Hanging Man pattern effectively is the confirmation candle. After spotting the Hanging Man candlestick pattern, you’ll want to wait for a bearish candlestick in the next session that closes below the low of the Hanging Man candle. This confirms that sellers have taken control and that the market is likely heading lower.
It’s also important to consider the volume during the confirmation. A strong bearish Hanging Man pattern with higher-than-usual volume adds strength to the reversal signal. If the confirmation candle has low volume, it might not carry as much weight, so always consider the volume when confirming the pattern.
However, the Hanging Man candlestick pattern is not foolproof. A Hanging Man trading pattern without confirmation can sometimes lead to a false reversal, especially in markets with high volatility or when the overall trend is still strong.
False Signals and Pitfalls
One of the biggest challenges when trading the Hanging Man pattern candlestick is false signals. In choppy or sideways markets, the pattern may form but fail to lead to a true reversal. To avoid these traps, consider waiting for the confirmation candle and also use other tools to verify the signal, like:
Trendlines: Ensure the market is actually in an uptrend before considering the Hanging Man pattern.
Support/Resistance Levels: Wait for a breakdown below a significant support level to increase confidence in the reversal.
Momentum Indicators (e.g., RSI or MACD): Use momentum indicators to confirm that buying pressure is truly weakening, as suggested by the Hanging Man pattern.
These additional tools can help you filter out false signals and increase the reliability of your trades.
The Hanging Man pattern can be a valuable tool when used correctly, but it’s not a standalone signal. It works best when combined with other forms of technical analysis, such as momentum indicators, trendlines, and volume analysis. Be patient, wait for confirmation, and always manage your risk. The Hanging Man trading pattern is a great addition to your candlestick pattern toolbox, but it should be used as part of a broader strategy that includes multiple indicators and sound risk management.
Reversal

USDCHF To Fall Further After Price Confirms Reversal @ .79797Price on OANDA:USDCHF has confirmed the Bearish Reversal @ .79797 and has formed a Lower Low!
Based from the Lower High @ .80577 to the Lower Low @ .79328, the 38.2% Fibonacci Retracement level finds itself right at the Confirmation which happens to be the next area that will be favorable for a Short Opportunity!
Once the 38.2% level is visited, we can expect Price will fall down to the next Support Level at the 1.618 Extension or Golden Ratio at .7902!

Triple Bottom At Rising Support Could Spell High Hopes For EJ!Here on OANDA:EURJPY we can see that Price was able to make a Breakout of the Rising Support to start the week last week and since, has made a Pullback to test the Breakout!
Price on Tuesday was able to make contact with the Rising Support in the 175.5 area and has formed a Triple Bottom Pattern suggesting this strong reversal pattern is aiming for higher prices!
Confirmation on the Triple Bottom Reversal Pattern will come when Price is able to Breakout of the current level holding Price @ 176.3.
Once the Breakout of the Triple Bottom is confirmed, this could generate a great Long opportunity from the 176.3 level to the next Resistance Zone @ 177.7 - 177.9

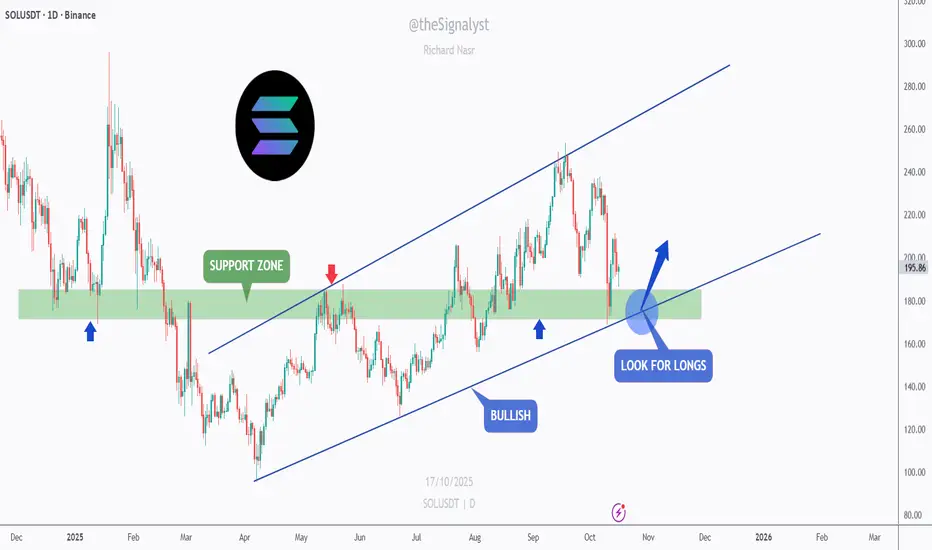
SOL - Buying the Retest Like a Sniper!SOL remains overall bullish , trading within a clean ascending channel and currently retesting the support zone that has acted as both resistance and support in the past.
This zone also aligns perfectly with the lower blue trendline, creating a strong area of confluence.
As long as this intersection holds, SOL is likely to rebound from here. I’ll be looking for bullish rejections or reversal patterns around the current zone to enter long positions, aiming for the next resistance levels near $230 and $260.
However, if the price breaks below the support zone, we could see a deeper correction before buyers regain control.
⚠️ Disclaimer: This is not financial advice. Always do your own research and manage risk properly.
📚 Stick to your trading plan regarding entries, risk, and management.
Good luck! 🍀
All Strategies Are Good; If Managed Properly!
~Richard Nasr
US100: Potential reversal from overbought zone
Symbol: SKILLING:US100
Timeframe: 30 Minutes
Indicators: OB/OS Overlap (RSI, MFI, Stochastic) + S/R
________________________________________
🔍 Quick Summary
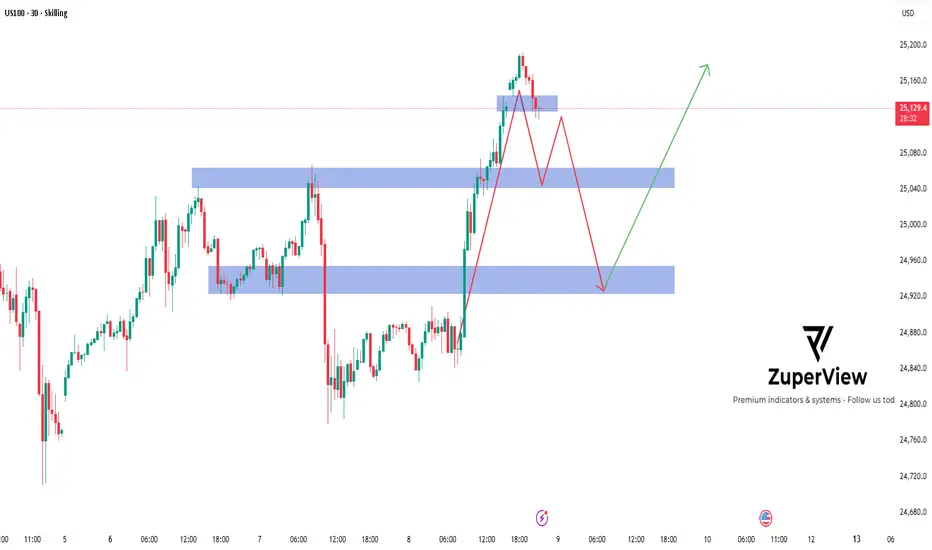
After a strong rally 🚀 from the 24,750–24,800 support area, US100 has reached the 25,280–25,300 resistance zone — where multiple oscillators are showing overbought signals.
This suggests potential profit-taking or a technical correction may occur soon.
________________________________________
📊 Price Structure
• Price formed a temporary top after tapping the overbought area, with clear rejection candles near resistance.
• A pullback toward the first support zone around 25,000–25,050 could occur before the next move.
• If selling pressure continues, the next target area lies near 24,800–24,850, where previous structure and demand overlap 📉.
________________________________________
🧩 Technical Highlights
• OB/OS Overlap: RSI, MFI, and Stochastic are all in overbought territory (3/3 alignment) — a strong early signal of potential short-term exhaustion.
• Price Action: A minor double top or bearish divergence may be forming if momentum indicators continue to decline.
• Key Zones: Blue zones on the chart mark areas of potential buyer reaction (demand).
________________________________________
🧭 Scenario Outlook
Main Scenario (🔻 Pullback Expected):
Price could retrace toward 25,000–24,850 before buyers attempt a rebound.
Alternative Scenario (🚀 Continuation):
If the price holds above 25,100 and breaks 25,280, the bullish momentum might continue short-term.
________________________________________
⚙️ Risk Note
This analysis is for educational purposes only and not financial advice.
Always manage risk carefully and align your trade plan with your own strategy 📘💡.
Market conditions can change rapidly — stay flexible and objective!
Please like and comment below to support our traders. Your reactions will motivate us to do more analysis in the future 🙏✨
Harry Andrew @ ZuperView
SNAP oversold, preparing to reverse upAfter oversold, SNAP slightly sideways with above average volume. Price is too low, back to 01.2019 price. So, the possibility of bullish reversal is very high.
The price now (Closed on 08.19.2025): $7.18.
Price target: $8.93/ $11.38/ $12.94.
Stop loss: $6.69.
Risk/ Reward ratio: 3.57.
IMO, amateur trader.

BTC – Bounce Off Daily Support, Eyes on Supply!Bitcoin has bounced from the daily support area (the broad green zone around $110K–$112K), reclaiming the intraday breakdown zone near $114K and turning it into support on lower timeframes.
As long as price holds above $112K–$113K, the short-term bias remains constructive and I am looking for continuation toward $118K, followed by the $121K–$122K supply zone highlighted on the chart.
The bulls will remain in control as long as the $107,500 mark holds as support.
⚠️ Disclaimer: This is not financial advice. Do your own research and manage risk.
All Strategies Are Good; If Managed Properly!
~Richard Nasr.

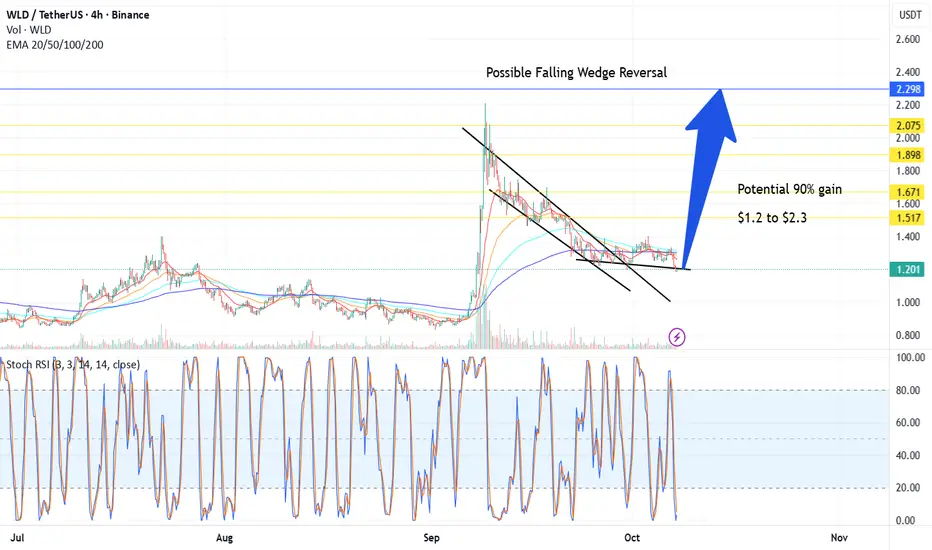
Possible Falling Wedge Reversal +90% run – 4H Setup - Worldcoin BINANCE:WLDUSDT could gain 90%
⚙️ Setup
Price has been trending down within a well-defined falling wedge since the local high.
Currently, it’s testing the lower trendline with Stochastics oversold and curving up, suggesting waning bearish momentum.
Volume has compressed, which is typical before a breakout.
We’re now at a decision point: either a bounce and breakout or a confirmed wedge failure.
Stochastics: Oversold (<20) with a possible bullish cross forming.
Volume: Decreasing — consistent with the final stages of compression.
EMAs: Price hovering around/under short EMAs (20–50); a close above them could trigger momentum shift.
📈 Plan / Hypothesis
Watching for bullish breakout confirmation above the upper trendline with increased volume.
Target: Height of the wedge projected upward (~ from breakout point).
Invalidation: 4H candle close below the lower trendline with volume expansion.
💭 Fundamenteal Thought:
We may or may not like Altman or Worldcoin's course of action to learn how to validate humanness, but the thing is, it's the only exposure we have to OpenAI and ChatGPT, and with AI everywhere, we are gonna need more than ever to validate people being real.
Considering Open AI, the disease, being worth $500 Billion, I think that the potential cure that Altman himself fabricated, Worldcoin, having a market cap of less than $3 Billion is pretty cheap. There's still many token to airdrop.
Anyhow, it all depends on what utility the token ends up delivering, I see that if this token is used to validate humanness, this will be really valuable. And ofc of what competitors do.
NZDJPY – Retesting Upper Channel: Looking for Shorts!NZDJPY remains inside a falling channel on the 4H.
Price just spiked back into the upper trendline / supply (87.40–87.80), where sellers have reacted before.
As long as this red zone holds, I’ll look for lower-high + break-of-structure sell setups toward 86.30, then the 85.40–85.00 channel low.
A clean 4H close above ~88.00 would invalidate the idea and open room for 88.70–89.00.
⚠️ Disclaimer: This is not financial advice. Always do your own research and manage risk properly.
📚 Stick to your trading plan regarding entries, risk, and management.
Good luck! 🍀
All Strategies Are Good; If Managed Properly!
~Richard Nasr

NEAR – Post-Breakout Impulse in Play!NEAR has already broken out of its accumulation phase, confirming the end of its consolidation and the start of a fresh impulsive leg within the macro falling channel.
As long as price holds above the $2.80–$3.00 breakout zone, the bullish structure remains intact, with the next targets at $4.20–$4.80 and potentially $6.00–$7.00 — the upper boundary of the channel and a key confluence zone.
If price slips back below $2.80, it would signal a failed breakout and a possible retest of the previous lows.
⚠️ Disclaimer: This is not financial advice. Always do your own research and manage risk properly.
📚 Stick to your trading plan regarding entries, risk, and management.
Good luck! 🍀
All Strategies Are Good; If Managed Properly!
~Richard Nasr

Reversal in progress?Is NESF starting to complete the Head phase of an inverse H&S pattern?
Still no end to the downtrend yet.
Probably need to wait another 12 months to see.
If the BOE further reduce interest rates, this will help its cost of capital.

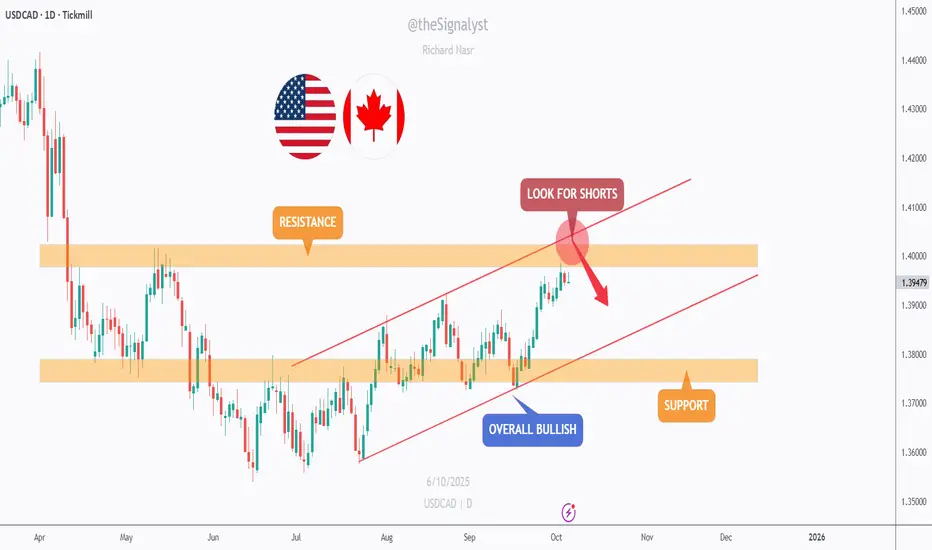
USDCAD – Testing a Major Resistance ZoneUSDCAD remains overall bullish, trading within a rising channel.
However, price is now approaching a key intersection between the upper trendline and a major resistance zone around 1.4000.
As price nears this confluence area, we’ll be looking for potential short opportunities, anticipating a possible rejection before any continuation higher.
The next support zone sits near 1.3750, where buyers might step back in if a pullback occurs.
⚠️ Disclaimer: This is not financial advice. Always do your own research and manage risk properly.
📚 Stick to your trading plan regarding entries, risk, and management.
Good luck! 🍀
All Strategies Are Good; If Managed Properly!
~Richard Nasr
Range-Bound Rocket: BTC’s Coiled Spring Between S1 and R3-ATHRange Bound Rocket: BTC Loaded and Coiled for $120k Retest
Description:
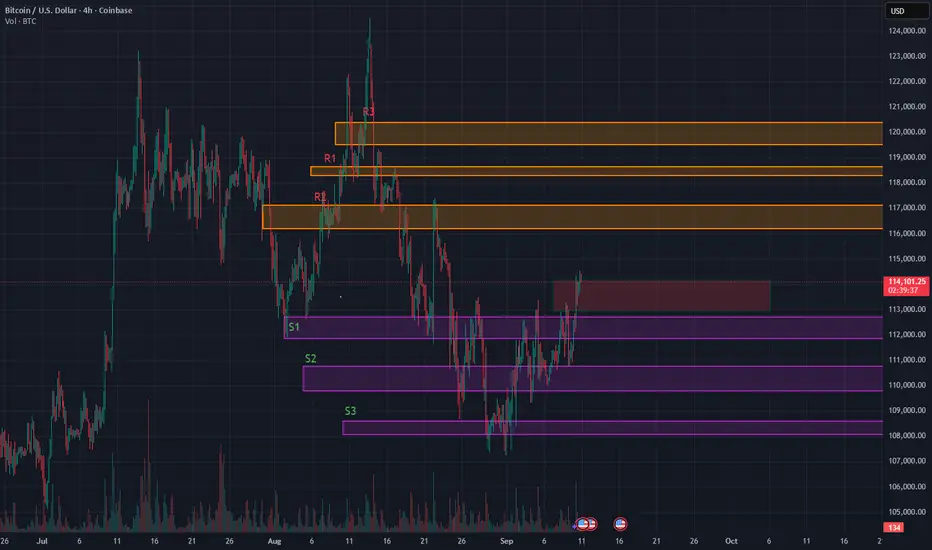
BTC is now trading around $114,260, still inside the range I’ve flagged earlier. We reloaded at our previously posted support zones between $110k and $111k. That gives us a strong base.
I’m watching for acceptance above the $113k to $114k red box, which overlaps with the neckline of a potential reverse Head & Shoulders on the 4‑hour chart. It hasn’t triggered yet but we are in validation mode. (expecting a retest to 113k and then a break up) If we get a breakout with volume expansion and wide‑bodied candles, I’ll treat that as a valid activation. Target remains $119k and above.
This table shows how likely BTC is to stay above certain price levels over the next two weeks based on current volatility. These are not predictions, they represent statistically expected ranges based on price behavior.
2WK/Probability, Price Level, Meaning
90%, ~$96,700 BTC is very likely to stay above this level
75%, ~$103,200 BTC has a strong chance of staying above here
50%, ~$111,000 This is the midpoint, BTC has equal chance of being above or below
25%, ~$119,400 BTC has a one in four chance of closing higher than this
10%, ~$127,400 Only a small percentage of outcomes put BTC above this level
Key takeaways:
BTC is currently trading around $114,260, sitting just above our red resistance zone at $113,000 to $114,000.
Our first upside target, $118,000, lines up with the top 25 to 30 percent range of expected outcomes. This is reachable if the broader market stays supportive.
$120,000 sits closer to the top 20 percent threshold. BTC would need strong momentum and favorable macro data to push there in the next two weeks.
Downside probabilities
While the structure looks bullish, we should still consider these potential retracement levels:
Around 46 percent chance BTC dips below $110,000
Approximately 43 percent chance it drops under $109,000
Roughly 30 percent chance BTC trades below $105,000
These downside paths are consistent with our S2 and S3 support zones, which were successfully defended during the last major pullback.
What I'm doing and suggest :
Breakout confirmation:
I’m looking to add above $113k to $114k only if volume expands and candles show conviction, meaning minimal wicks and strong closes. Weak volume or upper wicks mean the breakout could fail. Main stop is back inside the range. Scalpers can use a tighter invalidation below $112.2k.
Reload zone:
A move into $110k to $109k is a statistically common retest. I’ll look for buyer defense and fading downside pressure to reload.
Volatility risk:
I'm already positioned long from our previously posted support zones around $110k to $111k, so I’m not actively adding or hedging right now. Into CPI and the Fed, I’m staying hands-off unless we get a clear breakout or strong market signal.
For those not in position:
Avoid chasing breakouts before the event
Look for confirmation or reaction post-data
If we get a volatility spike, retests of $110k to $109k are still statistically common and may offer a better entry
The goal is to avoid being overexposed heading into binary catalysts. I’m holding my current spot exposure and letting the trade breathe.
If no breakout forms:
I expect BTC to remain in a range between $111k and $118k. Support zones from prior posts maintained a bullish bias. If BTC consolidates below $114k but keeps forming higher lows, I’ll consider that ongoing accumulation.
Catalysts to monitor:
Nasdaq or NQ breakdown
• Tech strength: Nvidia up ~30% YTD on strong Blackwell Ultra demand, ADI and MX showing strength despite macro headwinds.
Jobless claims rising again
• U.S. jobless claims are rising to 237K, signaling labor market cooling. Continuing claims are easing but job additions in August were weak at just 22K. Recent wide downward revisions (~911K fewer jobs year-to-date) reinforce rate‑cut bets.
Geopolitical risk
• Geopolitical tensions remain tail‑risks.
Fed rate tone and CPI reaction
• Fed tone and CPI outputs are increasingly important as data is tilting soft and markets are pricing in easier policy.
• The USD’s trajectory matters. Further weakness helps BTC and tech space gain more cushion.
Tech remains a key driver. AI and semis continue to lead Nasdaq strength, and BTC still tracks equity moves closely. A soft dollar also reduces market drag and supports upside potential.
US30: Key support breakdown signals potential sell opportunity
1. Current Market Overview 🌐
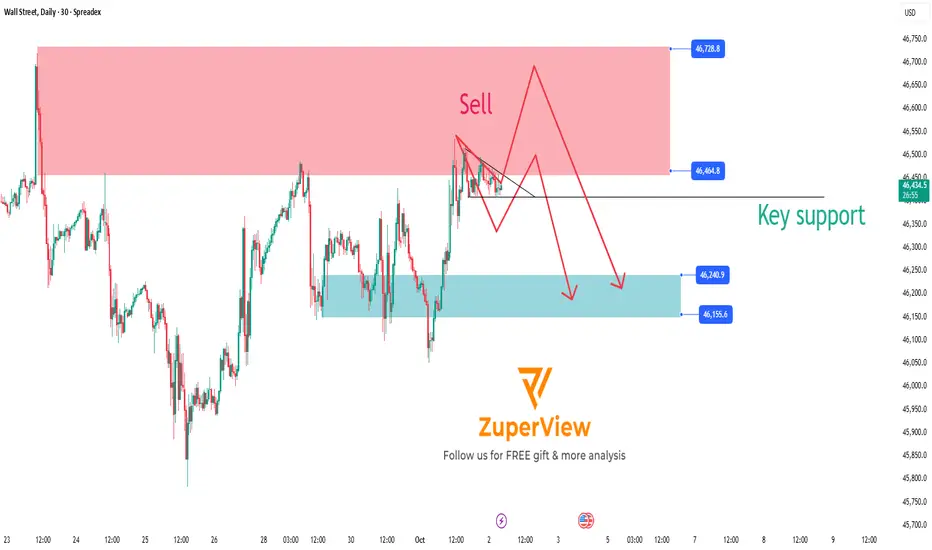
The SPREADEX:DJI index is approaching a significant resistance zone where selling pressure is expected to be strong. The price is currently consolidating and moving sideways around this area, preparing for a major move.
2. Technical Signals and Momentum Indicators 📊
Momentum indicators such as MFI, RSI, and Stochastic have all entered the oversold territory, while also showing signs of price compression (consolidation), indicating the market is waiting for the next breakout.
The strong resistance zone and the Overbought/Overextended (OB/OS) signals suggest that buying pressure is weakening, which is favorable for sellers.
3. Sell Scenario on Key Support Breakdown 🔻
If the price breaks below the important Key Support level shown on the chart, this will confirm the beginning of a downtrend.
Traders can consider opening sell positions as soon as the breakout occurs to take advantage of the downward momentum.
The price target is expected to move toward lower support zones where buying interest may emerge to cause a price correction.
4. Risk Management ⚠️
Place stop-loss orders above the resistance zone or the nearest recent highs to protect against unexpected market moves.
Adjust your position size according to your risk tolerance.
5. Conclusion 🔑
The sell setup on US30 is very clear with a strong resistance zone and momentum signals indicating a potential upcoming downtrend.
Main scenario: Breaking the Key Support will trigger a strong decline, providing a profitable trading opportunity for sellers.
Wait for a confirmed support break before entering the trade to ensure safety and effectiveness.
Please like and comment below to support our traders. Your reactions will motivate us to do more analysis in the future 🙏✨
Harry Andrew @ ZuperView
Cannabis stocks are looking bullish!Loving this setup with an ABC correction and a double bottom on TCNNF. The whole cannabis industry is very undervalued and should see a huge run with a big-picture reversal.
As always, stay profitable.
- Dalin Anderson

AUDNZD at Historical Levels - Layer ShortsAUDNZD at Historical Levels - Layer Shorts
Every once in a while, markets reach extreme levels that can be taken advantage of. This is one of those times.
📊 Technical Analysis:
AUD/NZD D1 RSI is currently trading at its highest daily levels ever. We have only seen this once before, in August 2020. What followed then was a 630-pip downside move over the next 4 months.
Could this happen again, and should you short it? Let’s discuss:
🌍 Fundamental Perspective:
The move higher in AUD/NZD has been largely driven by NZD weakness. This stems from deteriorating economic data for the New Zealand economy. Currently, forward markets are pricing in a 0.5% rate cut at the October 8, 2025 RBNZ meeting. This is VERY dovish, and naturally, banks have been selling NZD heavily (as also reflected in EUR/NZD and NZD/CHF).
However, pricing in a double rate cut at the upcoming RBNZ meeting may already be as dovish as it gets. Yes, another cut later this year is possible, but often currencies show their largest moves around key events like rate decisions. The RBA (Australia’s central bank) is also due to announce policy this coming week. So we have two fundamental catalysts in play.
💡 Potential Trade
How can you take advantage of this setup? I would not short it outright. Instead, I would begin layering in small short positions (maximum of 0.2% per 1 ADR). If the market moves 1 ADR against you, you can add another very small position. This way, your average short entry remains close to current levels. Eventually, we are likely to see a mean-reversion move. This may take time, but history shows that at these RSI levels (and even lower), we have often seen significant pullbacks to the downside.
Keep this pair on your radar—it may pay off nicely with patience.
Best,
Meikel

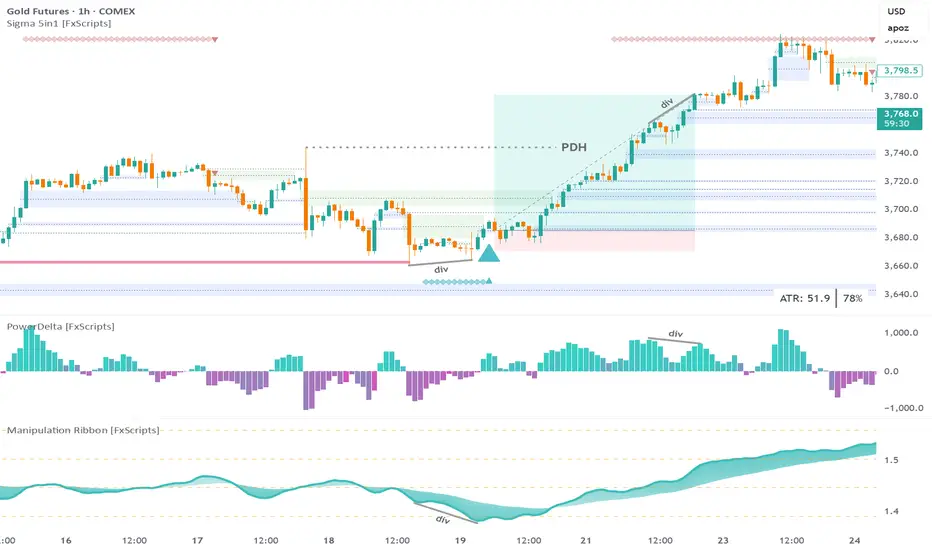
GC Futures 15m: 6.6:1 trade executed using Sigma Trading SystemStep 1: wait for a sweep of daily liquidity
Note: the sweep must be confirmed for any of the other confluences to be valid
Step 2: wait for a bullish marker to be drawn by the Reversal Print indicator
Tip: set an alert if you don’t want to spend all day staring at the chart
Step 3: look for a divergence with either the PowerDelta Oscillator or, in this case, the Manipulation Ribbon
Info: the Manipulation Ribbon detects areas of price manipulation by Market Makers vs areas where it is trading in a natural, price-driven state
Step 4: the entry is a tap of the most recent confirmed FVG
FYI: all the drawings on the main chart are created by the Sigma 5-in-1 indicator
SL: low of first candle that forms the entry FVG
Tip: for a more conservative approach the recent swing low could also be used
TP: bearish divergence with the PowerDelta Oscillator
Note: gold was at an all-time high so anything beyond the Previous Day High (PDH) posed a risk however for a more conservative approach you could exit half your position at the PDH
POL - Confluence at Demand: Longs on the Trendline?POL BINANCE:POLUSDT has been overall bullish on the daily, moving inside a rising channel. Price is sliding toward the demand zone at $0.19–$0.21, right where the channel’s lower trendline comes in, clean confluence for dip buyers.
This zone is key 🔑. If bulls defend it, I’ll look for a rotation toward $0.25, then $0.29–$0.31 near the channel mid/upper bounds 🚀.
If $0.19 fails on a daily close, I’ll step aside and reassess lower before looking for fresh confirmation.
What’s your move => bid the confluence at $0.19–$0.21, or wait for strength back above $0.25 first? 🤔
⚠️ Disclaimer: This is not financial advice. Always do your own research and manage risk properly.
📚 Stick to your trading plan regarding entries, risk, and management.
Good luck! 🍀
All Strategies Are Good; If Managed Properly!
~Richard Nasr

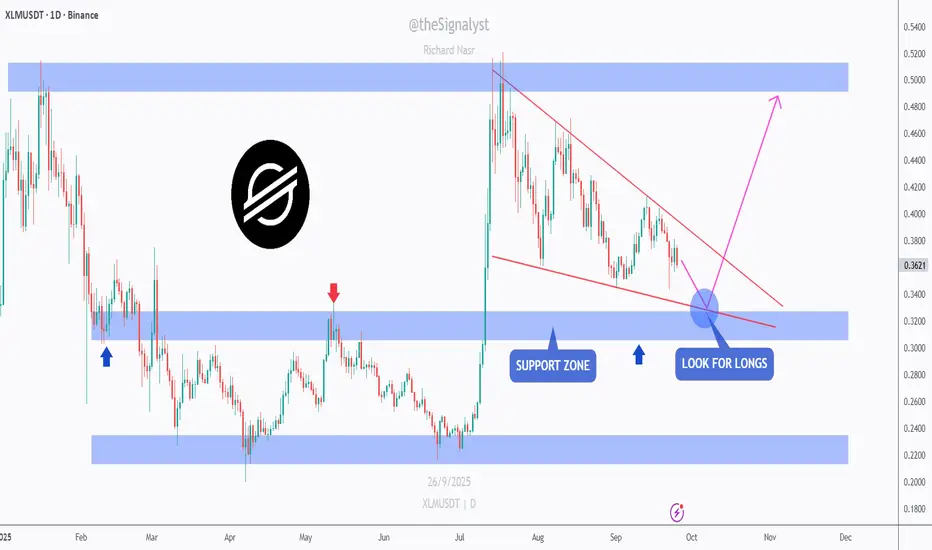
XLM - Waiting for the Wedge × Support RetestXLM is drifting inside a falling wedge and approaching the 0.34–0.32 blue support. I’m waiting for a retest of the intersection between the wedge’s lower trendline and this support to look for longs.
If buyers defend that confluence, I’ll look for a move toward 0.39–0.41, then 0.46–0.52 into the upper supply. A daily close below 0.32 invalidates and puts 0.24–0.23 back in play.
What’s your plan => bid the retest at the intersection, or wait for a clean wedge break first? 🤔
⚠️ Disclaimer: This is not financial advice. Always do your own research and manage risk properly.
📚 Stick to your trading plan regarding entries, risk, and management.
Good luck! 🍀
All Strategies Are Good; If Managed Properly!
~Richard Nasr
USDJPY - Red Low or Orange Resistance: Your Trigger Map!USDJPY squeezed off 146.0 and is testing the 148.8–149.2 orange resistance on the 4H while momentum cools.
Here’s the plan 🔑
If the last low in red is broken downward, the bears take over, and I’ll look for 147.2 first, then the 146.0 support zone.
If the orange resistance is broken upward and holds, I’ll expect continuation toward the upper supply at 150.7–151.0 (with 150.0 as a waypoint).
What’s your move => fade a failure at the orange band, or buy a clean break and hold into 150s? 🤔
⚠️ Disclaimer: This is not financial advice. Always do your own research and manage risk properly.
📚 Stick to your trading plan regarding entries, risk, and management.
Good luck! 🍀
All Strategies Are Good; If Managed Properly!
~Richard Nasr

USDJPY - Support Holding Strong!📈USDJPY has been overall bullish trading within the rising channel marked in blue.
This week, USDJPY has been bearish trading within the falling red wedge and it is currently rejecting the lower bound of it!
Moreover, the orange zone is a strong support.
🏹 Thus, the highlighted blue circle is a strong area to look for buy setups as it is the intersection of the lower red trendline and orange support.
📚 As per my trading style:
As #USDJPY is around the blue circle zone, I will be looking for trend-following bullish reversal setups (like a double bottom pattern, trendline break , and so on...)
📚 Always follow your trading plan regarding entry, risk management, and trade management.
Good luck!
All Strategies Are Good; If Managed Properly!
~Richard Nasr

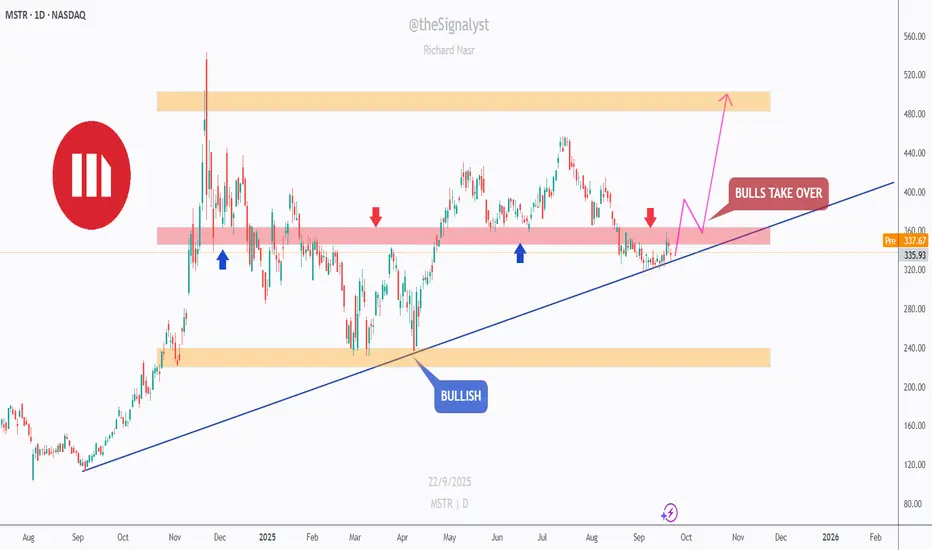
MSTR - Trendline Support vs. Supply Cap!MSTR has been overall bullish on the daily, respecting a rising trendline since last year. Price is coiling right beneath the 330–350 supply band after multiple rejections.
This area is key 🔑. It overlaps prior supply and the rising trendline—clean confluence. If bulls defend the trendline and we see a clean daily close above 350, momentum could extend toward 400 first, then 470–520 inside the broader range 🚀.
If the trendline gives way, I’ll look for a deeper dip toward 260–240 demand before bulls try again. Until then, structure favors the upside while the line holds.
What’s your plan => buy strength above 350 or wait for a retest on the trendline first? 🤔
⚠️ Disclaimer: This is not financial advice. Always do your own research and manage risk properly.
📚 Stick to your trading plan regarding entries, risk, and management.
Good luck! 🍀
All Strategies Are Good; If Managed Properly!
~Richard Nasr
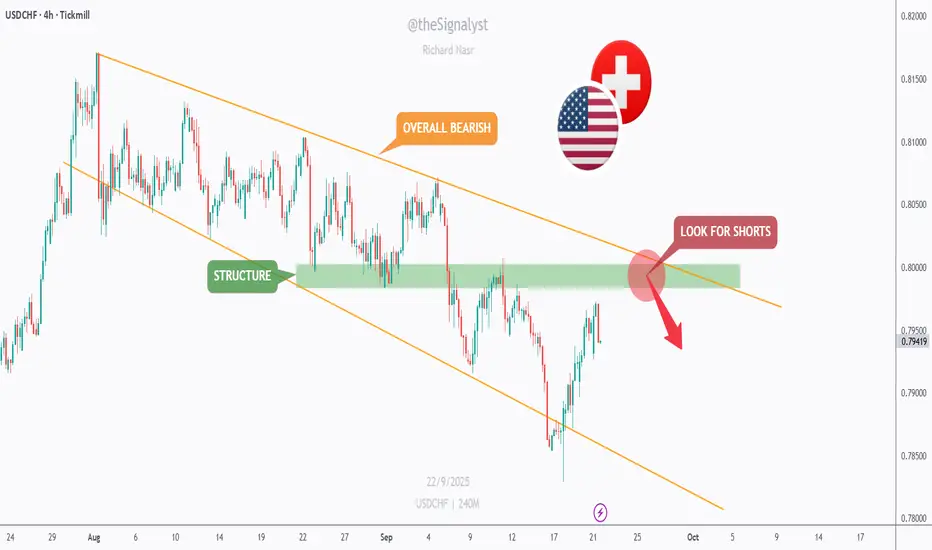
USDCHF — Rally Into Structure, Short the Retest?USDCHF has been overall bearish on the 4H, sliding inside a falling channel. After a bounce, price is rotating back into the 0.798–0.802 structure zone, right at the channel’s upper bound.
This confluence is key 🔑. If sellers react here, I’ll look for rejection shorts toward 0.790 first, then 0.785–0.780 near the channel floor. A clean 4H close and hold above 0.802 would invalidate the idea and expose 0.806–0.810 next ⏳.
What’s your plan => fade the rally at supply, or wait for confirmation before jumping in? 🤔
⚠️ Disclaimer: This is not financial advice. Always do your own research and manage risk properly.
📚 Stick to your trading plan regarding entries, risk, and management.
Good luck! 🍀
All Strategies Are Good; If Managed Properly!
~Richard Nasr