Challenges of Fading and OverextensionIntroduction
Fading is a strategy where a position is taken against the prevailing move, based on the expectation that it is overextended and likely to reverse. While mean reversion is a valid market phenomenon, some methods are built on incomplete beliefs about how markets operate.
From Normal to Deviation
Markets can be evaluated relative to their recent or average behavior. Price movement within these bounds is considered normal, while a notable move beyond them is referred to as a deviation. This is interpreted as an overextension, where indicators tend to show overbought or oversold values.
However, overextension does not necessarily imply that exhaustion is present. It simply marks a departure from normal behavior. Whether this leads to reversal or continued movement depends on broader market context.
Markets also tend to exhibit volatility clustering; periods of high volatility are followed by further volatility, and calm periods tend to persist. In other words, a strong move often leads to another. This challenges a common bias that an extended move must suspend or reverse.
The Limitations of Indicators
Indicators can show when price has moved outside a reference point. For example, oscillators, boundaries, or momentum values may signal overbought or oversold conditions. However, these readings are not signals on their own. The broader context matters more and determines whether the move is likely to reverse or continue.
In this chart, price moves outside the upper envelope on two separate occasions, each showing a deviation from recent average behavior. In the first case, the move results in a successful reversion. In the second, price remains extended above the band for several weeks, maintaining persistent momentum. Both instances show similar values, but the outcomes were different. This illustrates that tools should not be interpreted in isolation.
In this chart, RSI reaches overbought levels on two separate occasions. In the first case, the overextension is followed with a mean reversion. In the second, the same condition marks the beginning of a strong upward momentum move. Both events show similar indicator values, but the results were different. This reinforces that identical values can lead to different outcomes depending on the context and underlying structure.
Low Volatile Trends
Low volatility trends present recurring challenges and are worth consideration. These environments are characterized by price moving along structural boundaries with minimal retracement or mean reversion. The absence of counter-movement makes them difficult to fade, as directional drift may persist longer than expected. Attempts to fade these trends or build positions over time can introduce notable risk and limited potential, as reversion remains uncertain. A better approach is to wait for a sharp reversal or the formation of a new structure before considering any setup.
The Risk in Fading Systems
Fading can produce high win rates in range-bound or indecisive markets. Positions tend to be averaged down as price extends further, based on the expectation of a return to the mean. This approach can be effective over a series of trades, but its success depends on eventual reversion.
The risk emerges in less frequent but severe scenarios where momentum persists and price continues to expand beyond expectations. These low-probability but high-impact outcomes tend to be overlooked, but when they occur the consequences can be severe without proper risk control.
This simulation models a high win-rate fading strategy using an initial account size of $100,000. Each trade targets a gain of 0.5% of the account, or $500 based on the starting balance, and the win rate is set at 91.20%. These values are intended to simulate frequent small wins with the assumption that losses will be infrequent.
Losses in this case are set to 5% of the account size, or $5,000, to represent situations where a trader continues to average into a losing position until a maximum loss threshold is reached. In real conditions, some traders may exceed this amount, either deliberately through increased exposure or due to loss of control.
Across 50 simulation runs of 1,000 trades each, the average final balance was $118,109. The best case ended at $240,858, while the worst case dropped to $47,090. The average maximum drawdown was over 43%, and the worst drawdown reached nearly 70%. Half of all simulations finished below the starting balance. These results illustrate that while most trades may perform as expected, rare but oversized losses can and do occur. Despite a strong win rate, the long-term outcome becomes increasingly dependent on avoiding a handful of catastrophic trades.
Strategies like this often appear stable because of their high success rate, which can create a false sense of security. This perceived consistency can lead to increased confidence, relaxed risk limits, or more aggressive sizing. However, the simulation makes clear that even a few failed trades are enough to reverse months of profits or endanger the entire account. Without strict risk control and structural awareness, the strategy becomes vulnerable to failure with little warning and limited opportunity to recover.
Fading as a Valid Approach
Fading strategies are not inherently wrong. In fact, a lot of profitable and well-developed systems are built on the concept of fading strength or weakness. The concepts explored, such as excursion from the mean, structural failure, or climactic behavior, can all serve as valid references.
The problem arises when a move is assumed to have extended too far and must reverse, without clear reference and in opposition to strong momentum. This, combined with poor risk management, can have notable consequences. Therefore, it is essential to have a proper understanding of market structure and disciplined risk control.
Trend Context and Deviation
For traders who prefer to align with the prevailing trend, an overextension can be evaluated as a potential momentum move. In such cases, one approach is to wait for price to pause or pullback, then enter on continuation. This process can be repeated as long as the trend remains intact. A full reversal should not be considered until there is evidence of structural failure, such as a trend break followed by momentum developing in the opposite direction.
Indicators that show overbought or oversold can be helpful in these events. Their purpose would not be to predict reversion, but to serve as a filter that helps avoid continuation entries when price is extended. This can reduce the risk of entries near potential exhaustion, which is a reasonable practice.
This example shows a case where entries are withheld while price is above the upper envelope, which helps to not chase the move. This illustrates how overbought conditions can serve as a simple filter. Note, towards the end price continued even further, which is to be expected at times. Therefore the purpose is not to predict the reversion but to avoid entries at overextended levels without a pause or pullback.
Reversion

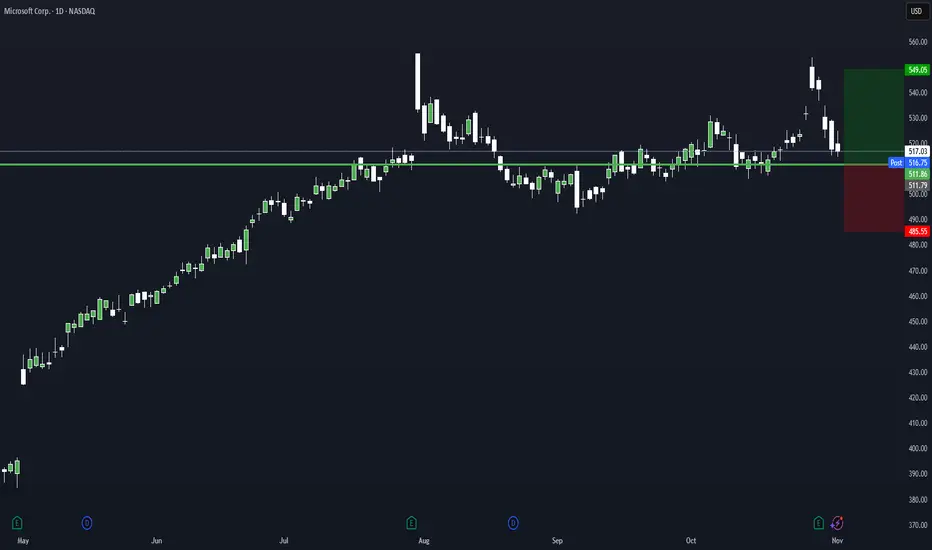
Rebound Setup: Limit-Buy after Short-Term Exhaustion (MSFT)Hi Traders
This is a systematic mean-reversion setup I use across liquid ETFs and large-cap equities.
The goal is simple: enter weakness into exhaustion, not falling knives.
I will place a limit order for MSFT at $511.86. If the order remains unfilled, I will cancel it at the close of trading tomorrow.
Key Concepts:
Oversold short-term conditions
Price deviation vs recent mean
Volume/volatility context
Limit order for the next session only when criteria align
Exit next session open (or rules-based exit, depending on version)
I don’t chase dips — I predefine levels and only enter when price comes to me. This trade idea triggered a limit buy level for today on EFA at 93.55.
General notes:
Works best in mean-reverting environments
Avoid news catalysts & low-liquidity names
This is not a signal service — just a research-based framework
If you like data-driven, rule-based setups, follow along —
I will share more systematic edge ideas like this.
Rising Costs & Economic Uncertainty: What January Taught Us and And then there’s UPS. A 20% drop is not just a stock market hiccup—it’s a symptom. The logistics giant, a bellwether for commerce, is struggling under the weight of declining demand, operational cost increases, and shifting consumer behavior. The question is, who’s next? If a company as ingrained in global trade as UPS is faltering, what does that signal for the rest of the economy? Retail? Small businesses? Tech?
February looms with uncertainty. Will we see further price hikes, layoffs, or corporate contractions? Or will there be a recalibration, an attempt to stabilize? If January was a lesson in upheaval, February may well be a test of resilience.
economy update, cost of living, milk and egg prices, gas prices 2025, UPS stock drop, inflation impact, economic downturn, market analysis, America First policy, supply chain crisis, financial news, economic forecast February 2025, stock market trends, political economy, consumer prices

XAGUSD LONG-ScalpingThis is a high-risk trade setup. While I believe silver has more room for a rally, I expect it may need a significant drop first—that's what my instincts say. However, based on the charts, I’ve decided to go long as the price action has been resilient and seems poised to recover from yesterday's bearish whipsaw candle. Reminder: this is a high-risk trade with 0.50% capital at risk.

Potential Spread TadePotential Pairs Trade setup:
Long: 100 shares of AAL
Short: 272 shares of JOBY
Target would be 1-2$ of the spread

$ISV - Breakout play for +10 to 30% Technical Analysis (TA)
The monthly and weekly was oversold and price pushed higher with significant momentum after a consolidation phase.
Retracement to $25 is expected However, the push to $30 would require catalysts to increase momentum.
We could hit $25 and then come back down or go through another consolidation phase before further upside to $30.
Price Target
Entry: $22-$23
Target 1: $25
Target 2: $30

$ATLY - Oversold with +40% upside potentialTechnical Analysis ( TA)
Weekly William and RSI look very oversold so I am expecting a mean reversion to at least 0.20
Daily chart is showing initial signs of the mean reversion/reversal but its not let confirmed on the reversal until we cross the 50EMA.
Price Target
Entry: 0.175 - 20.5
Target 1: 0.25 (+40%)
Fundamental Analysis (FA)
Financial Metrics look good.

S&P 500 ---→ IN FOR A DEEP CORRECTION. MEAN REVERSION PENDING.S&P 500 IS IN FOR A DEEP CORRECTION.
Monthly SPX Regression Channel, spanning 40 years, with bands of +4/-4 standard deviations.
This is a long-term channel showing a Normal Distribution of SPX price occurrences.
At least 95% of the price occurrences occurred within the Comfort Zone, the blue area between +2/-2 stdev as it should be.
For 14 months (3.54% of the total bars) price has come out above the Comfort Zone, and even beyond +4 stdev.
In an uptrend channel this type of action commands a Mean Reversion most of the time.
Because this channel and its bands are dynamically calculated, the only alternative is for the price to stay out of the Comfort Zone until the channel adapts or accommodates (widens) to engulf the new prices, but in this case everything points to a MEAN REVERSION WITHIN THE NEXT 12 to 24 months.
THEREFORE SPX IS GOING LOWER.
Currently the Comfort Zone is between 3632 / 1818
Bear markets are not cleared up in a few days or weeks. They take time to unwind.
Bear market rallies: Trade'm, but don't Trust'm
We wrote an article about this channel on Feb-21-22

Mean Reversion ETH BTCBINANCE:ETHBTC
Using Mean Reversion to enter at oversold (Diverge to under -4000 ) ETH and sell when ETH overbought (Diverge above +5000)
Profit in USD : 22%
IN USD BTC PRICE BTC AMOUT ETH BTC PRICE ETH AMOUNT USDETH Price USD OUT
1000 41924.13 0.023852612 0.06488 0.367641983 0.000284967 1290.121893
Thanks to @wolneyyy Mean Deviation Detector - Throw Out All Other Indicators

$TGT incoming bounce on its way, another short covering rallyA big bounce is imminent on $TGT here in the next few days to weeks, the stock has declined significantly in a brief amount of time and is now showing inside candles representing balance, a push over 221 will take us screaming higher. Short covers bring the excess liquidity, strong numbers represented by Target this holiday season is a contributing factor why we will bounce here. Be patient, another big trade is coming. Jan 220/225 calls can work on confirmation candle.

Trade Pull Backs To The Trend Line And MeanEnter at 161.89
Exit at 170.29
Stop Loss at 159.00
EMA 10 Close Price: 162.57
EMA 20 Close Price: 161.01
Close Price: 161.89
Trend Line Price: 159.00

BTC. statistically high chances of correction to monthly pivotThe last 4+ years have only ever seen 2 months NOT have price test their monthly pivot points (which is around 57k) those months were January 2021 and December 2017. It could always happen a third time. I am just saying... that is over 95% frequency. Easy enough to backtest with standard pivot points monthly levels.
P.S. This does not mean it must happen now. This statistic is valid within an intramonth period.

BTC bitcoin may have one more downswingI believe it might go to 57k. but from where is harder to guage. could manage risk at the weekly H4. With optimal entry at H3 area
The reason I believe it will go to 57k is because that is the new monthly central pivot point area. And over the last 4 years or more... only TWO months did not see price test the monthly pivots.
However if the Weekly h4 is broken on a daily close. I think it may reverse to this point from around 67k instead.
Be careful here reguardless of what you do

My Personal Idea about US30Hey guys,
my name is Ryann, i from Brazil.
What can you understand in my chart? tell me
tks

BTC bitcoin. downswing setupentry weekly H3. target weekly L3. stoploss weekly H4
done with weekly camarilla pivot points

My prediction for btc bitcoinFrom H3 to Pivot and or L3. only invalidated with a daily close above H4. these are monthly camarilla pivot points. good luck

Btc pivot point trade setup.target L5 and L6. or monthly pivot at around 45k or the monthly l3 at 44k. tight stop daily H4. using camarilla pivots daily levels with the logic that new monthly pivots revert price action like magnets

BTC weekly cam pivots setuptarget L3 and / or beyond. Stop on H4
camarilla pivots and cpr. weekly levels

Still downward trend is at hand!I don't know much about technical analysis yet, but I think measuring mean of price alterations during a period of time is good for future price behavior here is my simple idea:
✔ 14 hour mean, price is not even close to it yet
✔ 6 hour and 3 hour means, price is between these if goes lower than 3 hour mean then we still have the downward trend
Even deviation can help you here, good luck on investing... ✌😉

btc intraday pivot reversionjust saying high possibility that purple line gets struck. camarilla pivots eith cpr. daily levels. untested pivots usually get hit

Eth potential short setupusing weekly pivots / daily pivots. pivot reversion. and diveregence + oscillation

btc bitcoin predictionGreen would mean up first then down. Red would be down first and then up.
I favor the red first. However no matter which happens first Ithink the monthly pivot point does get struck because historically it does over 95% of the time recieve price reversions
using camarilla pivots and cpr monthly levels, linear regression. HH LH LL LH with RSI and oscillators on chart.

BTC..be careful herenotice the monthly pivot "next pivot" coming in at 37k. It is likely price tests the next monthly pivot. how likely? the last 54 of 56 (at least) monthly pivots have had price reversions to.
it could come in at a higher point and retrace from higher with this last day of price action though. which could get bullish and raise it up. or it could get lowered. point being... no need to rush into a long position. wait for a proper retrace.
using camarilla pivots and CPR
