EURGBP: Price Showing Signs Of Exhaustion! Price is showing signs of exhaustion on 4H charts. This is evident by the Bearish RSI Divergence on the RSI. Have a look at the link below for the advanced technical and fundamental idea behind this setup.
For more complete information, the main 4H chart provides all the required details.
Cheers, I hope you find this insight helpful. Please LIKE & FOLLOW for more insights on other major currency pairs.
Riskoff

HOT INFLATION DRIVING USDJPY CRAZY!With inflation running at decades high, USDJPY has been gaining a lot of momentum in the past few weeks driven by the FED's outlook on hiking rates. With the WAR between Russia & Ukraine contributing hugely to the already spiking inflation across the globe, the FED would probably be inclined to tame this by raising interest rates. But what is the FED's latest thinking and outlook would likely be known this week.
With that said, both USD & JPY are safehaven currencies! With the development that's going on currently, the fundamentals are in favor of the USD here as the inflation fears is driving up the value of the greenback. Here on the main monthly chart, we can clearly see the price might meet a strong multi-month descending trendline resistance located at 118.500 area. From here onwards its in the FED hands directly as to what they plan to do to tame this hot inflation. Shall the FED decides to hike rates this year numerous times then we can expect this resistance to clear easily and the price can head towards the 120.000 psychological resistance with ease in the coming weeks and possibly higher in the future. On the other hand if the FED does not deliver, this resistance might hold and the prices might start heading lower.
All in all this week might set the course as to where this pair might be headed in the future.
Cheers, I hope you find this insight helpful. Please LIKE & FOLLOW for more insights on major currencies pairs.

Safe Haven Inflows Still Lifting Gold (For Now)Ukraine woes still weigh on global markets and although gold has retraced significantly, it is still hanging onto the high 1900's. Positive news is incoming as we compose this thread including Putin acknowledging "positive undertones" in Ukraine talks . We have given up the 2000's after touching highs at 2070. After finding support at 1982, we appear to be making a run for 2000 again, currently testing 1999 and hovering about 1995 or so at the time of this writing. The Kovach OBV is drifting downwards, suggesting a slight bear bias, but we have a lot of support levels below to buoy the price, including 1982, 1977, 1973, and 1964. It is doubtful we will slice through all of these, but watch the vacuum zone below to 1936. If we get a lift, then 2029, 2048, and 2070 are the next targets.

Bonds Test LowsBonds have smashed through relative lows in the mid 126's to find support at 126'00 which appears to be a technical and psychological level. We have added this as a technical level on the chart. ZN has been on a clear decline falling 3 handles from the 129's to the base of the 126's. The Kovach OBV is on a steady decline, but does appear to be leveling off suggesting we may find support here, or at least that the selloff may ease up. If not, the next target is 125'17. We do appear to be severely oversold and if we see a technical retracement into the bear trend we must break 126'11, where we are currently meeting resistance as confirmed by a red triangle on the KRI. After that, 126'19 and 126'28 are targets.

EURGBP: Any Impulse Move Would Meet Stern Resistance! EURGBP faces multiple upside resistance. The descending long term channel is still holding strong and any impulse up-move would likely be met with stern resistance. Fundamentally the EURO is under enormous pressure as well. Looking at the main weekly chart, we could clearly see that the major support break has already taken place that was held on multiple occasions in the past.
This support break could guide the prices to the next available low, located at the 0.80000 psychological level. The descending channel might just help to guide the price to 0.8000. Ideally the stop loss should be placed above this channel, preferably above 0.85000 psychological level.
Cheers, I hope you find this insight helpful. Please LIKE & FOLLOW for more insights on major currency pairs.

USDCAD: 1.29400 An Ideal Target Shall 1.28170 Is Broken!With OIL gaining traction everyday since the conflict began, the commodity linked/ OIL linked CAD has been seesawing against the in demand SAFEHAVEN USD. Based on the daily technical picture, we can see this statement backed by rising strong ascending trendline on our main chart.
USDCAD now would likely take a dig at its next target located at 1.29400. However before this happens, the daily candle must first close above 1.28170. This close would give us conformation that indeed the resistance has been broken and the price is ready to head higher.
Once this breakout is confirmed, a LONG trade can be executed based on ideal risk to reward ratio. With ideal RR being not less than 1, it would be advisable to wait for price to retrace and then execute this trade. The main chart would provide these details in deep as you observe it.
Cheers, I hope you found this insight helpful. FOLLOW & LIKE for more insights on major currencies pairs

USDCHF: Greenback Demand Could Finally Break The Range!This market has been ranging for quite some time now, even the start of the conflict between Russia and Ukraine did not have much impact on this pair!. The reason being simple enough, they are both safehaven currencies and in risk off markets they are both in demand.
However, since Switzerland is in EUROPE, the conflict would likely increase the demand for the USD more compared to the CHF. However saying that does not mean we should LONG the USD here, technical analysis should always be performed to increase the trade probability and quality.
Looking at the main weekly chart on USDCHF, everything is self explanatory based on technical perspective. The main point here is we have to wait for the weekly candle to close outside the upper range to confirm this breakout. After this a LONG trade can be evaluated based on the risk to reward ratio.
Cheers, I hope you found this insight helpful. Please LIKE and FOLLOW for more insights on other major currency pairs

AUDUSD: Await Retrace Before Going LONG! 0.75000 The TargetWith weekly candle breaking out from the descending channel, the price is ready to target the next high at 0.75000. The price also formed good support at 0.70000 area with RSI indicating a bullish divergence!
With that all said, it is advisable to wait for the price to retrace at the desired level and then execute a LONG trade. Trade can be invalidated if 0.75000 is HIT first. To get a clear picture have a look at the main chart.
Cheers

EURGBP: More Pain Ahead For The EURO ? With Risk OFF mood especially hitting both EUR & GBP hard, it is well known that the common shared currency EUR has more painful future compared to the GBP!
Here we look at the weekly chart that might support our view on this. First and most important step would be for the weekly candle to close below 0.82900 major support. By doing so, it would ensure a major long term support break and thus opening door to the next support that lies at 0.8000 region. After the break is confirmed, a short trade can be evaluated based on the risk to reward and executed.
CHEERS

UPTREND RESUMPTION: USDJPY LIKELY TO BREAKOUT FROM CONSOLIDATIONSince COVID-19 crisis eased around the globe from last year, we have seen a RISK ON mood in the markets thus propelling USDJPY to its recent highs! However at the moment the crisis between Russia and Ukraine has given this pair an excuse not to go higher. The safehaven status of the JPY is preventing this pair from heading higher and therefore we can assume its just consolidating at the moment.
With both USD & JPY being SAFEHAVENS in this scenario, we can expect the USD to win here. The reason being the FED is continuing to hike interest rates and inflation is at all time high. The tightening OIL supply also would just add to the inflation woe, thus putting pressure on FED to keep track on raising rates.
SIMPLY ON TODAY'S TERMS, THE INTEREST RATE DIFFERENTIALS BETWEEN THESE TWO SAFEHAVEN PAIRS WOULD LIKELY CAUSE USDJPY TO BREAKOUT AND HEAD TOWARDS THE LIKELY LONG TERM TARGET OF 118.000 LEVEL
CHEERS

[Teacher-ETF]-XAU continues raising above the uptrend line1\At the chart of H4, xauusd continues raising above the uptrend line.
2\Risk aversion supported the rise in prices
3\If the price breaks out 1880,it means that maybe enter a bearmarket.

A pullback before the next drop! The target of 1,1160 was completed and price went even lower. It's time for the next one!
Before that though, we should wait for the pullback which could reach the levels around 1,1290.
We could look for a possible reversal there and use that as our entry.
This is totally possible to happen in the beginning of next week,
which means that during today we should see the pullback and therefore we shouldn't rush to enter any trades.
Everyone who has made some profit this week should now reduce their lot size and maybe even withdraw some profits before continuing!
We're looking for another entry with targets below 1,1110!

EURUSD progress - sales continueWe have a breakout of 1,1290 and the target of 1,1160 is getting closer.
Everyone who entered short around the sell zone, could now move their stops to breakeven.
In case of a pullback and re-test of these levels we can also look to add to our position or open one, if you're still not in.
This setup won't be valid if price breaks above 1,1370!

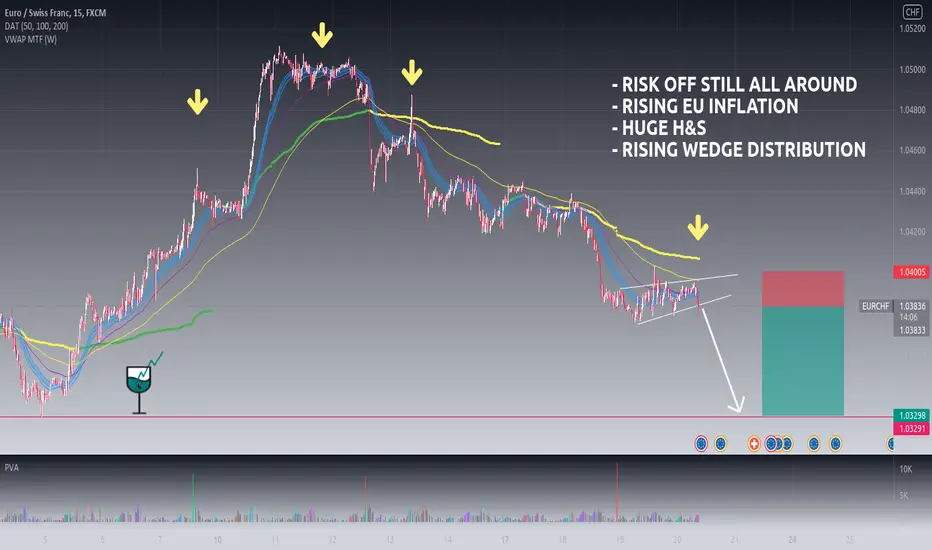
RISK OFF Markets Could Make EURCHF HIT PARITY!With the RUSSIAN-UKRAINE crisis developing day by day, the markets are quite worried and thus are in the RISK OFF mood. All the safehaven currencies would likely appreciate in the coming weeks against the EURO. However the most sensitive EURO pair in this scenario would be the EURCHF. The crisis would likely make CHF appreciate more and more in the coming days/weeks. Even if the SNB tries to intervene to support its currency, we could still see the sellers winning!
TECHNICAL ANALYSIS
PARITY is the real target here for EURCHF! For this to happen, we need the weekly candle to break the 1.02500 mark, after that a SHORT trade can be taken based on the appropriate 1:1 risk to reward ratio. The descending monthly trendline or 1.05000 would ideally likely act as dynamic/ horizontal resistance respectively to guide the price to parity

Bearish AUDCHF 4hLooking for a short position on the risk on/risk off pair. With the current market sentiment in securities, I believe the big boy trader will we looking for a safe haven. The aussie's correlation to gold is another factor in why I'm selling the AUD. So entry @ 0.6543 , both higher and current timeframe supertrend's are sells and the stoch is the overbought zone. TP1 @ .6444 zone and TP2 @ .6343 zone.

EURCHF SHORT OPPORTUNITY ON DOVISH ECB & TECHNICAL CONFIRMATIONSentiment/Fundamental insight:
German Producer Prices Rise 24.2% Y/Y Strongest YoY Increase Since The Survey Began In 1949
ECB’s Lagarde: No Reasons For Us To Act In The Same Way As The U.S. Federal Reserve
ECB’s De Cos: No Interest Rate Increase Expected In 2022 | Speaking on Spanish TV
Risk-off market will keep CHF as save heaven currency strong
We are still hold very bearish bias on all Euro pairs.
UK100 H4Identifying a reversal, we have 2 patterns here. First the double top that occured as price failed to break the all time high, along with a breakout of the rising channel. Watching the lower timeframe for slight retracements & a bearish continuation.


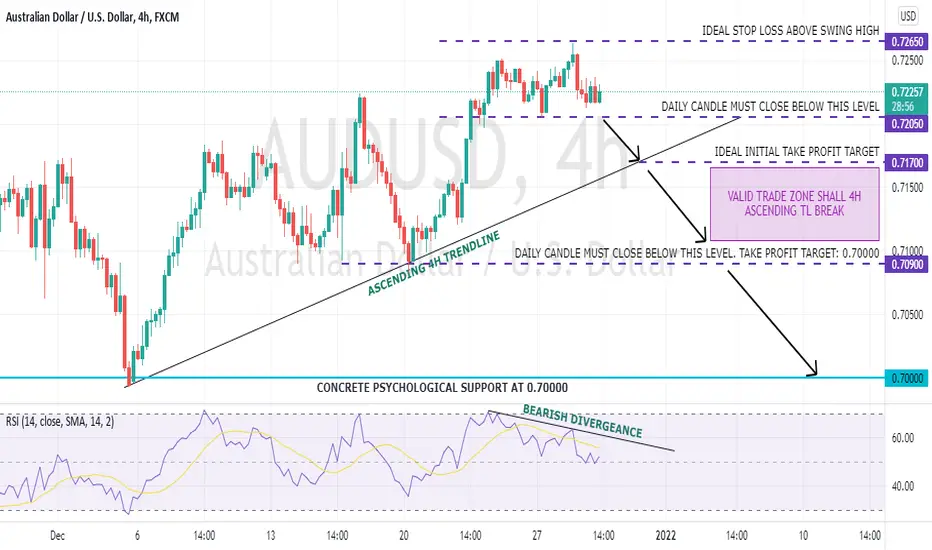
AUDUSD: Be Cautious Going Short! Multiple Resistance In The WayBearish RSI divergence on 4H charts. Is the price loosing momentum? is there consolidation ahead?
Well, we should NOT expect the price to HIT 0.7000 straight away if the ascending 4H trendline breaks! The reason being simple, THERE ARE MULTIPLE RESISTANCE PRESENT IN THE WAY UNTIL WE REACH 0.70000 LEVEL! Just observe the chart and you would notice these obstacles. To trade this opportunity with extreme caution, it is advisable to break and trade. Focus on each individual level breach and trade accordingly.
There is a risk that the price might reverse from any of these levels should the trader decide to take profit in one go at 0.7000. So breaking and trading on each individual level breach might be the best action a trader could execute in such conditions. Just observe the chart, no further explanations is needed here for now.
Cheer, I hope you found this insight helpful & Happy Holidays
BTC short-medium term Bearish trackingBINANCEUS:BTCUSD
# Note: This is not financial advice, nor am I a financial advisor
Looking at some broad market conditions:
* Unwinding risk at EOY to close out gains at funds
* Massively over-valued market run for equities and crypto
* High levels of leverage across markets (dipping from crypto to equities and equities to crypto)
* Covid uncertainty
* Fed tapering
* Fed announcement of rate increases 3x in 2022
* Higher Volatility
* Failing to create a new higher high and a double-top back in Nov.
* Risk in Chinese real-estate markets (usually summated by "Evergrande" story...the Countrywide of 2021)
* Hedge Fund closures
* Risk to supply chain causing ripple effects to markets
* Inflation (ie. massive increases in money supply, which is loaned out at stupidly low rates)
* Continued and increased guidance around risk and leverage to institutional investors
Long positions in crypto started to take off right around the trough of the 2020 pandemic shutdown. As we've continued through the pandemic, broad markets have continued to go up in value along with PE multiples, inflation, and more recently volatility is at all time highs, along with all the major indexes. Since mid November, we've been seeing weakening buying power at the levels we're at. Investors and Funds, both, are trying to either reposition for a crash or they're trying to get out of positions to shore up P/L by End of Year (either to meet commitments to investors, set up the ideal tax scenarios, or wanting to offset losses on bad short positions).
BTC can be seen as more or less the index/guideline of the broader crypto markets as it has the largest valuation and marketcap of other coins AND most coins tend to directly follow movements of BTC. In the short term, it looks like there's sell pressure right around current levels, but a sustained increase above the resistance line (ie. close above the line and confirm the next candle above the line as breakout, there are additional upside risks ($50k barrier again, most of the SMAs aside from the 200-day SMA, which is offering support right now), and being below the Ichimoku cloud).
Also, we're trading in a bearish channel right now, which further supports the thesis that downside risk continues.
There is a lot of money from Wall Street being used to extend positions and make some quick cash to fill margin accounts, but it appears that the buying has worn off for a while. As they unwind positions and try to reduce their risk exposure with the traditionally crazy end of year cycle that funds work on (they get paid on Dec. 31 of each year), we're going to see continued decline through December, with maybe another upside rally before EOY, but should still fail to exceed significant resistance barriers. The key level to watch will be $50k, which is a key psychological barrier, along with other broad market indicators (inflation, QE, covid, interest rates, etc.).
Targets:
$45k next significant support
$38k-40k if above support fails
$30k if the call continues below the 38k buy zone
~$20k if the 30k zone doesn't hold everything off
I'm not short on BTC, but I'm looking to average in to BTC starting around $30k. If I had a net long position of BTC or WBTC (on an ETH blockchain), I would be taking up a small short position to play the swing down right now. I am doing this with ETH, however, but the price levels are different and that is a different position to discuss.

USDJPY UNLIKELY TO BREAK 112.000 BARRIER! Here is WHYA very interesting pair to trade during this ongoing pandemic, certainly USDJPY has caught the eye of many traders as both currencies acting as SAFEHAVEN. However in RISKOFF mood, the advantage certainly lies with the JPY, as the SAFEHAVEN status makes it appreciate against various counterparts such as the AUD, NZD, CAD, EURO, GBP. In the case of USD and CHF, the JPY has a bit of tussle appreciating since all are considered SAFEHAVEN assets. Looking at the bigger picture, in the RISK OFF markets the JPY certainly appreciates against the USD. For example since the pandemic began, we saw the JPY strengthen against the USD and fall to levels low as much as 105.000
In the RISKON markets, there is no doubt that the JPY weakens against various counterparts, but mostly against the USD. For example, when the global population started being vaccinated slowly, the signs of recovery in the USDJPY was quite evident, as the pair inched closer to 116.000 from lows of 105.000. A QUITE BIG RISE compared to other currencies paired with JPY.
CURRENT MARKET MOOD: SEEMS TO BE RISKOFF AND RISKON. BUT PARTICULARY SKEWED TOWARDS THE RISKOFF AS THE OMICRON FEARS GATHER PACE
Its festive season and the spread of the new variant would likely make the cases skyrocket, however as many are already vaccinated and boosters shots being administered, we should NOT expect much panic such as the one that was caused by the DELTA variant!. There are other several reasons behind to support this statement
HERD IMMUNITY: since the pandemic began and up until now, the whole population has likely already achieved natural immunity and/or acquired immunity. Even as the new variant arise, our immune system are already equipped to fight off the virus
DEATHS HAVE BEEN VERY LOW: comparing the fatality that delta variant was causing, so far if you observe the number of new omicron cases, the fatality is very very low. This is because of the HERD immunity.
COVID 19 IS HERE TO STAY: Just like the COMMON COLD, COVID19 is here to stay with us. as it mutates and our immune system has also been equipped to fight off new strains. the COMMON COLD and COVID 19 are both classed from the same family of CORONAVIRUS. therefore the world is learning to deal and learn how to live with COVID 19.
THE WORLD WANTS TO RETURN TO NORMAL: People are tired of lockdowns and as per the above point, are willing to live with the virus. be it using vaccines more often or just their natural immunity function. As such major financial banks are already predicting the economic recovery in 2022 and beyond
GETTING TO THE POINT
Current market mood is mixed, that is why it could be seen that USDJPY is ranging after falling sharply on the news that south Africa has detected a new variant. There is no doubt that this festive season would make the new cases sky rocket, however as looking at all the above points, mainly the vaccines and immunity, we can expect the fatality rate to be much much lower compared to the havoc that DELTA variant caused.
Looking at the main chart, the festive season would likely cause the USDJPY price to HIT 112.000 or 113.000 area which is the lower end of the channel as the markets panic and enter the RISKOFF MOOD. But as usual the HERD IMMUNITY AND VACCINES BOOSTER ROLEOUT, would make this less threatening and markets might finally realize this and enter in RISKON mood. This would make the USDJPY price rise and possibly HIT 118.000 in 2022. However the covid 19 is highly unlikely to cause markets to enter in a long term RISKOFF mood, therefore we should expect this channel to hold and guide this pair steadily towards the 118.000 mark in 2022.
In short this pandemic has caused the markets to be so cautious, however looking at all this every large DIP in USDJPY should be seen a buying opportunity.
CHEERS AND THANKS. HOPE YOU FOUND THIS INSIGHT HELPFUL

USDJPY...The Stuff of Nightmares....So I'll cut to the chase, as we may not have much time.... USDJPY Signaling Major Risk Off move, we've only seen the beginning of the "Blood in the streets" "Buy the Dip" moment, IMO.
Take profits, be safe. Protect against Risk Off/Liquidity events, in these globally connected markets...they can cascade quickly, biblically.
4 previous times I've had this signal (it's not related to any indicator on the chart, so don't look for it there). The 4 signals were all correct, and their avg dump to the downside was 970ish pips ( I rounded ). Projected from our current Top....it's a beautiful ICT style PDArray from an area of Premium, to a nice Discount accumulation (tbd at that point).
As always, practice solid risk management, and good luck trading.

DAX Sells-Off As Markets Are In Risk-Off SentimentHello traders and investors!
Markets are in risk-off mode as the media is spreading fear about the new covid variant. But everything is maybe just too pessimistic if we consider there are no deaths and no hospitalization for a new variant! However, markets do not like uncertainty so we are seeing a sharp sell-off on stocks, even commodities are coming down which is making a dollar, jpy and chf very strong. DAX is coming down but into some support at around 15k with five waves down, so rally can be coming in three waves. Resistance is at 15500/15450, where a new sell-off may show up, but only once we have an a-b-c rally.
All the best!
Disclosure: Please be informed that information we provide is NOT a trading recommendation or investment advice. All of our work is for educational purposes only.
