Investment Grade VS High Yield AMEX:LQD is meeting the demand zone here. Looks like risk appetite will start to cool down from here. Flight to safety is starting to show signs.
With all the private credit out there I don´t think AI is the go to at this point in time. Gold is likely to be benefiting from this aswell as creditworthy companies.
High beta stocks is at a danger zone from my perspective.
BOJ´s rate hike could be the trigger on friday.
As always. This is not a financial advise. Always do your own research and investment decisions.
Riskon

Head & Shoulders - IBOXX & Investment Grade Corporate Bond ETFWhen things like investment grade bonds looks top (ish). That´s when you know it´s time to really start thinking about exiting. To me this is another sign of a bubble.
Investment grade is supposed to be the most safest bets after treasuries.
The BOJ will decided the markets faith on friday. Most likely the spreads of the US & Japan 2 year yields will come closer to equilibrium and that could very well trigger the carry trade.
Im on high alert this time around. Im scaling down on risk and will watch what happens on friday.

FireHoseReel | Crypto Cap Rising TOTAL Signals Risk On Mode🔥 Welcome FireHoseReel !
Let’s explore the latest TOTAL market setup.
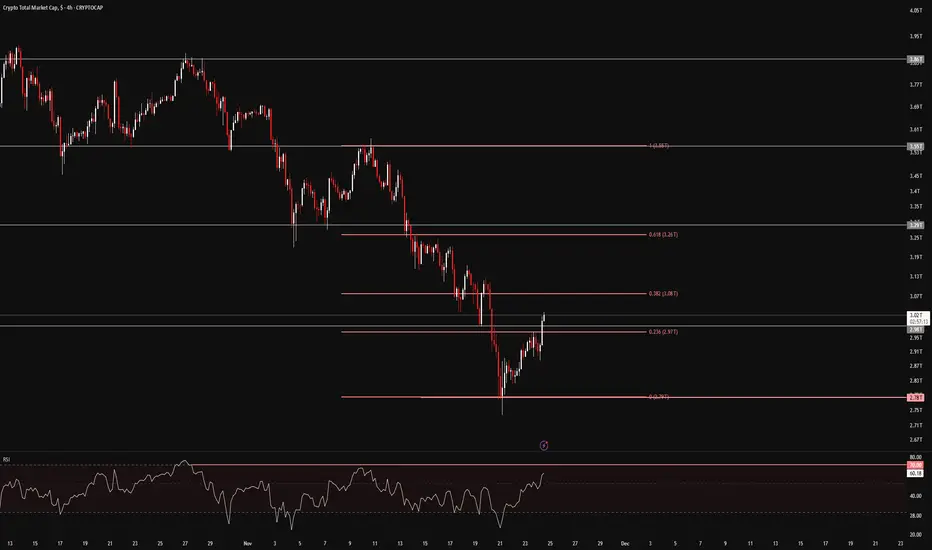
👀 TOTAL – 4H Timeframe Analysis
On the 4-hour chart, TOTAL shows the overall inflow of capital into the crypto market.
Price has successfully broken the 23% Fibonacci retracement level and is now moving toward the 38% zone.
If the 38% level breaks, traders who entered from lower supports can safely add to their position.
📊 RSI Momentum Check
The RSI has crossed above its previous high and has already moved above the 50 level, showing growing bullish momentum.
The next major RSI resistance sits around 70, which aligns perfectly with the 38% Fibonacci level, creating a strong confluence zone.
✔️ Correlation With Bitcoin
TOTAL shows a clear positive convergence with Bitcoin’s chart—both have built strong support levels and are pushing upward.
Institutional investors appear to have formed a solid accumulation base in this area, and the latest confirmations indicate this zone is becoming a reliable bottom.
With capital flowing into the crypto market and Bitcoin gaining momentum, the next moves across the market could be very powerful.
🛞 Risk Management & Disclaimer
Please remember to always use proper risk management and position sizing. Nothing in this analysis is financial advice. The market can change quickly, so always trade based on your own strategy, research, and risk tolerance. You are fully responsible for your own trades.
Fear & Greed Index — Rebuilt as a Macro Oscillator for CryptoThe Fear & Greed Index is everywhere — a popular way to gauge market sentiment.
But it's usually just a mix of volatility, momentum, and social buzz...
📉 Not exactly macro.
This script is a technical reinterpretation of the Fear & Greed concept — but grounded in real, measurable economic behavior .
🧠 The Core Idea
This indicator is powered by the Copper/Gold ratio , a time-tested signal used by economists and institutional traders to track macroeconomic cycles:
- 🟢 When Copper outperforms → the economy is likely expanding → risk-on → Greed
- 🔴 When Gold outperforms → the economy may be contracting → risk-off → Fear
Copper represents industrial growth , while Gold signals defensive capital flows .
We track this ratio over time using a Z-Score oscillator to identify when sentiment is statistically stretched in either direction — highlighting moments of macro-level greed or fear.
📊 Why It Matters for Crypto
Crypto doesn’t live in a vacuum.
It's highly sensitive to the broader risk environment.
This oscillator gives you a macro lens to help:
- Anticipate bullish or bearish shifts in crypto markets
- Avoid common emotional traps at sentiment extremes
- Build entries or exits around macro confluence zones
It doesn’t tell you when to buy or sell — it tells you when the market context is shifting .
🔧 How to Use It
- Watch for the Z-Score entering > +2 (Greed) or < -2 (Fear)
- Use it to confirm broader risk-on/off behavior
- Combine with BTC or ETH price for potential lead/lag relationships
- Customize the tickers to test other macro pairs (e.g. SPX/VIX, BTC/DXY)
📈 Built with Pine Script v6
🔍 Default Tickers: CAPITALCOM:COPPER vs TVC:GOLD
📦 Fully customizable inputs, clean visual design, alert-ready
💡 Use this to trade with context — not emotion.
If you found this useful, give it a like and drop your feedback or improvements below 👇

$GOLD is COOKED! Rotation into $BTC Soon!!MARKETS ARE SIGNALING RISK-ON 🔥
TVC:GOLD is so unbelievably COOKED 👨🍳
3 Black Crowes printed on the Daily, with a decisive close below the 20MA 🗡️
Waiting on the final nail in the coffin to close below the DANGER ZONE ~$3,900 where we will then see GOLD retest the 50MA along with the 50% Gann retrace $~3,750 ⚠️
I very much expect the rotation into CRYPTOCAP:BTC soon 👑

GBPJPY Eyes 203.000 as Risk-On Mood Weakens YenHey Traders,
In tomorrow’s trading session, we’re monitoring GBPJPY for a buying opportunity around the 203.000 zone. The pair remains in a broader uptrend and is currently in a correction phase, approaching the 203.000 support and resistance area, which aligns with the prevailing trend structure.
On the fundamental side, easing tensions between the US and China are fueling a risk-on environment, typically leading to weaker demand for safe-haven assets like the JPY. This sentiment shift could support further upside in GBPJPY if buyers step in at this level.
Trade safe,
Joe

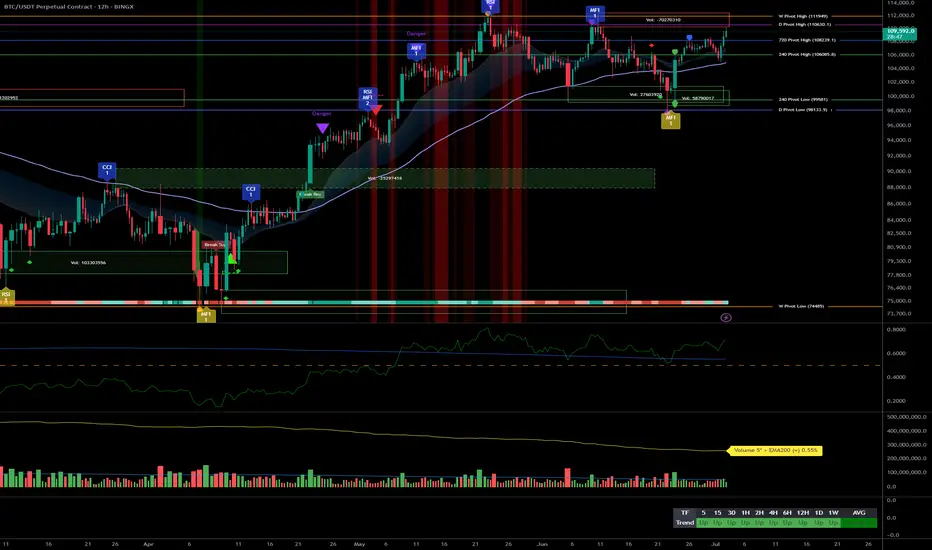
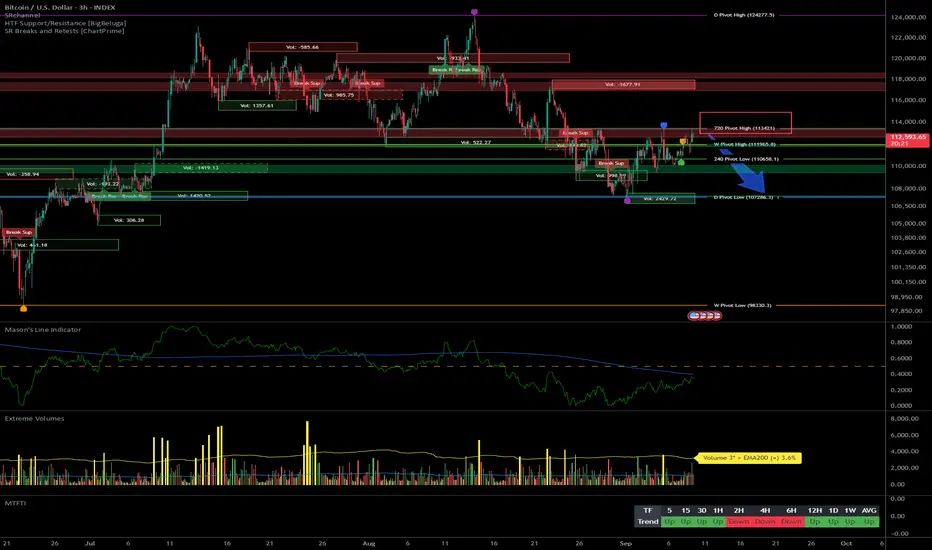
BTC: Range below 114k — breakout soon or fresh rejection?__________________________________________________________________________________
Market Overview
__________________________________________________________________________________
BTC is range-bound below 112,600–114,000, with improving intraday momentum but a firm HTF supply shelf overhead. The broader backdrop stays constructive while supports hold, pending a liquidity catalyst.
Momentum: Range with a bullish skew 📈 if 112,600 breaks and holds.
Key levels:
- Resistances (12H–1D): 112,600–114,000, then 116,000.
- Supports (2H–1D): 111,000–110,300, then 108,600.
Volumes: Normal to moderate (1H–4H), acting as an amplifier on rejections/breakouts.
Multi-timeframe signals: 1D Up, while 12H/6H/4H remain Down; intraday (2H/1H/30m/15m) Up but capped under 112,600–114,000.
Risk On / Risk Off Indicator: Mixed read (NEUTRAL SELL vs NEUTRAL BUY) → overall neutral stance, waiting for flow confirmation; this aligns with a range rather than a trend.
__________________________________________________________________________________
Trading Playbook
__________________________________________________________________________________
Strategically, the dominant trend is neutral below 112,600–114,000; stay opportunistic: buy a clean breakout or tactically sell a clear rejection.
Global bias: Neutral with buy-on-breakout skew above 112,600; key invalidation if 1D closes below 108,600.
Opportunities:
- Breakout long: Close + retest above 112,600 targeting 114,000 then 116,000.
- Buy the dip: 111,000–110,300 (or 108,600) on a bullish 2H–1D rejection.
- Tactical short: Rejection at 112,600–114,000 aiming 111,000 then 110,300.
Risk zones / invalidations:
- Below 108,600 on a 1D close: HTF structure weakens → risk of acceleration toward 106,800.
- Above 114,000 on 4H/1D: invalidates range shorts and opens 116,000.
Macro catalysts (Twitter, Perplexity, news):
- FOMC and liquidity tone (potential QT end) as key driver.
- US equities at ATHs: supportive risk backdrop while it lasts.
- BTC spot ETF flows mixed: uneven tailwind, needs confirmation.
Action plan:
- Entry: 112,650–112,900 (clean break/retest on 1H–4H).
- Stop: below 111,900 (breakout play) or below 110,300 (dip play).
- TP1: 114,000; TP2: 116,000; TP3: 118,500 (if extension).
- Approx R/R: 1.8R to 2.5R depending on stop and scaling.
__________________________________________________________________________________
Multi-Timeframe Insights
__________________________________________________________________________________
Overall, HTFs stay rangey under a stacked resistance shelf, while LTFs press into the 112,600 pivot.
1D: Uptrend but capped beneath 112,600–114,000; a clean reclaim/hold would unlock 116,000.
12H/6H/4H: Down/corrective; countertrend bounces likely capped at 112,600–114,000 absent confirmed closes.
2H/1H/30m/15m: Rising structure with higher lows; continuation on break & hold of 112,600, otherwise rotation risk toward 111,000–110,300.
Major divergences: Mixed 1D Up vs 12H Down; raises the bar for confirmation (retest + volume) on any breakout.
__________________________________________________________________________________
Macro & On-Chain Drivers
__________________________________________________________________________________
Macro/on-chain is mixed: potential risk-on via liquidity, but demand signals remain cautious below resistance.
Macro events: Fed QT reportedly nearing an end (near-term), risk supportive; US indices at ATHs; FOMC next → primary liquidity tone driver.
Bitcoin analysis: Pinned between the 200D (~108.5k) and STH cost basis (~113.1k); a daily close above ~113.1–116.0k unlocks higher; loss of ~108.5k risks 100–101k.
On-chain data: Below STH cost basis, demand fatigue; elevated LTH distribution; cautious options → need flow impulse to validate a breakout.
Expected impact: Constructive technical bias contingent on a confirmed break; without liquidity impulse, the range can persist.
__________________________________________________________________________________
Key Takeaways
__________________________________________________________________________________
Range beneath 112,600–114,000 with improving intraday but HTF supply still in control.
- Trend: Neutral, bullish if a clean break above 112,600; key supports at 111,000–110,300 and 108,600.
- Setup: Break & retest > 112,600 toward 114,000/116,000; alternative is disciplined dip-buys on bullish wicks at 110,300–108,600.
- Macro: FOMC + liquidity tone (potential QT end) is the main trigger.
Stay patient: wait for confirmation (close + retest + volume) and let flows lead risk. ⚠️
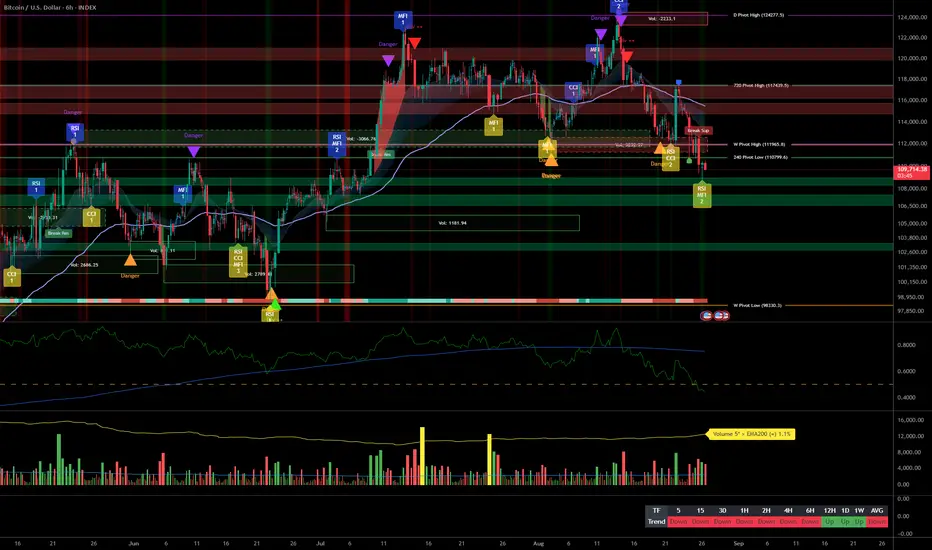
BTC: Risk-off range below 110k, focus on 106.5k/105k/103k__________________________________________________________________________________
Market Overview
__________________________________________________________________________________
BTC is range‑bound with a cautious tilt: sellers cap 110k while 106.5k keeps holding. The 12H pressure remains down even as higher timeframes stay resilient.
Momentum: Range with a bearish tilt 📉 — multiple rejections below 110k and repeated defenses at 106.5k; 12H risk filter points Down.
Key levels:
• Resistances (HTF→Mid): 109,800–110,200 (supply), 111,500–112,000 (supply), 112,800–113,200 (HTF supply).
• Supports (HTF→Mid): 106,500–106,700 (pivot), 105,200–104,900 (6H floor ~105,013), 103,200–103,500 (2H/4H cluster + D pivot).
Volumes: Moderate on 30m–4H; no outsized catalyst.
Multi-timeframe signals: 12H/6H/4H/2H/1H trending down, 1D/1W up; below 110k, risk of 106.5k then 105k retests unless price reclaims 110.8k with volume.
Risk On / Risk Off Indicator: NEUTRAL SELL — confirms the cautious bias and the cap near 110k.
__________________________________________________________________________________
Trading Playbook
__________________________________________________________________________________
Strategic stance: range market with a risk‑off tilt; favor tactical fades at supply and only take defensive longs on validated floors.
Global bias: NEUTRAL SELL below 110k; main invalidation: daily close > 110,800 with volume and follow‑through.
Opportunities:
• Defensive long at 105,200–104,900 if wick + ≥2H reversal close; target 108k/110k.
• Secondary long at the 103,200–103,500 cluster on clean 2H/4H signal; add if 106,700 is reclaimed.
• Tactical short on rejection at 109,800–110,200 (or 111.5–112k) aligned with 12H Down; add on breakdown of 106,500 with volume.
Risk zones / invalidations:
• Sustained break < 106,500 invalidates an immediate bounce and opens 105k then 103k.
• Impulsive reclaim > 110,800 invalidates tactical shorts and unlocks 112–114k.
Macro catalysts (Twitter, Perplexity, news):
• Cautious liquidity into FOMC week; CPI eyed as a decisive catalyst.
• Soft 7‑day BTC spot ETF flows (risk‑off tone), making rallies fragile under 110–112k.
• Potential geopolitics/energy headline risk that can amplify moves at key levels.
Action plan:
• Long Plan (105k): Entry 105,200–104,900 / Stop ~104,500 / TP1 108,000, TP2 109,800–110,200, TP3 111,500–112,000 / R:R ≈ 1.8–2.5.
• Long Plan (103k): Entry 103,200–102,900 / Stop ~102,400 / TP1 106,700, TP2 108,000, TP3 109,800–110,200 / R:R ≈ 2.0–2.8.
• Short Plan (110k): Entry 109,800–110,200 / Stop 110,800 / TP1 108,200, TP2 106,700, TP3 105,200 / R:R ≈ 1.6–2.2.
__________________________________________________________________________________
Multi-Timeframe Insights
__________________________________________________________________________________
Intraday timeframes (≤12H) lean lower while 1D/1W remain resilient above key supports.
1D/1W (Up): Constructive structure, but 112.8–113.2 remains a HTF supply cap; bullish confirmation needs a reclaim >110.8k with volume.
12H/6H/4H/2H/1H/30m/15m (Down): Lower highs below 110k; 106.5k then 105k as key demand; breakdown of 106.5k risks acceleration.
Major confluences/divergences: Strong confluence around 103k (2H/4H cluster + D pivot ~103.5k) and a 6H floor near 105,013; the deeper 102k+ zone sits lower — high quality if reached.
__________________________________________________________________________________
Macro & On-Chain Drivers
__________________________________________________________________________________
Macro is in “wait‑and‑see” mode into FOMC/CPI and ETF flows stay soft, weighing on rallies under 110–112k.
Macro events: Markets cautious into FOMC and CPI; USD/liquidity guarded; geopolitics/energy risks can add volatility near key levels.
Bitcoin analysis: 7‑day negative BTC spot ETF flows (risk‑off backdrop); technical structure centered on 106.5k/105k/103k versus 110–112k supply.
On-chain data: Price below STH cost basis (~113.1k) and below the 0.85 quantile (~108.6k); elevated LTH distribution; put‑leaning options skew; higher IV — a defensive stance.
Expected impact: Technical NEUTRAL SELL bias intact; rallies likely faded unless volume improves and a >110.8k close confirms.
__________________________________________________________________________________
Key Takeaways
__________________________________________________________________________________
BTC remains range‑bound with a risk‑off tilt between 106.5k and 110k.
- Overall trend: short‑term neutral/bearish, HTF still constructive but capped by 110–112k supply.
- Most relevant setup: fade 109.8–110.2 or take defensive longs at 105k/103k only on ≥2H reversal signals.
- One key macro factor: FOMC/CPI week with soft ETF flows leaves rallies vulnerable without volume.
Stay disciplined: respect invalidations and wait for confirmation before leaning into a direction.
__________________________________________________________________________________

Bitcoin Market Analysis – October 20, 2025⚡️Welcome back to today’s Bitcoin analysis.
The trigger we discussed in the previous update has been activated, and the V-pattern we’ve been talking about throughout the week has finally formed, confirming the expected reversal structure.
🚀As mentioned earlier, the overall trend remains bullish, and once we see a clear stabilization above the 111,000 and 113,000 zones, it will serve as confirmation of our bullish continuation scenario.
📈The 111,000 zone could also provide another entry opportunity for those who missed the long setup around 107,000 — as long as the structure holds and buyers continue to defend this level.
🌕At this stage, it’s important to wait for fundamental confirmation.
If the broader market sentiment turns risk-on, Bitcoin could easily push toward new upside targets in the coming sessions.
---
> Disclaimer:
This content is for informational purposes only and does not constitute financial or investment advice. © DIBAPRISM
Larry D.Kohn

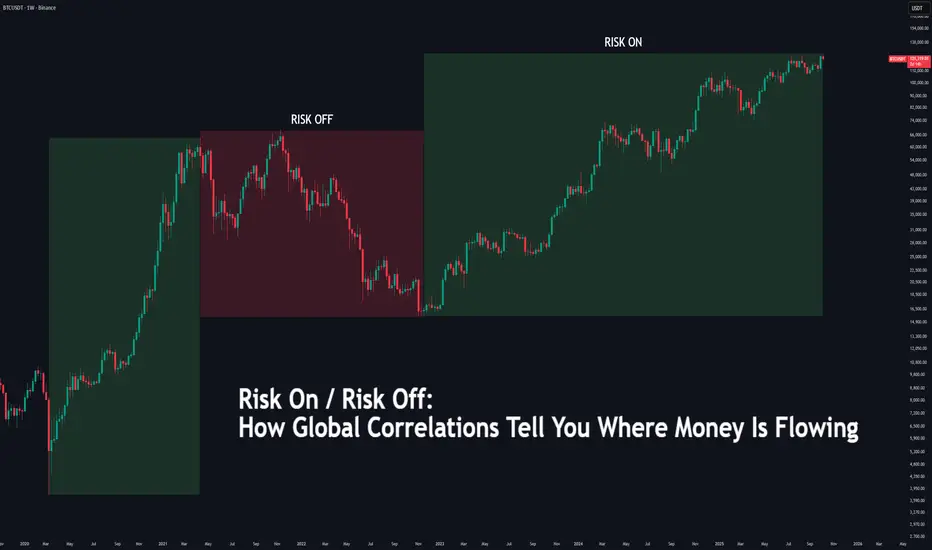
Risk On/Off: How Global Correlations Tell You Money Flow🔵 Risk On / Risk Off: How Global Correlations Tell You Where Money Is Flowing
Difficulty: 🐳🐳🐳🐋🐋 (Intermediate+)
This article is for traders who want to understand how global capital flow affects market behavior — from equities and crypto to gold and bonds. Learning to read “Risk On” and “Risk Off” regimes helps you anticipate big shifts before they hit your chart.
🔵 INTRODUCTION
Markets are not independent islands — they are connected by one universal force: liquidity flow .
When investors feel confident, they move capital into riskier assets like stocks and crypto — this is called Risk On .
When fear dominates, capital flows back into safety — bonds, gold, and the U.S. dollar — known as Risk Off .
Recognizing this rotation allows traders to align their bias with the flow of global capital rather than fighting it.
🔵 WHAT IS “RISK ON”
Risk On is a market environment where investors seek higher returns, volatility is subdued, and capital flows into assets with greater reward potential.
Typical Risk-On behavior:
S&P 500, Nasdaq, and other equities trend higher
Bitcoin and crypto assets outperform traditional markets
U.S. Dollar Index (DXY) weakens as money moves abroad
Bond yields rise moderately as investors leave safe assets
Gold often consolidates or declines
In simple terms: Money chases opportunity.
🔵 WHAT IS “RISK OFF”
Risk Off describes defensive conditions — fear rises, volatility expands, and liquidity seeks safety.
Typical Risk-Off behavior:
S&P 500 and risk assets decline
Bitcoin and altcoins drop sharply
DXY strengthens as investors move into USD
Bond yields fall as money enters treasuries
Gold rallies as a safe-haven hedge
In simple terms: Money runs to safety.
🔵 HOW TO DETECT RISK SHIFTS
Market regimes don’t flip instantly — they rotate through correlated behavior.
To identify the shift between Risk On and Risk Off, monitor key macro instruments together:
DXY (Dollar Index): Rising DXY = Risk Off sentiment, Falling DXY = Risk On.
SPX / NASDAQ: Strong uptrends = Risk On, persistent weakness = Risk Off.
BTC vs DXY: Inverse correlation; BTC strength with DXY weakness = liquidity expansion.
Bond Yields (US10Y): Rising = optimism, Falling = risk aversion.
VIX Index: Below 15 = complacent Risk On, Above 25 = fearful Risk Off.
🔵 THE GLOBAL LIQUIDITY CYCLE
Liquidity always moves in phases — expansion, acceleration, contraction, and reset.
Phase 1 – Liquidity Expansion: Central banks inject liquidity → Risk On begins.
Phase 2 – Overextension: Assets rally strongly, leverage increases, volatility stays low.
Phase 3 – Liquidity Contraction: Monetary tightening or policy shocks trigger Risk Off.
Phase 4 – Repricing & Reset: Markets bottom as new liquidity returns.
Understanding this rhythm helps traders avoid confusion when markets seem “irrational” — because they’re not, they’re simply rotating through the liquidity cycle.
🔵 USING RISK ON/OFF IN TRADING
Even technical traders benefit from recognizing global risk regimes.
By aligning with the dominant liquidity direction, setups gain higher probability.
Crypto traders: Use SPX, DXY, and VIX correlations to confirm momentum.
Stock traders: Track gold and yields to gauge investor confidence.
Forex traders: Trade USD pairs according to global sentiment.
Swing traders: Filter trade bias by checking the current global regime.
Tip: When correlations align (e.g., DXY up, SPX down, BTC down), expect trend continuation.
When they diverge, volatility or reversals are likely.
🔵 ADVANCED TOOLS TO WATCH
Global Liquidity Index: Track combined balance sheets of the Fed, ECB, BOJ, and PBC.
Stablecoin Supply (Crypto): Expanding supply = liquidity entering market.
Yield Curve (10Y–2Y spread): Falling = caution, Rising = recovery.
Funding Rates: Confirm risk sentiment via leverage buildup.
🔵 CONCLUSION
All markets are connected through liquidity.
Risk On and Risk Off regimes describe how that liquidity rotates between return and safety. By tracking global correlations — equities, bonds, gold, DXY, and crypto — traders gain a powerful macro filter to stay on the right side of momentum.
Liquidity creates direction. Correlation confirms conviction.
If you learn to read the global flow, your technical analysis will finally make sense in the bigger picture.
Do you track global correlations in your analysis? What’s your favorite Risk-On or Risk-Off indicator?
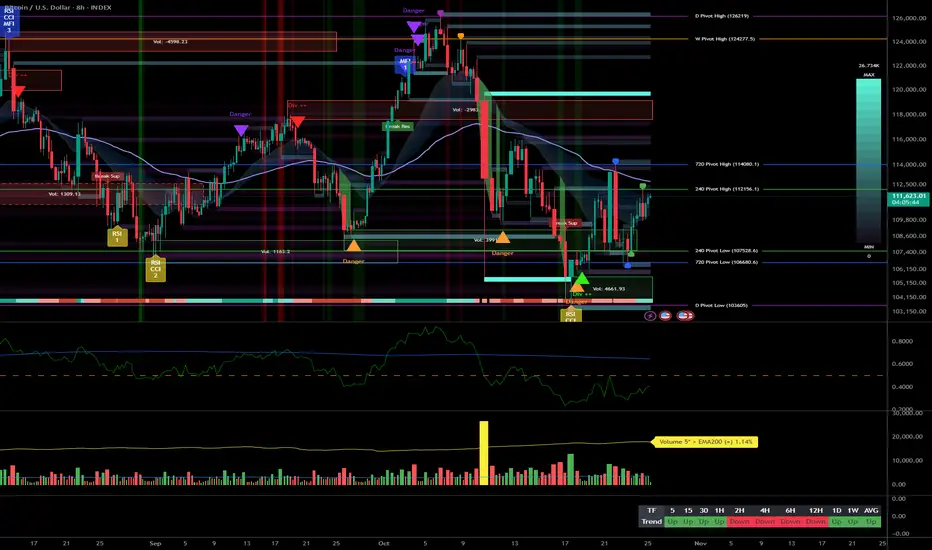
BTC: 120.6k under pressure — Reclaim 121.5k or 120k next?__________________________________________________________________________________
Market Overview
__________________________________________________________________________________
BTC is cooling below 124.5k–126.2k after the ATH, ranging inside 120.6k–124.5k. The HTF structure remains bullish while intraday dips toward a key execution pivot.
Momentum: 📉 Intraday corrective move within an HTF uptrend, probing the 120.6k pivot that will decide the next leg.
Key levels:
- Resistances (4H–W): 121.5k (4H/1H pivot), 124.5k–126.2k (W/ATH).
- Supports (1H–D): 120.6k (240 pivot), 120.0k (intraday psych), 117.0k (D pivot/high turned support).
Volumes: HTF normal; 4H–1H moderate; 30m–15m very high (execution catalysts).
Multi-timeframe signals: 1D/12H/6H in Up; 4H→1H correcting into 120.6k; 15m shows a tactical BUY, only valid if the pivot holds.
Risk On / Risk Off Indicator: Overall NEUTRE ACHAT — daily constructive, intraday neutral/contrarian — aligns with the HTF uptrend but requires reclaim above 121.5k to confirm.
__________________________________________________________________________________
Trading Playbook
__________________________________________________________________________________
Dominant trend is up but in a pullback: favor buys on reclaim above pivots; treat shorts as tactical with tight risk.
Global bias: NEUTRE ACHAT while holding/reclaiming 120.6k; major invalidation on a D close < 117k.
Opportunities:
- Buy the reclaim > 121.5k and hold, targeting 122.7k then 124.5k.
- Confirmed breakout above 124.5k (retest holds) toward 126.2k and beyond.
- Tactical sell on break/retest-fail of 120.6k or clean rejection at 124.5k–126.2k.
Risk zones / invalidations:
- Confirmed loss of 120.6k opens 120k then 117k (invalidates intraday longs).
- Break and hold > 126.2k invalidates tactical shorts.
Macro catalysts (Twitter, Perplexity, news):
- Record T-bill issuance (“Treasury Twist”) → potential liquidity headwind.
- Strengthening USD (DXY) → near-term cap on BTC topside.
- Bitcoin ETFs: sustained inflow streak (8 straight days) → tailwind for clean breakouts.
Action plan:
- Long (reclaim pivot): Entry 120.8k–121.2k after close > 121.5k / Stop < 120.6k / TP1 122.7k, TP2 124.5k, TP3 126.2k / R:R ~1.8–2.5.
- Short (counter-bias): Entry on close < 120.6k + failed retest / Stop > 121.5k / TP1 120.0k, TP2 118.8k, TP3 117.0k / R:R ~1.6–2.2.
__________________________________________________________________________________
Multi-Timeframe Insights
__________________________________________________________________________________
Overall higher timeframes remain constructive, while lower timeframes correct into a high-volume pivot.
1D/12H/6H: Uptrend above 117k; consolidation beneath 124.5k–126.2k. A clean daily close above 124.5k unlocks a run at the ATH.
4H/2H/1H: Corrective drift into 120.6k with moderate volumes; reclaiming 121.5k would be the first tell for a push to 122.7k then 124.5k.
30m/15m: Very high volumes at 120.6k; micro BUY (15m) only actionable if the pivot holds and 121.2k/121.5k are reclaimed on rising volume.
Divergences/confluences: Bullish confluence if 120.6k holds + daily Risk On / Risk Off Indicator stays supportive; bearish if strong sell volume appears below 120.6k without responsive bids.
__________________________________________________________________________________
Macro & On-Chain Drivers
__________________________________________________________________________________
Macro remains broadly risk-on, yet USD strength and liquidity headwinds could cap upside until technical reclaims materialize.
Macro events: Dovish-leaning FOMC minutes (cut bias), data delays (shutdown) → lower visibility; record T-bill issuance and a stronger USD → near-term headwinds.
Bitcoin analysis: Post-ATH consolidation 120k–124k; 117k holds as HTF support; BTC dominance elevated — consistent with “debasement” hedges.
On-chain data: Sustained spot ETF inflows (8-day streak); high share of supply in profit with contained realized profits; rising IV, neutral skew, call-tilt — constructive but more sensitive to shocks.
Expected impact: Institutional flows support the NEUTRE ACHAT bias if 120.6k holds and 121.5k is reclaimed; otherwise, USD + “Treasury Twist” favor a probe of 120k/117k on technical weakness.
__________________________________________________________________________________
Key Takeaways
__________________________________________________________________________________
Structurally bullish market, testing the 120.6k pivot with amplified intraday volume.
- Trend: bullish HTF; corrective intraday until 121.5k is reclaimed.
- Top setup: buy the reclaim above 121.5k toward 122.7k/124.5k; plan B is a tactical short below 120.6k toward 120k/117k.
- Macro: ETF inflows are a tailwind, while USD strength and the “Treasury Twist” temper upside without clean confirmations.
Be patient and let 120.6k/121.5k decide the next leg. 🔍

Breakout watch: buy >124,227, protect 121,585__________________________________________________________________________________
Market Overview
__________________________________________________________________________________
The market keeps a bullish drive but stalls beneath a dense HTF resistance band at 124,227–125,650, with intraday digestion. Buyers hold the advantage above 121,585; the next leg needs acceptance above 124,227.
Momentum: Bullish 📈, capped by 124,227–125,650; shallow pullbacks while 121,585 holds.
Key levels:
• Resistances (W/240): 124,227–125,650 (must clear)
• Supports (1H–1D): 123,300–123,000 (intra) • 121,585 (4H/12H pivot) • 117,971 (1D pivot)
Volumes: HTF normal; 6H/4H moderate; very high on 15m during 124.2k–125.6k tests (catalyst).
Multi-timeframe signals: MTF trend filter is up (1D/12H/6H/4H), but a confirmed acceptance >124,227 is required; intraday (2H/1H/30m/15m) ranging tight under R with volume spikes.
Risk On / Risk Off Indicator: NEUTRAL BUY — no directional thrust, consistent with a cautious bullish bias; breakout confirmation still needed.
__________________________________________________________________________________
Trading Playbook
__________________________________________________________________________________
Strategic stance: dominant uptrend into heavy resistance; favor “buy breakout / buy the dip” and only fade tactically on clean rejection.
Global bias: Cautious bullish above 121,585; key invalidation on a close below 121,585.
Opportunities:
• Breakout buy: Enter on acceptance >124,227 with rising volume; aim for 125,650.
• Dip buy: Buy 121,700–121,200 (around 121,585) if HTF structure holds.
• Tactical short: Fade 124.2k–125.6k on rejection wick + sell-volume expansion.
Risk zones / invalidations:
• A decisive break below 121,585 invalidates the bullish bias and opens 117,971.
• A 12H/1D close >125,800 invalidates rejection shorts.
Macro catalysts (Twitter, Perplexity, news):
• Strong US spot BTC ETF inflows — supportive of dip absorption.
• Near-term macro tape is light; gold firm and oil up keep the backdrop mixed.
• FOMC Minutes (Oct 8) could tilt the risk-on/off regime near 124,227.
Action plan:
• Breakout long: Entry 124,250–124,450 / Stop: close <124,200–123,650 / TP1 125,000, TP2 125,650, TP3 runner; R/R ~1.8–2.2.
• Dip long: Entry 121,700–121,200 / Stop: close below 121,585 / TP1 124,000, TP2 124,900, TP3 125,650; R/R ~2.0–2.5 on clean bounce.
• Fade short: Entry 124,200–124,700 / Stop: >125,800 / TP1 123,300, TP2 121,585, TP3 117,971; R/R ~1.5–2.0 on swift rejection.
__________________________________________________________________________________
Multi-Timeframe Insights
__________________________________________________________________________________
Higher timeframes stay bullish overall, while intraday frames consolidate beneath resistance with volume spikes acting as catalysts.
1D/12H/6H/4H: Uptrend off 108,709, pausing under 124,227–125,650; above 121,585, digestion favors continuation to 125,650 if acceptance above 124,227 materializes.
2H/1H/30m/15m: Tight range 123,000–124,300; very high volume on attempts into 124.2k–125.6k — a validated break with volume likely carries toward 125k/125,650.
Major divergences/confluences: Strong support confluence at 123,300–123,000 and 121,585; HTF volumes neutral vs. intraday high at R — the breakout needs flow confirmation to avoid a fake-out.
__________________________________________________________________________________
Macro & On-Chain Drivers
__________________________________________________________________________________
US spot BTC ETF flows remain the dominant driver, while the immediate macro calendar is light and the broader backdrop stays nuanced.
Macro events: Solid ETF inflows (ongoing streak), gold firm and oil higher suggest a mixed backdrop; BOJ cautious, EU eyeing looser fiscal rules, US housing softer; FOMC Minutes upcoming.
Bitcoin analysis: Institutional/ETP flows described as sticky, supporting dips and trend resilience; technically, validation above 124,227 is required.
On-chain data: STH cost basis ~111.6k defended; LTH distribution cooling; options OI reset with softer IV and more neutral skew — constructive backdrop.
Expected impact: Bullish bias maintained if a confirmed breakout above 124,227 occurs; otherwise, expect a 123,000/121,585 range.
__________________________________________________________________________________
Key Takeaways
__________________________________________________________________________________
The market is bullish yet compressed beneath 124,227–125,650, requiring a confirmed breakout to re-ignite momentum.
- Overall trend: bullish/constructive above 121,585.
- Most relevant setup: confirmed break >124,227 with volume toward 125,650; alternatively, buy the dip at 121,585 on rejection.
- Key macro factor: strong US spot ETF inflows aiding dip absorption.
Stay nimble: demand breakout confirmation via closes and volume; otherwise, manage the range and protect risk. ✍️

BTC: Defend 111.6k, confirm > 113,050 → 114,472__________________________________________________________________________________
Market Overview
__________________________________________________________________________________
BTC sits on a defended HTF support while an intraday ceiling caps any extension. The bias stays cautiously bullish as long as 111,800–111,600 holds, but a confirmed reclaim above 113,050 is still needed.
Momentum: Fragile bullish range 📈 — buyers hold 111,800–111,600, yet 113,050 keeps a lid on price.
Key levels:
- Resistances (2H–1D): 113,050 (intra cap), 114,472 (HTF pivot), 116,200–117,300 (extension).
- Supports (HTF→intra): 111,800–111,600 (major 240 PL), 111,150 (intra), 107,286 (D PL).
Volumes: Very high on 30m/15m (potential reversal fuel), normal on 4H–1D.
Multi-timeframe signals: 1D/12H/6H/4H/2H trend Up; 1H still Down; 30m/15m trying to turn — reclaim of 113,050 with persistence is the key.
Risk On / Risk Off Indicator: NEUTRAL BUY (moderate risk-on) — supportive but not decisive; on very short TFs (15m) it tilts toward STRONG BUY if the breakout confirms.
__________________________________________________________________________________
Trading Playbook
__________________________________________________________________________________
Core stance: favor defensive buys at support or strength buys on confirmed breakouts, with a clear invalidation below 111,600.
Global bias: Moderately bullish (NEUTRAL BUY) while 111,600 holds; invalidation on a confirmed close < 111,600.
Opportunities:
- Buy-the-dip: Buy 111,800–111,600 on clean rejection + confirmation; target 114,000 then 114,472.
- Breakout buy: Buy a reclaim > 113,050 with a held retest; add > 114,472 if volume expands.
- Tactical sell: Fade clean rejections at 113,050–114,472 or a confirmed break < 111,600.
Risk zones / invalidations: A loss of 111,600 opens 111,150 then 107,286; failure to reclaim 113,050 over 2–3 bars weakens the bullish case.
Macro catalysts:
- Fed (25 bps cut, dovish tilt): supportive backdrop, but price must confirm.
- Spot ETF flows softening: headwind for breakouts near resistance.
- Geopolitics (Ukraine/Syria): headline risk — demand confirmation before sizing up.
Action plan:
- Entry: 111,850–111,600 (confirmed rejection) or > 113,050 (break & retest).
- Stop: below 111,150 (dip-buy) or below 112,400 (post-break).
- TP1/TP2/TP3: 114,000, 114,472, 116,217 (leave a runner toward 117.9k if momentum builds).
- R/R: ~1.8–2.5R depending on entry and breakout validation.
__________________________________________________________________________________
Multi-Timeframe Insights
__________________________________________________________________________________
Higher timeframes remain constructive while execution TFs need a reclaim of 113,050 to realign.
1D/12H/6H/4H/2H: Bullish structure while 111,800–111,600 holds; a reclaim of 113,050 unlocks 114,472 then 116,200–117,300.
1H: Still capped under 113,050/114,472; needs a close above to neutralize local supply.
30m/15m: Very strong volumes and intraday risk-on support a bounce attempt; confirmation requires a persistent hold above 113,050.
Confluences/divergences: Bullish confluence = HTF support + MTF Up + moderate risk-on; key divergence = 1H still Down, raising fake-break risks without persistence.
__________________________________________________________________________________
Macro & On-Chain Drivers
__________________________________________________________________________________
Macro is slightly supportive (more accommodative Fed) but tempered by soft spot flows and elevated geopolitics — hence the need for technical confirmation.
Macro events:
- Fed: 25 bps cut with a data‑dependent tone — structurally supportive, not an automatic upside trigger.
- Geopolitics: elevated risks (Ukraine/Syria) that can boost volatility and cap rallies at resistance.
- Spot ETFs: recent soft flows — a tactical headwind into nearby ceilings.
Bitcoin analysis:
- Supply remains active under 113k; demand is defended at 111,800–111,600 (HTF), with a broader demand area near 109k/107,286 if it breaks.
- Derivatives: elevated options OI into the 26/09 expiry; “max pain” near 110k — can magnetize price if breakouts fail.
On-chain data:
- Comfort threshold ~115.2k (~95% of supply in profit): above it momentum sustains; below it risks an oscillation inside 105.5k–115.2k.
Expected impact:
- Slight rebound edge (NEUTRAL BUY), but proof via price is required: above 113,050/114,472 the macro tailwind can play; otherwise expect range and head-fakes.
__________________________________________________________________________________
Key Takeaways
__________________________________________________________________________________
Range-bound but constructive above a key HTF support.
- Overall trend: conditionally bullish with a 113,050–114,472 ceiling.
- Most relevant setup: defensive buys at 111,800–111,600 or strength buys only after a confirmed reclaim > 113,050.
- Key macro factor: the recent Fed cut improves the risk backdrop, but soft flows/headlines require price confirmation.
Be patient: demand a clean signal (break + retest + volume) before sizing up. 👀

Bitcoin tight range below 113.24–114k, FOMC in focus__________________________________________________________________________________
Market Overview
__________________________________________________________________________________
BTC is ranging tightly: repeated rejections below 113,24–114,0k while 111,956 support still holds. Momentum is split with 1D/12H constructive and 4H–6H still leaning lower.
Momentum: range ⚖️ — bounces above 111,956 but a firm 113,24–114,0k cap stalls extensions.
Key levels:
• Resistances (D/12H/4H): 113.24–114.0k · 114.8k (extension) · 121–124k (HTF).
• Supports (D/12H/4H): 112.2/111,956 · 110,086 · 107,026.
Volumes: broadly normal to moderate; very high spikes on LTF during rejections around 113.2–113.3k.
Multi-timeframe signals: 1D/12H held (constructive), 4H–6H down (pressure at the cap), 1H/LTF counter‑trend pops.
Risk On / Risk Off Indicator: NEUTRAL SELL 🟠 — slight sell bias that aligns with the ceiling at 113.24–114.0k.
__________________________________________________________________________________
Trading Playbook
__________________________________________________________________________________
Strategic stance: as long as 113.24–114.0k caps price, favor defensive range-trading; switch to pro‑breakout only on confirmed acceptance.
Global bias: overall = NEUTRAL SELL (mild) while below 113.24–114.0k; invalidated on 12H close above 113,241 with volume.
Opportunities:
• Defensive buy at 112.2–111,956/110,086 → aim 113.2–114.0k; stop < 110,086.
• Rejection short at 113.24–114.0k → aim 112.2 then 111,956; stop > 114.3k.
• Bullish breakout on 4H/12H close > 113,241 + successful retest → aim 114.8k then 121–124k; stop below 113.1 (failed retest).
Risk zones / invalidations:
• Break below 110,086 ⚠️ re‑opens 107,026 and invalidates range longs.
• “Fake breaks” above 113,241 without volume expansion → trap risk.
Macro catalysts (Twitter, Perplexity, news):
• FOMC in focus (high odds of a rate cut) → potential volatility around pivots.
• Firm USD → headwind for risk assets, capping BTC near resistance.
• Asian risk tone constructive (Nikkei record) + adoption (BBVA custody, KuCoin Pay) → medium‑term structural support.
Action plan:
• Defensive Long: Entry 112.2–111,956 | Stop < 110,086 | TP1 113.2 | TP2 114.0k | TP3 114.8k | R/R ~1.5–2.0R.
• Rejection Short: Entry 113.24–114.0k | Stop > 114.3k | TP1 112.2 | TP2 111,956 | TP3 110,086 | R/R ~1.3–1.8R.
• Breakout Long: Entry on 4H/12H close > 113,241 + retest | Stop < 113.1 | TP1 114.8k | TP2 116.0k | TP3 121–124k | R/R ~1.8–3.0R.
__________________________________________________________________________________
Multi-Timeframe Insights
__________________________________________________________________________________
Higher timeframes hold structure, mid timeframes weigh on momentum, and LTFs rotate quickly near range edges.
1D/12H: constructive above 111,956, yet 113.24–114.0k is still the lid; acceptance > 113,241 would unlock 114.8k then 121–124k.
6H/4H: bearish tilt with frequent rejections below 113.2–114.0k; “normal” volumes → prefer selling range highs until 114.0k is absorbed.
2H/1H: tactical “buy the dip” while 111,956 holds, but no trend confirmation without a close > 113,241.
30m/15m: very high volume on rejections at the cap → “fake break” risk; scalping window between 112.0–113.3k.
__________________________________________________________________________________
Macro & On-Chain Drivers
__________________________________________________________________________________
Macro is mixed (strong USD vs Asian risk‑on) with FOMC risk ahead; on‑chain supports a consolidation narrative with cooler TradFi flows but improving adoption.
Macro events:
• FOMC: rate cut expectations → directional impulse possible, but also whipsaw risk.
• Strong USD: short‑term headwind for BTC, consistent with capping near resistance.
• Nikkei 225 at record highs: constructive Asian risk tone partly offsets USD drag.
Bitcoin analysis:
• Adoption/flows: BBVA (custody via Ripple) and KuCoin Pay (on‑chain payments) support future demand; Metaplanet adds to “corporate accumulation.”
• Critical zones: reclaiming 114–116k is needed to re‑ignite momentum; below 110,086 risks a 107,026 retest.
On-chain data:
• Accumulation between 108–116k; STH profitability ~60% → fragile without a push above 114–116k.
• ETF/futures inflows cooling → limited near‑term conviction.
Expected impact:
• Range likely persists while 113.24–114.0k holds; upside requires a high‑volume breakout, otherwise expect rotations and traps.
__________________________________________________________________________________
Key Takeaways
__________________________________________________________________________________
BTC is range‑bound with a credible cap at 113.24–114.0k and a defended floor at 111,956.
- Trend: neutral to slightly bearish while 4H–6H remain down and 113,241 isn’t reclaimed.
- Best setup: rejection shorts at 113.24–114.0k or defensive longs at 112.2–111,956 with tight risk.
- Key macro: FOMC ahead, with a firm USD acting as a near‑term brake.
Stay nimble: trade the edges, and only chase breaks backed by volume. 🔔
Risk-Off in play: fragile bounce until 111k is reclaimed__________________________________________________________________________________
Market Overview
__________________________________________________________________________________
BTC remains in a controlled pullback after the 124,277 rejection, compressing above 109k and gravitating toward the 107,100 HTF pivot. Sellers keep the upper hand, but a technical bounce can emerge if key supports hold.
Momentum: Bearish 📉 with lower highs/lows; selling pressure dominates below 111k.
Key levels:
– Resistances (HTF/LTF): 110.6–111.0k • 111.9k (W) • 114–115k (D)
– Supports (HTF): 109.0–109.3k • 107,100 (240 PL) • 103,000 (former demand)
Volumes: Moderate on 2H–6H, Normal on 1D → no capitulation; likely low‑range chop/wicks.
Multi-timeframe signals: LTF (15m–2H) trending down; 4H/2H show local bullish divergence (ISPD = BUY) near 107.1k; overall trend bias still Down.
Risk On / Risk Off Indicator: SELL (sell bias) — confirms the bearish momentum; a move to NEUTRE ACHAT would better support a bounce.
__________________________________________________________________________________
Trading Playbook
__________________________________________________________________________________
Below 111k, sellers drive the tape; favor “sell the rip” while keeping a tactical long only on clean reactions at support.
Global bias: Mildly bearish below 111.0k; main invalidation on a 4H close > 111.0k.
Opportunities:
– Fade the 110.6–111.0k bounce with a tight stop; target 109.6k then 109.0k.
– Tactical long on a strong 107.1k reaction (wick rejection + 2H/4H reclaim > 110.6k), target 111.9k.
– Continuation short if 4H/D closes below 107.1k toward 103k.
Risk zones / invalidations:
– A firm break below 107.1k invalidates longs and opens 103k, then 96.3k.
– A confirmed reclaim above 111.9k invalidates most shorts and opens 114–115k.
Macro catalysts (Twitter, Perplexity, news):
– Powell signaling a possible September cut but data‑dependent → solid prints help reclaim 110.6k+.
– US data (Durable Goods, Consumer Confidence) → negative surprises raise odds of a 107.1k break.
– Trade tensions (tariffs/supply‑chain) → risk premium, can cap rebounds.
Action plan:
– Long Plan (tactical): Entry 109.2k and 107.3–107.1k / Stop < 106.8k / TP1 110.6k, TP2 111.9k, TP3 114–115k / R:R ~2.0–2.5R.
– Short Plan (fade or breakdown): Entry 110.6–111.0k OR after 4H close < 107.1k / Stop > 111.2k (fade) or >108.2k (break) / TP1 109.6k (fade) or 103k (break), TP2 109.0k or 99–98k / R:R ~1.8–2.5R.
__________________________________________________________________________________
Multi-Timeframe Insights
__________________________________________________________________________________
Most timeframes lean bearish, with 4H/2H contrarian hints at a major HTF support.
1D/12H/6H: Lower highs/lows under 111k; magnet toward 107.1k; 114–115k only after a firm reclaim > 111.0k.
4H/2H: Bullish divergence (ISPD = BUY) around 108.8–109.3k/107.1k; only buy if 110.6k is reclaimed, then 111.9k tests.
1H/30m/15m: Trend favors sell‑the‑rip; fade 110.4–111.0k; watch liquidity sweeps sub‑109k to 108.6k; need a volume regime shift to reverse.
__________________________________________________________________________________
Macro & On-Chain Drivers
__________________________________________________________________________________
Macro turns more easing‑friendly yet data‑dependent, while institutional BTC demand persists despite deleveraging.
Macro events: Powell hints at a possible September cut (data‑dependent); RBA minutes tilt dovish; trade tensions (tariffs/undersea supply) → tactically supportive for risk unless inflation/geopolitics flip risk‑off.
Bitcoin analysis: US spot ETF inflows (+$219M on Aug 25) signal resilient institutional demand; players like MicroStrategy near ~3% of supply → steady float absorption.
On-chain data: CEX reserves ~3.27M BTC with recent net outflows; ~1,703 BTC moved from Coinbase Institutional to custody → accumulation bias, but high derivatives OI = squeeze‑prone.
Expected impact: If easing narrative and inflows persist, reclaiming 110.6k/111.0k becomes more likely; risk‑off shocks raise the odds of a 107.1k break.
__________________________________________________________________________________
Key Takeaways
__________________________________________________________________________________
Market sits in controlled range‑down, anchored by a key HTF pivot.
– Trend: Bearish/cautious below 111k, bounce potential if 107.1k holds.
– Top setup: “Sell the rip” at 110.6–111.0k; “Buy the dip” only on a clean 107.1k reaction and reclaim > 110.6k.
– Macro: Easing bias (Fed/RBA) helps a reclaim, but US data and trade tensions can cap risk.
Stay disciplined: trade confirmations and respect invalidations.
Bitcoin: High-Stakes Consolidation Before Jackson Hole
__________________________________________________________________________________
Market Overview
__________________________________________________________________________________
Bitcoin remains in a consolidation phase just below key resistance, with bullish momentum fading after several failed attempts to break higher.
Momentum: The overall trend is neutral to bearish 📉, as waning demand under resistance points to a lack of strength for a renewed uptrend.
Key levels:
Resistances (1D/12H): 118,575 – 122,218, 124,474
Supports (1D, 12H, 4H): 115,000 – 114,000 (immediate pivot zone), 111,900 (major weekly), 98,200 (extreme support).
Volumes: Volumes are mostly normal to moderate; however, a recent volume spike on the 15min signals a potential speculative bottoming attempt.
Multi-timeframe signals: Higher timeframes (1D–6H) show “Neutral Sell” to neutral, while intraday (4H–15min) turns clearly bearish, with some short-term reversal signals (divergences, extreme volume).
Risk On / Risk Off Indicator context: The Risk On / Risk Off Indicator is in “neutral sell” mode — matching the directionless momentum, with no strong recovery signal observed yet.
__________________________________________________________________________________
Trading Playbook
__________________________________________________________________________________
The dominant trend remains neutral to slightly bearish, prompting a defensive stance and readiness for scalping opportunities.
Global bias: Primary bias is neutral to bearish below $119,500 — a sustained breakout above this level is needed to flip the trend bullish.
Opportunities:
– Aggressive scalp buys between $114,000 and $115,000 if reversal signals (ISPD DIV BUY + extreme volume) are confirmed; targets: $116,800, then $118,575.
– Swing long only on weekly recovery above $119,500 with clear confirmation; otherwise stay defensive.
Risk zones / invalidations:
– A break below $111,900 invalidates any bullish scenario, exposing deeper correction risks toward $98,200.
– Sustained loss of $114,000 without absorption = risk of sharp downside.
Macro catalysts (Twitter, Perplexity, news):
– Awaiting Powell’s Jackson Hole speech; implied volatility near lows could set up for abrupt expansion post-OPEX.
– Geopolitics are relatively calm; gold and JPY serve as global risk indicators.
– FX and index signals align with a cautious, unchanged environment.
Action plan:
Entry: buy scalp $114,000–$115,000 upon confirmation, stop below $113,800, TP1: $116,800, TP2: $118,575, TP3: $122,200; R/R approx. 2–2.5 depending on support response.
__________________________________________________________________________________
Multi-Timeframe Insights
__________________________________________________________________________________
Higher timeframes (1D–6H) remain in tight consolidation below top-of-range resistance, with intradays (4H–15min) showing pronounced bearishness and speculative reversal signals on lows.
1D–6H: Price is capped under $122,200; key supports lie just below ($115,000–$111,900). Structure remains a tight range — decision zone very close.
4H–1H: Signs of distribution, persistent lower highs, repeated testing of the $115,000/$114,000 support zone. No evidence of lasting bullish reversal; watch for potential flush.
30min–15min: Overall "SELL", but bullish ISPD DIV divergences and very high volume suggest a speculative bounce if support holds. Such divergences are often markers for potential intraday trend shifts and warrant close monitoring.
__________________________________________________________________________________
Macro & On-Chain Drivers
__________________________________________________________________________________
Macro remains cautious, while on-chain metrics illustrate both underlying robustness and short-term fragility for BTC.
Macro events: Markets are on hold ahead of Jackson Hole; implied vol at/near all-time lows, dealer gamma high — any surprise catalyst could trigger significant volatility. A weak yen and Nikkei at all-time highs reflect shifting global risk preferences.
Bitcoin analysis: After the recent sell-off, BTC is defending the 114–115k zone. Whales and institutions are accumulating, but institutional flows as a whole remain light; risk of liquidations persists if a further correction unfolds.
On-chain data: BTC’s on-chain momentum is constructive, with little capitulation, but very low implied volatility flags a heightened risk of fast, outsized moves. Lever buildup in altcoins increases systemic fragility.
Expected impact: This context suggests a latent market, with substantial swing potential on the next external shock, confirming a cautious and tactical technical stance — active risk management around current supports is key.
__________________________________________________________________________________
Key Takeaways
__________________________________________________________________________________
BTC is trading in a high-range consolidation under resistance, with fading momentum and no macro catalyst in sight.
Overall trend is neutral to bearish across most timeframes, yet speculative rebound (scalp buy) signals are emerging on the shortest horizons (15–30min). The best setup is an aggressive scalp buy zone between $114,000 and $115,000 for nimble traders. On the macro side, any Jackson Hole-driven volatility could quickly tilt the balance.
Stay disciplined: a decisive loss of current supports could trigger sharp downside — active risk management is a must.
__________________________________________________________________________________

Bitcoin Macro Tailwind Meets Short-Term Volatility Battle__________________________________________________________________________________
Market Overview
__________________________________________________________________________________
Bitcoin’s momentum remains bullish on higher timeframes, but the price action is currently stalling below a critical resistance cluster, fueling volatility and intraday shakeouts.
Momentum 📈: The prevailing swing structure remains bullish, driven by robust mid/long-term trends; however, there is clear momentum fatigue with shallow corrections appearing on lower timeframes.
Key levels:
• Major resistances : 122,450–123,300 (primary pivot battle zone across daily/4H/12H), 119,812 (intermediate historic resistance now contested)
• Main supports : 119,812–118,050 (multi-TF pivotal demand zone), 114,967 (1D/4H pivot, also Weekly support)
• These zones are critical: breaking above 123,300 could spark a fast move toward 127k, while holding above 119,800/118,000 keeps the bullish structure intact.
Volumes: Normal to moderate on primary timeframes, but very high short-term spikes on 15min underline active volatility traps.
Multi-timeframe signals: Medium/long-term TFs (1D, 12H, 6H, 4H, 2H, 1H—all Up) confirm the bullish bias; however, the Risk On / Risk Off Indicator shifts to SELL on the 30min/15min, reinforcing near-term caution.
Risk On / Risk Off Indicator context: “Neutral sell” on the broader trend, flipping to SELL at short-term extremes—underscoring the need to defend positions as volatility rises into resistance.
__________________________________________________________________________________
Trading Playbook
__________________________________________________________________________________
The strategic backdrop favors bullish setups as long as price action holds major support, but discipline and swift reaction are needed while Bitcoin hovers under vital resistance.
Global bias: “Neutral buy” as long as 119,812/118,000 holds; any solid break below 118,000 flips the swing outlook neutral or bearish.
Opportunities:
• Tactical buy on structured pullback into 119,812/118,050 – key swing entry zone.
• Conditional breakout trade above 123,300 – sets up an extension toward 127k, especially if shorts get squeezed.
• Defensive scalp only on volatility flushes and rapid reclaim above 120,156/119,812.
Risk zones / invalidations:
• Confirmed breakdown below 119,812 is the first warning sign—opens risk of a retest of 118,000 or deeper.
• Sustained loss of 118,000 = neutrality/bearishness resumes, opportunity for strategic selling may appear.
Macro catalysts (Twitter, Perplexity, news):
• Accelerating global liquidity (US M2 surge, China credit) underpins the risk asset backdrop.
• Geopolitical easing (Ukraine truce, G7 signals) reduces systemic threats; tailwinds for risk markets.
• Looming short squeeze ($6B in shorts at 125k) could fuel explosive breakout moves if resistance breaks.
Action plan:
• Entry : Staggered buying into 119,812/118,050 or confirmed breakout above 123,300.
• Stop : Below 118,000 (key swing stop).
• TP1 : 122,450, TP2 : 123,300, TP3 : 127,000 short squeeze extension.
• R/R: Moderate to high; optimal if entered near support or confirmed clean break.
__________________________________________________________________________________
Multi-Timeframe Insights
__________________________________________________________________________________
Multi-timeframe analysis shows strong trend alignment on higher frames, contrasted by rising volatility and trap risk on the intraday scale.
1D/12H/6H/4H: Bullish structure and trend intact, with broad support at 119,812/118,050; strong resistance cluster at 122,450/123,300 preventing further upside for now. Each dip to support has triggered buyer defense and recovery.
2H/1H: Sideways consolidation at the upper range, above key supports. Corrections remain shallow unless 119,800/118,000 break.
30min/15min: Clear divergences—momentum shifts bearish, volume spikes, trap risk is high. These signals warn against chasing breakouts prematurely and demand patience.
The underlying theme: The pivotal zone between 118,000 (support) and 123,300 (resistance) is where momentum for the coming days will be defined—traders must monitor reaction closely rather than anticipate.
__________________________________________________________________________________
Macro & On-Chain Drivers
__________________________________________________________________________________
Macro and on-chain trends offer fundamentally bullish support for Bitcoin, although short-term volatility and positioning require active risk management.
Macro events:
• Global liquidity is on the rise (US M2, China credit), supporting higher valuations for risk assets.
• Market expectation for US Fed rate cuts, bullish macro calendar, and reduced credit spreads—all positive for risk-on sentiment.
• Easing geopolitics (Ukraine diplomacy, G7 moves) lowers the threat of sudden shocks, adding stability.
Bitcoin analysis:
• Strong institutional inflows and treasury allocations, growing support from large funds.
• Key short squeeze level at 125k—liquidation of $6B in shorts could drive a rapid extension if resistance is breached.
• Bitcoin dominance dropping below 60% hints at capital rotation into alts but can also revert quickly if the market overheats.
• Institutional custody solutions and secure insurance ramping up, supporting greater adoption.
On-chain data:
• Profitability among holders is very strong; minimal signs of forced selling or capitulation.
• No major signs of excessive euphoria; volatility implied to be low—a classic contrarian prelude to a volatility spike.
Expected impact: These drivers underpin the swing-long bias but demand precise execution and tactical caution around major resistance traps and volatility spikes.
__________________________________________________________________________________
Key Takeaways
__________________________________________________________________________________
Bitcoin remains in a mature uptrend but is stalling beneath heavy resistance, requiring patience and disciplined execution.
The global trend is bullish as long as 119,800/118,000 zone holds—these are structurally critical. The most relevant setup is a conditional breakout play above 123,300, targeting 127k if momentum and shorts align, but caution is needed due to heightened short-term trap risks. Macro tailwinds (liquidity surge, geopolitics improving) give deeper support but don’t remove the need for vigilance as intraday volatility remains acute.
Stay nimble: avoid chasing into resistance, wait for signals of real flow, and prepare for fast reversals near the key battle zones.

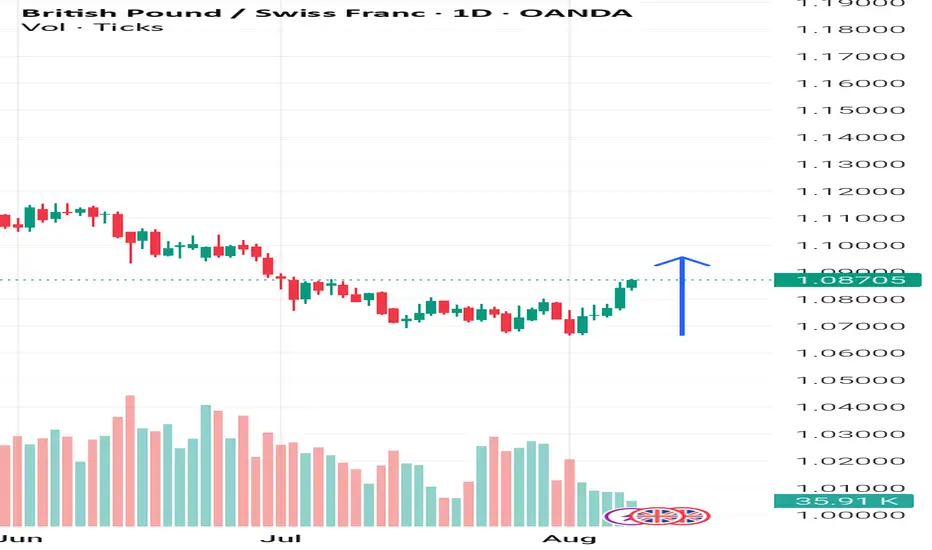
Weekly Review: FOREX FUNDAMENTAL ANALYSIS +GBP CHF long idea It was nice to see that throughout the week starting Monday 4 August, in the main, the currencies behaved as you would expect in a 'risk on' environment.
The underlying positive tone was this week helped by the narrative that a softening US Labour market is likely to speed up FED rate cuts. Meaning the 'soft landing' narrative' is very much in tact. Positive APPLE news helped the S&P and, ultimately, it appears 'tariffs' are not going to be as hard hitting as once feared.
Of course, at any moment, softening US data could start to concern the market. Or another tariff spanner could be thrown into the works, but until then, I'll continue to hold a view that 'risk on' trades are viable. Either trading momentum or pullbacks creating 'nice support'.
Currently, I see the JPY, CHF and USD as 'short options'. Hard hitting tariffs on SWITZERLAND bringing the CHF back into play. Any talk of BOJ hikes is currently out powered by the general risk on tone (and possibly 'the carry trade'). Arguably, 'USD short' is the most difficult to have confidence in. As, despite suggestions of swifter rate cuts, the narrative of 'tariffs causing inflation' kept the US 10 YEAR YIELD above 'long term technical support' around 4.2. and the 'tariff inflation narrative' will be something to keep an eye on, particularly as US CPI is reported during the upcoming week.
At the other end of the spectrum, recent GBP woes were put to one side thanks to a 'hawkish cut', positive RETAIL SALES boosted the EUR plus the AUD and KIWI beniffited from the overall 'risk on mood'.
Soft data from CANADA and the CAD'S relative proximity to the US ensures I'm inclined the leave the CAD alone for the time being .
On a personal note, it was a week of two trades. One stopped out and one hit profit. Early in the week following a USD pullback (USD strength) I placed a AUD USD long, based on the theory of more USD 'post NFP selling'. But the trade stopped out.
I then missed any further opportunities throughout the week. Eventually placing a GBP JPY long on Friday. Based on JPY weakness and the post BOE GBP strength.
I realise two trades per week with a 50% win rate is slow progress. It's times like these when (experienced traders) might consider upping the risk percent per trade by 0.5%.
Bullish momentum holds, 111-113k breakdown will be decisive__________________________________________________________________________________
Technical Overview – Summary Points
__________________________________________________________________________________
Momentum: Structurally bullish bias on HTF (1D/12H/6H/4H) confirmed by Risk On / Risk Off Indicator showing consistent “Strong Buy” signal. Technical consolidation on LTF (2H→15min) with emerging selling pressure.
Supports / Resistances: Major supports: 1D/weekly at 111-115k. Dense resistance between 116.9-119k. Structure remains valid if price holds >111k.
Volume: Normal on HTF; episodes of extreme spikes on 30min-15min indicating possible liquidations/flush but no widespread capitulation.
Multi-TF behavior: No panic in HTF; LTF selling pressure looks more like leveraged exhaustion than a lasting bearish reversal.
__________________________________________________________________________________
Strategic Summary
__________________________________________________________________________________
Global bias: Bullish (HTF). Holding support at 111-113k is the key condition to favor accumulation.
Opportunities: Tactical accumulation ≥111k, watch for breakout >117-119k, intraday scalps on LTF volume extremes.
Risk zones: Breakdown <111k = risk of fast flush towards 107-110k; rejection below 116.9-119k = potential bull trap.
Macro catalysts: Awaiting Fed decision (September), increased volatility around calendar events, global liquidity at highs, geopolitics on watch.
Action plan: Accumulate on major supports, confirm bullish leg on break >117-119k with volume, swing stop-loss <110k.
__________________________________________________________________________________
Multi-Timeframe Analysis
__________________________________________________________________________________
1D: Uptrend structure active, weekly/daily support 114-115k, Risk On / Risk Off Indicator bullish. Healthy consolidation below old resistance ≥119k.
12H/6H/4H: Trend Up, strong range zone, sector momentum steady, no sell stress.
2H/1H: Intermediate consolidation/selling pressure. Downtrend confirmed on 1H/2H, but volume controlled.
30min/15min: Very high volumes, ISPD DIV sell signal (15min), probable distribution/exhaustion. 111-113k key support = front-line to monitor.
Summary: Bullish structural alignment on HTF, consolidation/profit-taking on LTF but no major breakdown of key supports.
__________________________________________________________________________________
Macro & On-Chain Analysis (Technical x Fundamental)
__________________________________________________________________________________
Macro: Expected Fed pivot (Sept), global liquidity at ATH, geopolitics remain uncertain but stable, weaker dollar.
BTC on-chain: Accumulation in 110-115k area, ETF outflows, no STH stress, reclaim 116.9-119k resistance is crucial for bullish reversal.
Calendar: Fed/FOMC 30/07 (pause expected), US earnings & oil data 06/08. Watch for surprise events.
R/R: Favorable long ≥111k; break >119k = validation, short on failure at 116.9-119k if support lost, swing stop <110k.
__________________________________________________________________________________
Actionable Synthesis
__________________________________________________________________________________
Swing bias: Favor tactical accumulation or active management as long as support ≥111k holds and Risk On / Risk Off Indicator remains “Strong Buy”. LTF = trading ground, HTF = maintain core positioning.
Heightened vigilance at 116.9-119k: Potential trap/breakout activation zone. Watch liquidity on pullbacks and during volume “climax”.
Stay agile, adjust stops tactically according to intraday volatility and price reaction at key support levels.
__________________________________________________________________________________
Bitcoin at 120,000: Decisive Breakout or Renewed Consolidation?__________________________________________________________________________________
Technical Overview – Summary Points
__________________________________________________________________________________
Momentum: Strongly bullish on H1 and above; healthy consolidation below ATH.
Supports/Resistances: 120,000 USDT (pivot resistance), 116,400–117,000 (major support), 104,000–110,000 (long-term support).
Volumes: Normal, no anomaly nor climax detected.
Risk On / Risk Off Indicator: Strong buy signal on all timeframes except very short term. Sectoral health confirmed.
Multi-timeframe: Short-term bearish divergence on 15/30min, but robust technical structure above H1-D1.
__________________________________________________________________________________
Strategic Summary
__________________________________________________________________________________
Global bias: Confirmed bullish across all timeframes; no major break detected.
Opportunities: Strategic buys between 116,400–117,000 (pullback); confirmed breakout above 120,000 (target 130,000).
Risk zones: Below 116,000 (potential correction to 112,000–104,000), false breakout at the top.
Macro catalysts: Monitor Fed (next FOMC July 29-30), volatility on risk assets, geopolitical tensions.
Action plan: Prioritize stop management, stay reactive ahead of macro events. Main scenario: buy confirmed pullback or validated breakout.
__________________________________________________________________________________
Multi-Timeframe Analysis
__________________________________________________________________________________
1D / 12H: Bullish structure intact but facing historical resistance (120k), strong supports in place (104–107k).
6H / 4H / 2H: Consolidation below resistance, no signs of exhaustion, tactical supports at 116,000–117,000.
1H / 30min / 15min: Weakness on shorter timeframes (sellers at top), confirmation of range polarization. No emotional excesses (ISPD DIV neutral), standard volumes.
Risk On / Risk Off Indicator: Strong buy except for very short-term fatigue.
Summary:
Multi-horizon bullish bias, technical and sectoral confluence for upside extension if clear breakout >120,000. Key support to hold at 116,400–117,000. Buy dips, ride breakout up to 130,000. Focus on risk management, flexibility advised as macro (Fed) nears.
__________________________________________________________________________________
Key macro events to watch
__________________________________________________________________________________
2025-07-18: Fed rate/volatility debate (Equity, Bonds, BTC).
2025-07-29: FOMC (potential pivot for risk assets).
__________________________________________________________________________________
Strategic decision & final summary
__________________________________________________________________________________
Main bias: Bullish, to be validated at key levels, favor buying dips/breakouts.
Risk management: Stop below 116,000, scale out progressively after 125k, reinforced protection ahead of FOMC.
Opportunities: Pullback 116,400–117,000 (RR >3); H4/D breakout >120,000 targeting 130,000 (RR >2).
Monitoring: Macro (Fed, geopolitics), dynamic management according to market response to news.
Conclusion:
A validated move above 120,000 projects target to 130,000 (next statistical/on-chain extension). Deep dips can be bought above 104,000. Do not loosen risk management as Fed date approaches.

Bitcoin facing breakout, active management recommended__________________________________________________________________________________
Technical Overview – Summary Points
Strong bullish momentum across all timeframes (MTFTI “Strong Up”).
Key supports: 110,483–111,949. Major resistances: 118,689–119,499.
Volumes normal to slightly elevated. No anomaly or climax.
Behaviour: early caution signals on ISPD DIV (4H–2H), sector “sell” trigger on the Risk On / Risk Off Indicator (15min).
__________________________________________________________________________________
Strategic Summary
Overall bullish bias on all timeframes. Structural uptrend confirmed, but early behavioural/sector divergence at short term.
Buy zones: pullback to 110,483–111,949. Stop/alert below 110,483 H4/H6 close.
Opportunities: tight trailing above 118,689 to capture extension. Partial take profit advised in upper range (118,689–119,499) if divergences persist.
Risks: geopolitical risk-off catalysts, start of selling extension, or loss of support.
Plan: active management required, avoid overexposure, plan for key break levels, readiness to exploit imminent breakout.
__________________________________________________________________________________
Multi-Timeframe Analysis
1D : Price above all pivots, strong momentum. Key resistance in play (119,499), supports at 110,483/105,054. Volumes normal, bullish alignment.
12H : Confluence of resistances (119,499–115,495), structure intact, buy opportunity on retrace. No major alert.
6H : Strong buying extension, pure momentum. No excess signals.
4H : First divergence (ISPD DIV “sell”). Consolidation on resistance, consider partial profit-taking.
2H : Bullish momentum but ISPD DIV “sell” and moderately high volumes. Localized euphoria risk.
1H : No excess, post-breakout consolidation.
30min : Extreme consolidation, decelerating volumes, possible fatigue.
15min : Sector “sell” trigger (Risk On / Risk Off Indicator “Sell”). Trend remains up, but caution is advised.
Multi-tf summary:
Bullish alignment across all horizons. Short-term behavioural caution, but trend remains unchallenged as long as above 110,483–111,949.
__________________________________________________________________________________
Synthesis & Strategic Bias
Multi-timeframe momentum confirmed, watch supports at 110,483–111,949.
Buy on valid retrace, take profit at highs if behaviour diverges.
Break below 110,483 (H4/H6 close) = invalidation signal.
Key triggers: geopolitical news, broken supports, selling spikes.
Base scenario: likely imminent directional breakout (volatility). Watch for spikes on major headlines.
__________________________________________________________________________________
Fundamentals and Macro News
Uncertain backdrop (Fed, US inflation, bonds & FX), no major macro trigger in 48h but latent volatility.
Crypto: Bitcoin stable, general accumulation, no violent distribution detected.
Geopolitics: rising tensions (Iran, Ukraine). Can prompt sharp risk-off if escalation occurs.
No major macroeconomic event scheduled (empty calendar).
__________________________________________________________________________________
On-chain Analysis
Accumulation phase for all holders, >19k BTC/month absorbed. Extreme volatility compression (coiling).
Realized & implied volatility is exceptionally low, setting up violent move.
ETF (IBIT BlackRock): record accumulation. Downside break could trigger psychological stress.
Baseline: technical & on-chain setup disfavors bears. Any exogenous shock accelerates volatility.
__________________________________________________________________________________
Strategic Recap & Action Plan
Bullish bias validated, risk of market fatigue on short-term signals.
Buy on controlled pullback, tight trailing at highs, partial profit-taking in 118,689–119,499 band.
Swing stop below 110,000 (H4); total invalidation if daily support fails.
Expect directional move + volatility on next impulse (8–48h).
__________________________________________________________________________________
Conclusion
BTC remains in a primary bullish trend, supported by on-chain accumulation and extreme structural compression. Only active management (profit, leverage, stops) optimizes R/R and prepares to respond to an imminent, directional volatility event. Stay proactive and plan!
__________________________________________________________________________________

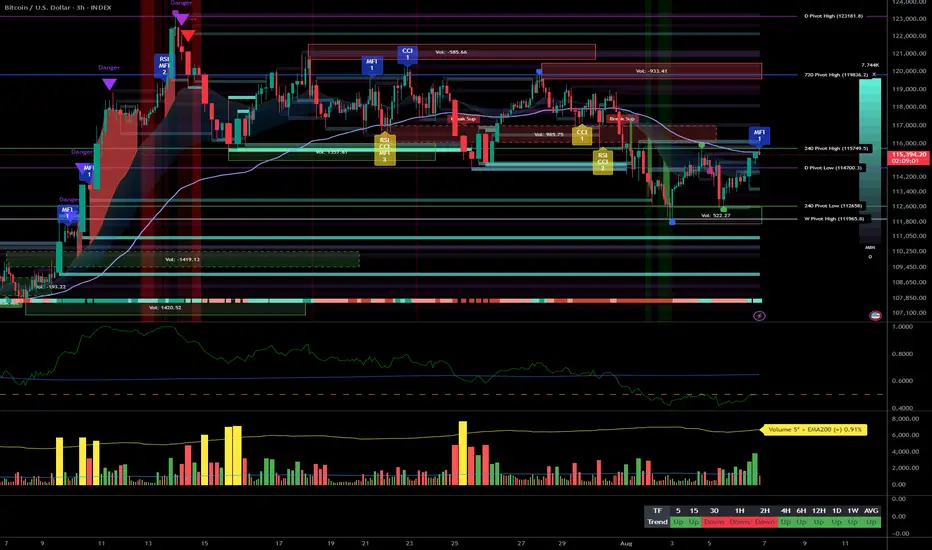
Bitcoin Analysis: Risk under 108k, aiming 111k+ in continuation__________________________________________________________________________________
Technical Overview – Summary Points
__________________________________________________________________________________
Momentum: Strong uptrend across all major timeframes (MTFTI “up”). Buyers remain in control; daily/4H/1H structure robust.
Key supports: 108,239.1 (720min Pivot, critical transversal support), 105,054.7 (240min Pivot), 99,581 (240min Pivot). Active defense seen on 108,239.1 at all timeframes.
Main resistances: 110,630.1 (1D), 110,483.1 (240min), 111,949 (W). The 110–111k area acts as the short-term ceiling.
Volume: Moderate activity, no spikes or climaxes, slight intensification noted on the 30min during key tests.
Risk On / Risk Off Indicator: “STRONG BUY” signal on all Tfs ≥30min, contributing to marked bullish momentum. Minor short-term divergence only on 15min.
Multi-TF behavior: ISPD DIV and Investor Satisfaction are neutral, no extreme behavioral stress; psychology is balanced, neither panic nor euphoria.
__________________________________________________________________________________
Strategic Summary
__________________________________________________________________________________
Overall bias: Bullish, synchronized multi-timeframes, dominant bullish liquidity.
Opportunities: Optimal long entries on validated pullback to 108,239.1, add on breakout of 110,630–111,949. Gradual partial take profit recommended in the 111k area.
Risk zones: Invalidation below 108,239.1 (confirmed H2 close), risk of further correction toward 105k then 99.5k; suggested swing stop under 108,000.
Macro catalysts: No major event, global markets stable. Geopolitical tensions monitored, low short-term impact.
Action plan: Prioritize “buy the dip” on pivots, active monitoring for any breakout/failure. Dynamic stop management, partial profit-taking on extension.
__________________________________________________________________________________
Multi-Timeframe Analysis
__________________________________________________________________________________
1D: Very strong daily structure, high momentum, intermediate supports near 98k/100.5k. Watch for major resistances at 108–111k.
12H/6H/4H: Ranging below 110–111k resistance, no fragility. Supports 108,239.1 and 105,054.7 holding, no selling pressure detected. Watch for breakout/impulse.
2H/1H: Buy zone if maintained >108,239.1, risk of sell-off below this pivot toward 105k. Price is ranging, momentum remains positive.
30min/15min: Consolidation on supports. 15min: temporary divergence on the Risk On / Risk Off Indicator but bullish structure intact unless a clean break below 108,239.1.
Risk On / Risk Off summaries: Dominant “strong buy” tone, synchronized momentum, only weak short-term divergence. No behavioral stress (ISPD DIV neutral everywhere).
__________________________________________________________________________________
Cross-analysis and recommendations
__________________________________________________________________________________
Momentum: Bullish environment sustained as long as >108,239.1. Continued upside bias if breakout above 110–111k is confirmed.
Risks: No major vulnerabilities detected. Very low probability of a local top, except in the case of exogenous macro shock.
Macro & On-chain: Stable newsflow, no distribution from HODLers or significant new inflows. Preferred strategy: swing trading in trend direction, tight stop under the main pivot.
__________________________________________________________________________________
Decision summary
__________________________________________________________________________________
Preferred scenario: Hold long >108,239.1, add on validated pullback, look for breakout with volume extension to 111k+.
Risk management: Stop under 108,000, partial profit-taking in the 110,630–111,949 area.
No immediate macro constraints: Use this calm window to ride the trend.
Monitoring: Resilience of the main support, any sudden geopolitical shocks.
BTC/USDT keeps a clear bullish bias, favoring swing or trend-following strategies as long as key pivots hold. Buy the dips remains optimal while technical structure holds; strict stop management is advised pending any “breakout fail”.
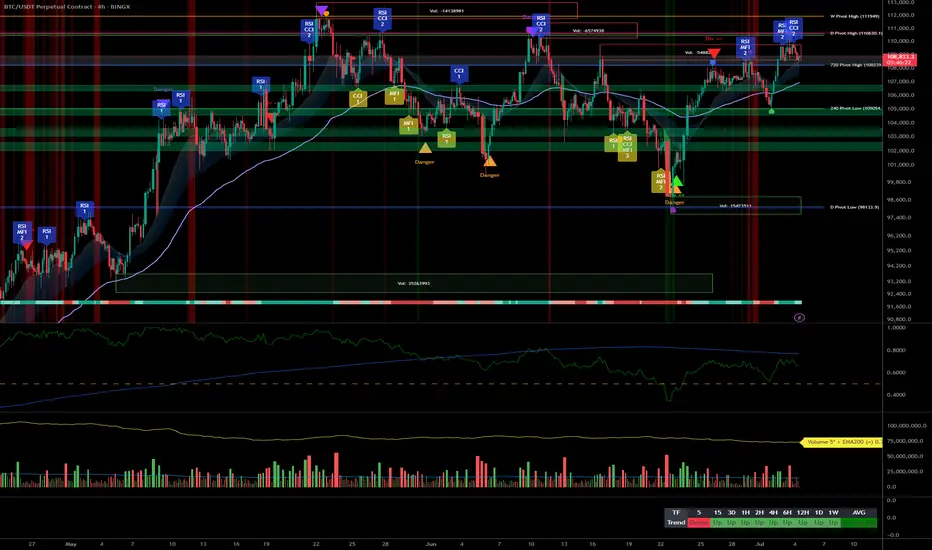
Bitcoin Robust Bullish Structure, Key Entries at 105k & 100k__________________________________________________________________________________
Technical Overview – Summary Points
__________________________________________________________________________________
Bullish momentum confirmed across all timeframes : Structure remains healthy, no behavioral anomalies detected.
Key supports: Main HTF pivot around $98,000–$100,000; first intermediate support zone at $105,000.
Major resistances: Critical area between $109,000 and $112,000, dense pivot and volume profile confluence.
Volumes: Normal to very high depending on TF, no speculative excess; gradual rise hints at possible expansion phase.
Risk On / Risk Off Indicator : Strong Buy from daily to 1H, shifting to neutral on shorter timeframes (30min–15min).
ISPD DIV/Mason's line: Predominantly neutral histogram, no overheat or capitulation detected.
Multi-timeframe behavior: Robust underlying structure, increased volatility but no massive selling stress.
__________________________________________________________________________________
Strategic Summary
__________________________________________________________________________________
Global bias: Bullish dominance as long as $98k–$100k holds.
Opportunity zones: Buy on pullback to $105k, swing confirm above $111k with volume/ISPD validation.
Risk / Invalidation: Stop loss below $98k; extra caution on macro/Fed events.
Macro catalysts: Fed/NFP-US (July 2–4), monitor behavior via ISPD DIV (blue to red).
Action plan: Structured and tactical long bias, “no trade” zone before major US releases, immediate stop on support break.
__________________________________________________________________________________
Multi-Timeframe Analysis
__________________________________________________________________________________
1D: Bullish momentum, no overheat. Pivot 98–100k = strategic fallback.
12H–6H: Signs remain bullish, no anomalies, intermediate supports at 105–107k.
4H–2H: Positive consolidation, rising volumes; possible accumulation on 105k dips.
1H–30min: Multiple resistances under 110–112k, very high volumes, maintain vigilance for sudden spikes.
15min: Extreme volatility, but no clear seller excess; watch for “trap” formation.
Risk On / Risk Off Indicator : Strong Buy on main timeframes, shifting to neutral/buy on 30min/15min (breather zone).
ISPD DIV/Mason's line: No buyer capitulation, overall neutral histogram.
Summary: Bullish cross-timeframe alignment, only macro events may trigger a break.
Key economic calendar
- 07/02: Powell speech – Potential added risk-on boost.
- 07/02: US tariff updates – Possible volatility.
- 07/04: NFP, ISM... High expected volatility.
Action : Heightened caution pre-announcements, validate through volume/ISPD.
On-chain: Dominant HODLing, no dumping, stable institutional volume.
Macro: Fed, inflation, geopolitics under watch.
Tactical: Spot any warning via ISPD or volume cluster.
__________________________________________________________________________________
Conclusion & risk management
__________________________________________________________________________________
Strong bullish bias as long as $98k–$100k holds .
Optimal buy on $105k/$100k dips, swing confirm on $111k break .
Outside of US events: strict tactical discipline required .
Absolute invalidation zone: break below $98k (HTF + STH cost-basis) .
Remain vigilant for ISPD red + volume spike / macro headlines .
__________________________________________________________________________________