USDJPY – STRONG SUPPLY REJECTION, RANGE FORMATION & UTA SCENARIOUSDJPY is currently reacting from a clearly defined strong supply zone, where price previously formed a rounded top, signaling distribution and seller dominance. After the rejection, the market moved lower and entered a range, showing indecision between buyers and sellers. The highlighted buyer zone is acting as short-term support, while repeated tests of the mid-level indicate liquidity being built.
At present, price is forming an UTA (Upthrust After Accumulation)-type structure near resistance. If price breaks and holds above this level, continuation toward the upper marked target becomes likely, aligned with a liquidity grab above the range. However, failure or rejection from this zone would confirm seller strength again, opening the path toward the lower target inside the demand zone area.
Overall, this is a reaction-based market: confirmation above resistance favors upside continuation, while rejection favors a bearish move back into demand. Patience and level-based execution remain key in this structure.
Roundedtop

NZD/USD Building Bullish Structure From DemandDespite recent corrective moves, NZD/USD is developing a strong bullish foundation as price continues to respect the major demand zone at the bottom of the chart. Each rejection from this zone shows clear evidence of institutional buying, with long wicks and aggressive recoveries indicating that sellers are losing power.
The rounded-top and earlier distribution worked mainly as a liquidity sweep, pulling price back into areas where large buyers were waiting. Now, price is forming a higher-low structure, suggesting accumulation rather than continuation of the downtrend. The presence of the Fair Value Gap (FVG 4H) below acts as a completed rebalancing area, giving room for a clean bullish expansion.
If price maintains stability above the buyer zone (0.5690–0.5700), we can expect a progressive move toward the mid-range resistance at 0.5740, and eventually a push back into the upper supply zone around 0.5800, which becomes the primary bullish target. Fresh liquidity is building above recent highs, providing the fuel needed for an upside continuation.
Overall, the market shows signs of accumulation, higher lows, and smart-money support, favoring a bullish continuation as long as price remains above the major demand zone.

HYPEUSD - Rounded Top Turned BullishAn example of a rounded top forming
These tend to break out bullishly once finished forming which I have shown with the bars pattern in green
It will be awhile most likely until breakout occurs as the rounded top isn't finalized
This is the 4Hr chart but the Rounded formation can be seen forming on the daily easily enough

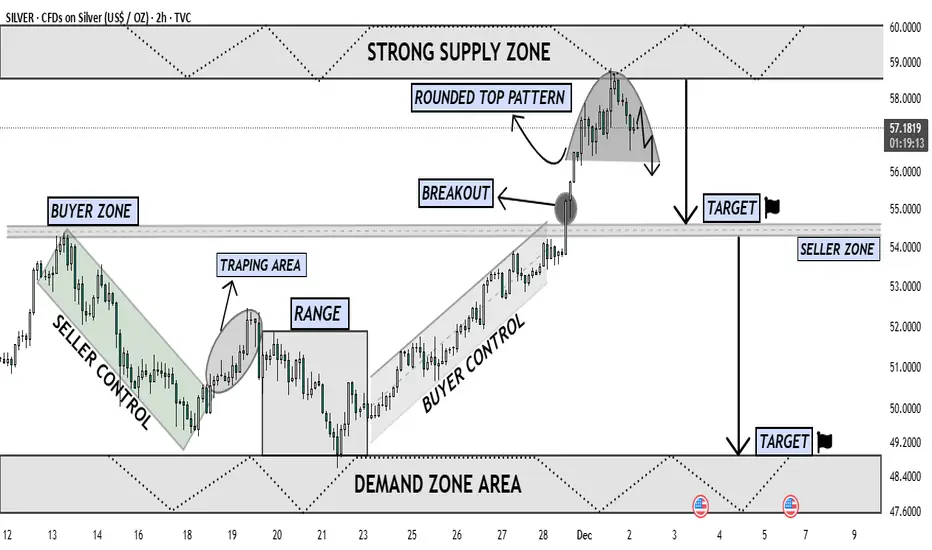
Silver Forming Major Top Near Supply Downside Retracement LikelyThe chart shows Silver reaching a major Strong Supply Zone near the 58–60 level, where price has reacted multiple times in the past. After a strong impulsive rally driven by Buyer Control, the market broke above the previous Buyer Zone, confirming bullish strength. However, once price entered the upper supply region, momentum started to fade, forming a clear Rounded Top Pattern — a classic distribution structure indicating exhaustion of buyers.
Following the breakout retest, buyers failed to continue upward, and sellers stepped in aggressively from the supply zone. The chart now shows a shift from buyer dominance to seller pressure, with price beginning to curve downward inside the rounded top. This shape reflects decreasing highs, weakening demand, and early reversal signals.
The projected move suggests that once the neckline of the rounded top breaks with strong bearish candle confirmation, price is likely to fall toward the first Target Zone around 54, which aligns with the Seller Zone and previous breakout structure. If bearish continuation remains strong, the next logical target lies in the Demand Zone Area between 48–49, where liquidity is expected to support a potential reversal or consolidation.
Overall, this chart indicates a high-probability corrective phase, with sellers preparing to reclaim control as the market rejects the supply zone and transitions into a deeper pullback phase. Buyers must show strong defense at the mid-support; otherwise, Silver could decline further toward the lower demand region.
TOTAL2 - Daily Rounded TopA Rounded Top structure
these patterns usually break out to the bullish side once completed as shown with the arrow
Right now this structure has perched itself above an MA and is looking to move higher
Good buy into alts right now in hopes of an altseason

USDCHF Confirms Rounded Top ScenarioOANDA:USDCHF is exhibiting a Rounded Top Pattern suggesting further decline is coming
Price is currently Breaking Confirmation of the Pattern
- RSI Below 50
- Bearish Volume Building
Waiting for a Break and Close to Validate a True Breakout
Once Validated, we can look for a Break and Retest Trade Set-up for Shorts from the .898 Area to take down to the Range Target ( .892 - .891 )

Is Altcoin Season STILL About to Begin in 2025?Looking at CRYPTOCAP:BTC.D , before the 2021 altseason kicked off, there were 3 key stages:
▍Stage 1: A steep rounded top formed.
▍Stage 2: Along the neckline of the rounded top, a rounded bottom developed.
▍Stage 3: BTC.D dropped sharply, triggering a crazy altseason.
For 2025, it seems we're about to enter Stage 3:
▍Stage 1: Again, a steep rounded top formed.
▍Stage 2: Just like before, a rounded bottom appeared along the neckline.
What’s different this time?
BTC.D just retested the neckline resistance zone for the second time yesterday.
After touching it, BTC.D formed a long lower wick, signaling strong rejection.
Now, it's all about watching the next moves.
If BTC.D mirrors Stage 3 from the last cycle, we could see a sharp drop soon.
And if that happens, the crazy altseason might start before anyone is ready.
🔴 for more future script "guesses" like this!
🔥 I've dropped another 2 analyses for the 2025 altseason on the right hand side if you're using computer, and scroll down a bit to see the link if you're using mobile.

AUDCHF price reversing,- new bullish?
OANDA:AUDCHF analysis, we are have ROUNDED TOP pattern, which is be confirmed last week on Friday, after Nonfarm and zone is be breaked.
But today on Monday, new week, can see price reversing and pushing again back in zone, after this moves expecting to see stronger higher bullish push in this week.
SUP zone: 0.56200
RES zone: 0.57000, 0.57200

Rounded Top for Hess MidstreamNYSE:HESM Hess Midstream LP may be forming a rounded top targeting ~$11, near where it pivoted bullish around April of 2020 after correcting from its March 2020 lows.
Confluence - OBV has been dropping into the rounded top, and recently dropped sharply while bearish volume has risen as it starts to round off.
Hess has been known for dividend payouts north of 6%. A scenario like this could create a future buying opportunity.

DAX Short - High Probability Current Macro Environment is very bearish:
Inverted Yield Curve :> showing that Market Participants are forecasting that rates are being cut in the future
Purchasing Manger Indexes are at contractionary levels - combined with the current situation in the money market - I do not expect that the real economy is going to relief from here
Current Technical Analysis is very likely to turn:
We are sitting at the golden pocket, range high and are currently forming an rounded top
I am expecting an fakeout H&S with early shorts getting stopped
Even if we have already formed an bottom - it is very unlikely that we go trough this level without an rejection
I am expecting at minium that we are able to take at least 1 take profit until it might turn more to the upside

USDCAD Buy Opportunity- I am expecting some bullish pressure of the USD this week.
- Price may may a final bearish push that may create a bearish reversal pattern, testing the below area of support
- From there price will test the previous area of support which created the above head and shoulder (or triple top) before it broke below.
-This move is just a retracement to test that area before possibly dropping lower.
-Looking for price to test the 1.35 area.
Please, like or comment your idea/analysis !

Rounded structure on BTC PA bearishWe have a little upward rounded structure on the BTC price action, accompanied by a downward rounded structure on Volume.
Besides being a bearish divergence, rounded structures like this I have found to be especially reliable bearish indicators.
The curve signals buying power is increasingly losing strength, reaching a plateau at the pricepoint where it flattens out at the top, where it opens the door for selling power taking the upper hand.
For short-term traders a good opening for short positions, imo, as with the decrease in volume its hard to imagine a sudden buyers impulse at this point in the PA.
**as im writing this, I see a drop in price is already playing out. Could consider this as a confirmation**

ES OutlookES seems to be in a fractal pattern, copying previous price action (the "great recession"). I think it will most likely bounce a bit and then continue downward as world war 3 breaks out. Eventually, it will recover and continue upward - as usual.

BTC Distribution Event: Wyckoff Rounded TopCOINBASE:BTCUSD BTC looking like it wants to retest previous resistances most likely the 53k - 55k region. This is based off of the Richard Wyckoff Theory of Distribution. Bearish short to mid term but long term this is a healthy correction.

Watching for an inverse cup and handle BTC is caught in a rounded top formation. Look for it to retest the curved resistance and form an inverse cup and handle. If it does happen to play out, BTC will likely dip just below $40k. Might be a good place to take a long position.

BNB Rounded TopBNB has made a rounded top pattern. If it clearly breaks below 443, I would expect a drop to 435-420

USOIL /CL ShortSeeing a rounded top on crude oil right now after a pretty solid run... Definitely raises the odds for a good short at these levels. Target would be the 200 SMA in pink, which could mean a near 20% drop in gas prices... that would be nice!
*Opinion only, Not financial advice*

MGM Ready to Short?NYSE:MGM has a big rounded top pattern that looks ready to break. Today's bar pierced through the trendline convincingly and I think it is ready for a big drop.

DJI Short ... I am still short in DJI unless it will go above 35k and stay there for a while. Current candle formations suggest to me further downtrend. This white candle which may suggest sudden north direction seems to me fake as wedding cake...
I would consider closing postiion when it will touch the EMMA

BTC x Rounded TopLooking at the Daily BTC chart, what do you see?
Many see what they believe to be the peak/top of this bull cycle...
In my opinion, this would look much more "V" like if it that were indeed the case. With that said, I believe that we are looking at a "Rounded Top Pattern". See details below and let me know if you agree!
Rounding Top: Important Bull Market Results
Overall performance rank for up/down breakouts (1 is best): 2 out of 39/3 out of 36
Break even failure rate for up/down breakouts: 9%/20%
Average rise/decline: 55%/17%
Throwback/pullback rate: 63%/58%
Percentage meeting price target for up/down breakouts: 58%/14%
The above numbers are based on more than 950 of perfect trades. See the glossary for definitions.
Rounding Top: Identification Guidelines
Characteristic Discussion
Weekly or daily Rounding tops are large enough to appear on the weekly or daily chart.
Price trend Upward leading to the chart pattern.
Even ends The rims of the inverted bowl bottom near the same price, but 58% of the time the end is slightly higher than the start.
Rounded turn Prices form a gentle curve, a half moon shape.
Breakout A close above the highest high signals an upward breakout. Downward breakouts are a close below the lower of the two rims (the lowest low in the pattern).
Rounding Top: Trading Tips
Trading Tactic Explanation Rounding top measure rule
The Measure Rule
Rounding top retrace
Retrace
Measure rule Compute the height from the highest peak in the pattern (point A in the Measure Rule figure to the right) to the right rim low (B) and then multiply it by the above 'percentage meeting price target.' Add it to the price of the highest peak (A, upward breakouts) or subtract it from the right rim low (B, downward breakouts) to get a target price (C).
32% retrace For aggressive traders, if price retraces 32% of the rounding top's height, buy. The Retrace figure to the right shows an example. Measure the height from A to B and then take 32% of this. Add it to the low at B to get a target of C. C represents the buy price.
Support The two rims are support areas.
Height Tall patterns perform better than short ones.
Breakout volume Heavy breakout volume suggests better performance.
Right rim When the right rim is above the left, the pattern under performs. The Retrace figure to the upper right shows an example, with the right bottom (B) above the left (D).
Yearly low Performs slightly better when the breakout is within a third of the yearly low but samples are few (6 only).
Throwbacks and pullbacks Throwbacks and pullbacks hurt post breakout performance.
thepatternsite.com

DJI short simple setupVery simple entry
GAP is holding any gains
on 1H we can see rounded top with multiple Doji candles
TP area is set up close to recent lows
All this is aligned with Fibonacci 78.60%

BTCUSDT - Reverse Bar Pattern - 3HR - Bitcoin is trading in the lower trendline area of this rising channel.
A rejection at $65K and a break down of the channel could see this play out.... and we have all seen a rounded top.
I

BTC: $55k | Smart Money Building SHORT POSITION | 38k & 23k Gapsthe last pump should be massive to lock in gains and buy back at key levels...
in addition gaps in the futures look huge to re fill or settle
$38k & $23k should be ideal for shorts to cover
