Long NIO into earningsChinese equities have been in an uptrend lately. Aside from long term investments like NYSE:BABA and NASDAQ:JD it might be nice to capture trading profits on smaller, more speculative names.
I've started such a position on NYSE:NIO via call options, dated to expire just after earnings. My theory is it can climb into the earnings announcement, especially with the momentum Chinese stocks as a tailwind.
NIO's technical setup
a rounding bottom
bullish momentum
time to appreciate on pre-earnings optimism
attractive risk/reward profile
Rsidivergence

Bullish DivergenceSMCI Analysis
Closed at 30.16 (09-01-2026)
No clear Trend but there is a Bullish Divergence on daily tf.
A slight upside is expected if 28 is not broken;
35 - 36 should be touched once if 28 - 29 is sustained.
The Upside may continue if 35 - 36 is crossed with Good Volumes.

AUDUSD at 15-month high: Breakout or wedge trap?In today's video, we break down why the Australian dollar rallied to a 15-month high at 0.6767 despite a drop in Australian inflation to 3.4%. We analyse the confusing mix of fundamentals—including a hawkish RBA, surging iron ore prices on China stimulus hopes, and a broadly weaker US dollar—against rising geopolitical tensions following China's dual-use export ban to Japan.
Technically, the Aussie is forming a potential rising wedge pattern with double RSI divergence. We explain why 0.6700 is the critical line in the sand: holding it keeps the bullish "buy the dip" scenario alive, while a break below could trigger a correction toward the 0.6590 Fibonacci cluster. Watch to see if we get a Head and Shoulders top or a continuation into 2026.
Key drivers:
Inflation vs. RBA : Why a 35% chance of a February hike remains despite cooling CPI.
China stimulus :How PBOC liquidity plans are driving iron ore to 4-month highs.
Technical analysis : Mapping the "spinning top" candle, RSI divergence, and the critical 0.6700 support level.
Trade scenarios : Bullish continuation vs. bearish reversal targets at 0.6634 and 0.6593.
Are you buying the dip at 0.67 or fading the rally? Let us know in the comments!
This content is not directed to residents of the EU or UK. Any opinions, news, research, analyses, prices or other information contained on this website is provided as general market commentary and does not constitute investment advice. ThinkMarkets will not accept liability for any loss or damage including, without limitation, to any loss of profit which may arise directly or indirectly from use of or reliance on such information.

Market Phases Explained: Accumulation, Expansion, Distribution🔵 Market Phases Explained: Accumulation, Expansion, Distribution, Reset
Difficulty: 🐳🐳🐳🐳🐋 (Advanced)
Markets do not move randomly. They rotate through repeatable phases driven by liquidity, psychology, and participation. Understanding market phases helps traders stop forcing strategies and start trading in alignment with the current environment.
🔵 WHY MARKET PHASES MATTER
Most traders struggle not because their strategy is bad, but because they apply it in the wrong market phase.
Breakout strategies fail in accumulation
Mean-reversion fails during expansion
Trend-following fails in distribution
Reversal trading fails before reset is complete
Market phases explain when a strategy works, not just how .
Price action, indicators, and volume behave differently in each phase.
🔵 THE FOUR MARKET PHASES
Markets move in a repeating cycle:
Accumulation
Expansion
Distribution
Reset
Each phase has unique characteristics, risks, and opportunities.
🔵 1. ACCUMULATION (QUIET POSITIONING)
Accumulation occurs after a decline or prolonged sideways movement.
This is where smart money builds positions quietly.
Key characteristics:
Price moves sideways in a range
Volatility is low
Breakouts frequently fail
Volume is stable or slightly rising
What is really happening:
Large players accumulate positions without moving price too much. Liquidity is absorbed.
Indicator behavior:
RSI oscillates between 40 and 60
MACD hovers near the zero line
Volume spikes are quickly absorbed
Best strategies:
Range trading
Mean reversion
Patience and preparation
🔵 2. EXPANSION (TREND DEVELOPMENT)
Expansion begins when price breaks out of accumulation with conviction.
This is where trends are born.
Key characteristics:
Strong directional movement
Increasing volatility
Pullbacks are shallow
Breakouts follow through
What is really happening:
Accumulated positions are now leveraged. Momentum attracts participation.
Indicator behavior:
RSI holds trend zones (40–80 or 20–60)
MACD expands away from zero
Volume increases during impulse moves
Best strategies:
Trend-following
Pullback entries
Breakout continuation
🔵 3. DISTRIBUTION (QUIET EXITING)
Distribution occurs after an extended trend.
Price may still rise, but momentum starts to weaken.
Key characteristics:
Higher highs with weaker follow-through
Increased wicks and failed breakouts
Volatility becomes unstable
Late buyers get trapped
What is really happening:
Smart money distributes positions to late participants while maintaining the illusion of strength.
Indicator behavior:
RSI diverges or fails to make new highs
MACD histogram shows lower highs above zero
Volume spikes near highs
Best strategies:
Profit protection
Reduced position size
Waiting for confirmation of weakness
🔵 4. RESET (LIQUIDITY CLEARING)
Reset is when the previous trend fully unwinds.
This phase clears excess leverage and weak hands.
Key characteristics:
Sharp moves against prior trend
Stop-loss cascades
Emotional price action
High volatility without clear direction
What is really happening:
Leverage is flushed. Weak positions are forced out.
Indicator behavior:
RSI reaches extreme levels
MACD crosses zero decisively
Volume spikes dramatically
Best strategies:
Capital preservation
Waiting for stabilization
Avoiding prediction
🔵 HOW TO IDENTIFY THE CURRENT PHASE
Ask these questions:
Is price trending or ranging?
Are breakouts succeeding or failing?
Is momentum expanding or contracting?
Are indicators confirming or diverging?
No indicator works in all phases. Phase identification is the real edge.
🔵 COMMON MISTAKES
Forcing trend strategies during accumulation
Chasing breakouts during distribution
Trading reversals before reset completes
Ignoring momentum deterioration
Most losses come from being right about direction but wrong about phase.
🔵 CONCLUSION
Markets move in cycles because human behavior and liquidity move in cycles.
Accumulation builds positions
Expansion rewards patience
Distribution traps late entries
Reset clears the board
When you learn to identify market phases, you stop fighting the market and start working with it.
Which market phase do you find hardest to trade? Accumulation, expansion, distribution, or reset? Share your thoughts below.

Kiwi in 5th wave, then buy-the-dip?Kiwi looks to have put in a provisional bottom around 0.5570 and is grinding higher toward the 0.58 handle, a key resistance zone that could either cap this fifth wave or unlock further upside.
In this video, we look at how a weaker US dollar and a slightly more hawkish RBNZ are supporting NZD/USD, and why 0.58 is such an important decision point. We then map out the buy‑the‑dip zone for a potential continuation higher and the levels that would flip the script to shorts.
Key drivers
RBNZ recently cut by 25 bps but signalled the easing cycle is likely over, while new governor Anna Breman is perceived as relatively hawkish and focused on inflation, which helps underpin the Kiwi.
Fed December cut odds around 85–90% after a run of softer US data keep the dollar under pressure, providing a tailwind for NZDUSD on rallies and pullbacks.
On the 4‑hour chart, price is pushing up toward 0.58 with emerging RSI divergence, suggesting this move is likely a fifth wave into resistance and setting up a corrective pullback rather than an immediate trend reversal.
Primary idea : Look to buy the dip if price reacts lower from 0.58 into the 0.5690–0.5660 zone (between the 38.2% and 61.8% Fib of the latest leg and prior support), targeting 0.5910, 0.60 and potentially 0.61, while a break below ~0.5640 and the channel base would instead open the door to deeper downside and short opportunities.
Trading Kiwi here? Share how you’re planning to trade the 0.58 resistance and buy‑the‑dip zone in the comments, and follow for more macro‑plus‑technicals swing setups.
This content is not directed to residents of the EU or UK. Any opinions, news, research, analyses, prices or other information contained on this website is provided as general market commentary and does not constitute investment advice. ThinkMarkets will not accept liability for any loss or damage including, without limitation, to any loss of profit which may arise directly or indirectly from use of or reliance on such information.

S&P500 crashes! Due relief rally or further pain?Nvidia delivered impressive earnings, but the stock reversed and closed nearly 3% lower, triggering heavy selling across tech and risk assets as odds for a December rate cut have collapsed to just 34%, with policy uncertainty amplified by the cancelled October NFP report. Despite a strong market and rising unemployment in September's NFP report, traders remained defensive and fuelled the declines.
Key drivers:
Nvidia beat earnings, but post-report selling intensified sector losses.
The Fed’s odds for a December rate cut have dropped to 34%, amplifying caution.
The abrupt cancellation of the October NFP means the market lacks fresh labour data, fuelling defensive positioning.
S&P 500, Nasdaq, and Bitcoin broke major supports, confirming risk-off conditions.
Right now, the S&P 500 has broken below channel support near 6,600 and failed to climb back in. If prices stay below this threshold, expect another sharp move lower targeting 6,500 and possibly 6,350. There’s potential for upside, given momentum divergence on the RSI 4-hour chart. If we see a short-term bounce and a return to the channel, a move toward 6,682 is possible, which sets up a tactical short opportunity.
Trade idea:
Entry: Midpoint of 23.6/38.2 Fibonacci (6,655–6,682 area)
Stop-loss: Above 61.8% Fib (6,775)
Take Profits: TP1 6,500 (recent low/support), TP2 6,440 (major support), TP3 trail stop to 6,170 (long-term support)
Risk-off drivers are in control. Earnings reversals, Fed uncertainty, and cancelled NFP data are fuelling this price action. Technically, it comes down to whether we see a return inside the channel for a relief bounce or a sharp continuation downward.
Watch your levels, remain nimble, and let fundamentals and technicals, not emotions, guide your trade.
Let me know your setups in the comments, and follow for more high-action technical and macro trade ideas.
This content is not directed to residents of the EU or UK. Any opinions, news, research, analyses, prices or other information contained on this website is provided as general market commentary and does not constitute investment advice. ThinkMarkets will not accept liability for any loss or damage including, without limitation, to any loss of profit which may arise directly or indirectly from use of or reliance on such information.

COPPER / GOLD & ISM PMI = Critical For AltseasonBeen seeing a lot of commentary on COPPER / GOLD.
This is a strong indication of industrial growth in the economy, as the demand for copper rises with build-outs.
The ISM PMI has a very strong correlation with C/G, also showing strength in the economy, as consumers buy more which gives businesses the ability to expand operations.
In a nutshell, these charts portray “Retail” ie “Main Street”.
There’s a very real possibility that we do not get our typical Alt Season at all this cycle if C/G & ISM PMI do not have a violent move up in the next few months. (more on this later)
The last time we saw such a divergence between these two was in January 2016 where it took C/G ~230 days to turn-up.
This would put Alt-Season Q4 ’26 - Q1 ’27, which makes sense theoretically based on Trump’s suspected stimulus plans which would come right before mid-terms.
This would give us our typical year-long bear market which has snuck up on us all because we lacked the retail euphoria phase due to very weak retail participation.
HOPIUM:
In 2016 When the ISM climbed above 50, COPPER soon found a bottom and Alts ripped.
Notice the bullish divergence on the RSI during that time, same as we are seeing now.
It looking like C/G may have found a bottom on this multi-decade parallel channel.
*Our livelihood depends on the ISM showing immense strength in the coming months so that C/G can follow.

Mastering RSI: A Complete Guide to Momentum🔵 Mastering RSI: A Complete Guide to Momentum, Regimes, Reversals & Professional Signals
Difficulty: 🐳🐳🐳🐳🐋 (Advanced)
This article goes far beyond the basic idea of “RSI = overbought/oversold.” If you want to truly master RSI as a momentum gauge, trend filter, reversal tool, and structure confirmation model, this guide is for you.
🔵 WHY MOST TRADERS MISUSE RSI
Most traders use RSI in the simplest way:
RSI above 70 = sell
RSI below 30 = buy
This leads to shorting strong trends and catching falling knives.
RSI is not a reversal button. RSI is a momentum translator.
To master RSI, you must understand:
Trend regimes
Momentum pressure
Acceleration and deceleration
Failure swings
Divergences
Trend vs range behavior
Multi-timeframe alignment
Structure confirmation
RSI shows the strength behind price, not just extremes.
🔵 1. RSI TREND REGIMES (CORE FOUNDATION)
RSI moves in predictable zones depending on the type of market environment.
Bullish RSI Regime
RSI holds between 40 and 80
Pullbacks bottom around 40–50
Breaks above 60 show trend acceleration
Bearish RSI Regime
RSI holds between 20 and 60
Pullback tops form around 50–60
Breaks below 40 confirm bearish dominance
These regimes tell you who controls the market before you even look at candles.
🔵 2. MOMENTUM PRESSURE (RSI AS A SPEEDOMETER)
RSI measures the speed and pressure of price movement.
Rising RSI with rising price = trend acceleration
Falling RSI with rising price = momentum weakening
Rising RSI with falling price = early strength
Falling RSI with falling price = continuation pressure
This is not divergence. It is momentum pressure, the earliest sign of trend shift.
🔵 3. FAILURE SWINGS (THE MOST RELIABLE RSI REVERSAL SIGNAL)
Failure swings are powerful because they show internal momentum breaking before price reacts.
Bullish Failure Swing
RSI makes a low
RSI rallies
RSI dips again but stays above previous low
RSI breaks the previous high
Bearish Failure Swing
RSI makes a high
RSI pulls back
RSI rallies but fails to break the previous high
RSI breaks the previous low
Failure swings often appear at trend tops and bottoms before candles reveal anything.
🔵 4. DIVERGENCES (REGULAR AND HIDDEN)
Regular Divergence: Reversal Clue
Bullish: price lower low, RSI higher low
Bearish: price higher high, RSI lower high
Hidden Divergence: Trend Continuation
Bullish hidden: price higher low, RSI lower low
Bearish hidden: price lower high, RSI higher high
Hidden divergence is more powerful than regular because it confirms trend continuation.
🔵 5. RANGE RSI VS TREND RSI
RSI behaves very differently in ranges versus trends.
Range Environment
RSI oscillates between 30 and 70
Reversals at extremes have high accuracy
RSI 50 is the equilibrium
Trend Environment
RSI stays above 50 in bullish trends
RSI stays below 50 in bearish trends
30 and 70 extremes lose meaning
Always identify environment first. RSI signals change depending on regime.
🔵 6. RSI AS A STRUCTURE FILTER
RSI combined with structure improves trade selection dramatically.
Price makes higher highs + RSI rising = healthy trend
Price makes higher highs + RSI flat = weak breakout
Price makes higher highs + RSI dropping = exhaustion
Support retest + RSI 40–50 = strong continuation potential
Most false breakouts are avoided simply by checking RSI pressure.
🔵 7. MULTI-TIMEFRAME RSI ALIGNMENT
Use higher timeframe RSI to validate lower timeframe setups.
HTF RSI bullish + LTF RSI pullback = high-quality entry
HTF RSI bearish + LTF RSI bounce = premium short area
HTF RSI crossing 50 = long-term regime shift
This is one of the most powerful RSI confluences.
🔵 EXAMPLE TRADING FRAMEWORK
Bullish Setup Checklist
RSI in bullish regime (above 50)
Pullback into 40–50 zone
Hidden bullish divergence or failure swing
Structure forms a higher low
Bearish Setup Checklist
RSI in bearish regime
Rejection from 50–60 zone
Hidden bearish divergence or failure swing
Structure forms a lower high
🔵 COMMON RSI MISTAKES
Trading RSI extremes without trend context
Ignoring RSI regimes
Entering on regular divergences in strong trends
Not using RSI midline (50) as a regime filter
Relying only on overbought/oversold signals
🔵 CONCLUSION
RSI is one of the most powerful indicators when used correctly. It provides a complete framework for:
Reading trend strength
Tracking momentum pressure
Identifying early reversals
Trading continuation setups
Filtering breakout strength
Aligning multi-timeframe bias
Master RSI, and you gain a clearer view of momentum than most traders ever experience.
How do you use RSI? Do you prefer divergences, trend zones, or failure swings? Share your approach below!

Buy the bottom of the PayPal uptrendNASDAQ:PYPL is known to be a high value stock with a depressing valuation.
Investors are under optimistic due to the struggling performance the past several years after a dizzying rally during the pandemic.
Recently the stock rallied on earnings due to a deal with Open-AI. Shares quickly gave the spike back and headed lower along with a broader tech pullback on AI bubble fears.
NASDAQ:PYPL has now undercut a long term upward trend line. Judging by the past few times this has happened, it could be a fantastic setup. It looks like the downtrend was broken in late 2024 when the price bottomed on an RSI divergence. The shares seem to be coiling up for a big move, and have been for almost a year now.

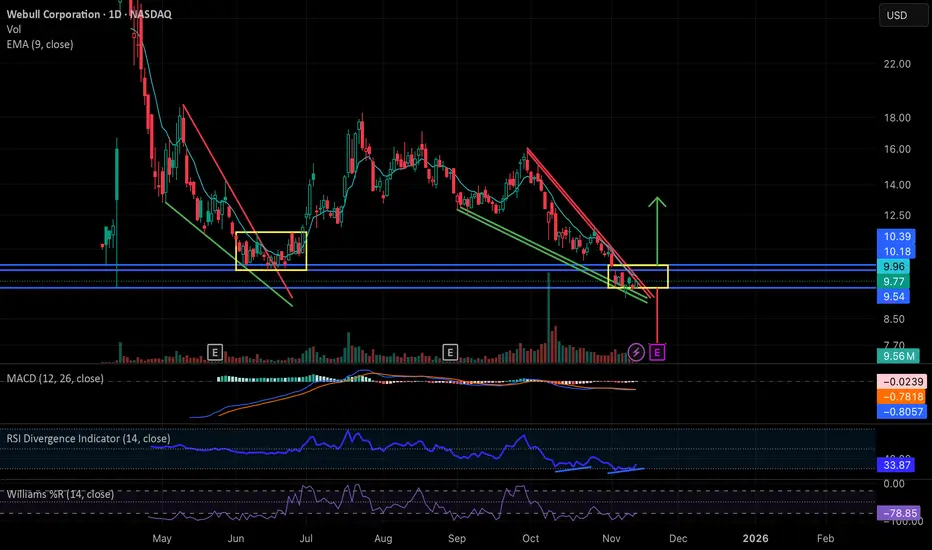
Webull: Falling Wedge Breakout ImminentNASDAQ:BULL has been in a steady decline essentially since the start of the government shutdown, forming a clean falling wedge structure very similar to the setup we saw in May and June. Back then, the wedge resolved with a brief breakout but ultimately moved into a sideways consolidation inside the yellow range before finally lifting in late June/early July.
Price is now sitting at the apex of a new wedge right as the government has officially reopened, almost to the day. With the president signing the bill, this may act as a macro green light for liquidity into year end, and BULL is positioned to potentially benefit from that.
Technically, the stock is deeply beaten down (roughly 40 percent from pre-shutdown levels), the MACD is starting to curl up, and there’s a clear daily RSI divergence. Together, these conditions make a relief move or breakout increasingly plausible.
If we don’t get a meaningful directional move between now and earnings on 11/20, then the most likely scenario is a replay of the May/June pattern: a period of sideways chop inside its current established support and resistance band zone around 9.54-10.18/10.39 while the market waits for the earnings catalyst. That report would then determine the next substantial move up or down.
In short: BULL is at a technical decision point, with momentum indicators improving, macro pressure easing, and earnings close enough that either a near-term wedge break or a consolidation-before-catalyst are both reasonable outcomes from here.
AVAX seems ready to pump, bullish on multiple chartsFrom what I can tell, AVAX seems to have bottomed out or at the very least is unlikely to go much lower. There's a bullish divergence on the monthly RSI vs BTC. Against gold AVAX definitely seems to have reached some sort of bottom.
And recently Trump had a huge pump, and I was curious to see how AVAX looks against trump and saw this on the daily, the price has hit the 200 daily moving average vs Trump so I'm curious how that is gonna play out too

USDJPY: A Divergence Play➡ USDJPY: A Broader Picture
The USDJPY pair has been consolidating within a descending triangle pattern, characterized by a flat base of support and a downward sloping resistance line. Each time the price rebounds from the support, it forms a lower high, indicating sustained selling pressure near the trendline.
In July 2024, the pair reversed sharply from 161.951, resulting in a decline of more than 13% from the top. A similar reaction occurred in January 2025 from 158.874, leading to an almost 12% drop. In both instances, the pair completely retraced the preceding rallies in 2024.
At present, USDJPY is once again trading near the descending trendline, suggesting the potential for another corrective move. However, it is essential to wait for confirming signals before establishing a directional bias.
➡ The RSI Divergence
RSI Divergence occurs when the movement of price and the Relative Strength Index (RSI) do not align, hinting at a possible trend reversal.
When price makes higher highs but RSI makes lower highs, it’s called a bearish RSI divergence, showing that buying momentum is weakening even though price is rising.
When price makes lower lows but RSI makes higher lows, it’s a bullish RSI divergence, suggesting that selling pressure is reducing and a potential upward reversal may occur.
In simple terms, RSI divergence warns traders that the current trend may be losing strength and a change in direction could be near.
➡ USDJPY and RSI Divergence
Historical observations suggest that whenever RSI divergence appears near the 70 level, the USDJPY pair tends to witness a sharp corrective move.
In November 2024, a bearish RSI divergence led to a 50% retracement of the prior bullish move.
In January 2025, a similar divergence preceded a complete retracement of the entire rally from September to December 2024.
Currently, a comparable divergence is forming once again. The price has made a new high, while the RSI has failed to confirm it, indicating a loss of bullish momentum.
In this backdrop, a price reaction appears likely. However, a decisive close below 153.250 would be needed to confirm a breakout failure, strengthening the bearish case. A small bounce from 153.250 can't be ruled out so, confirmation below this level is needed.
If this breakdown materializes, the next potential downside targets could be around 149.000 and eventually the 140.000 support zone
What are your views on the pair- bullish or bearish?
📣Disclaimer:
Everything shared here is meant for education and general awareness only. It’s not financial advice, nor a recommendation to buy, sell, or hold any asset. Do your own research, manage your risk, and make sure you understand what you’re getting into.

GBPUSD- A Matter of Divergence🔗 Market has Memory
The phrase 'the market has memory' stems from the observation that prices often react when they revisit previously significant levels- such as former highs, lows, or areas of intense trading activity. This phenomenon reflects not randomness, but the collective memory of market participants.
Investors and traders tend to remember key price zones where strong buying or selling once occurred. When the price returns to these levels, the same psychological triggers are reactivated: those who missed the prior move may see it as a renewed opportunity, while others who were previously trapped at that level may use the occasion to exit or reduce exposure.
Thus, these price zones acquire emotional and financial significance over time. The market’s so-called 'memory' is not inherent to the charts themselves, but rather a mirror of recurring human behavior- shaped by experience, regret, and anticipation - expressed through collective trading decisions.
💥 GBPUSD Technical Perspective
On the long-term GBPUSD chart, price has exhibited a clear tendency to respect the 1.31400 zone. This level has acted as a strong demand base twice- first in May 2025 and again in August 2025- each time resulting in a notable upward reaction. The pair has now retraced to the same region, suggesting that market participants continue to recognize 1.31400 as a historically validated support zone, a reflection of the market’s 'memory'.
The following two divergences further strengthen this bullish bias:
➥ RSI Divergence:
We can observe that the price made a lower low B but the RSI has failed to make a corresponding lower low. This indicates that downside momentum is weakening despite the price weakness. Such a bullish divergence often precedes a reversal or at least a corrective bounce, as it shows sellers losing strength.
➥ Volume Divergence:
Similarly the recent decline B occurred on diminishing volume compared to the earlier sell-off at A. Also when the price tested at C there is far less volume activity. This reduction in trading activity implies a lack of conviction among sellers. When prices fall but volume contracts, it suggests that the selling pressure is drying up - a potential precursor to demand resurgence and a price rebound.
👉 What to Expect
The confluence of a well-established support zone, RSI bullish divergence, and volume divergence strengthens the probability of a technical rebound from the 1.31400 area towards 1.32850 or 1.33250 zone.
However, a confirmed higher low or a bullish candle formation would offer more reliability before initiating long exposure. A decisive action below 1.31400 would negate this view.
📣 Disclaimer:
Everything shared here is meant for education and general awareness only. It’s not financial advice, nor a recommendation to buy, sell, or hold any asset. Do your own research, manage your risk, and make sure you understand what you’re getting into.
Your money, your responsibility; and if you’re unsure, ask a qualified financial professional. (Or at least run it by your pet - they’re great listeners 🐶).

How to Use The Relative Strength Index (RSI) in TradingViewMaster RSI using TradingView’s charting tools in this comprehensive tutorial from Optimus Futures.
The Relative Strength Index (RSI) is one of the most widely used momentum indicators in technical analysis. It helps traders identify potential overbought and oversold conditions, spot divergences, and confirm the strength of trends.
What You’ll Learn:
Understanding RSI: a momentum oscillator plotted from 0 to 100
Key thresholds: how readings above 70 suggest overbought conditions and below 30 suggest oversold conditions
Why RSI signals are not automatic buy/sell triggers, and how strong trends can keep RSI extended for long periods
Spotting bullish and bearish price divergences
Using RSI to confirm trends
How to add RSI on TradingView via the Indicators menu
Understanding the default inputs and how changing them affects the indicator
Example on the E-mini S&P 500 futures: how RSI dipping below 30 and crossing back above can highlight momentum shifts
Combining RSI with other analysis for better confirmation
Practical applications across multiple timeframes, from intraday trading to swing setups
This tutorial will benefit futures traders, swing traders, and technical analysts who want to incorporate RSI into their trading strategies.
The concepts covered may help you identify momentum shifts, potential reversal points, and confirmation of trend strength across different markets
Learn more about futures trading with TradingView:
optimusfutures.com
Disclaimer:
There is a substantial risk of loss in futures trading. Past performance is not indicative of future results. Please trade only with risk capital. We are not responsible for any third-party links, comments, or content shared on TradingView. Any opinions, links, or messages posted by users on TradingView do not represent our views or recommendations. Please exercise your own judgment and due diligence when engaging with any external content or user commentary.
This video represents the opinion of Optimus Futures and is intended for educational purposes only. Chart interpretations are presented solely to illustrate objective technical concepts and should not be viewed as predictive of future market behavior. In our opinion, charts are analytical tools—not forecasting.

Heres a GOOG Breakout SETUP!! (1HR)Still in a wedge, but my bias leans towards bullish. Watching for a clean breakout above 247.64 for confirmation.
My Targets are 247.64 → 251.65 → 254.77
⚠️ This is not financial advice just my personal analysis. Always do your own research before trading or investing.

Gold breaks records and tops out: Where next?Gold achieved a historic breakthrough to $3,759 per ounce, potentially driven by an unusual "barbell strategy" where investors simultaneously bought risk assets while hedging against systemic risks.
On the one hand, continued expectations for two additional rate cuts by year-end supported non-yielding assets. On the other hand, political uncertainty increases as Trump prepares to meet with lawmakers on funding proposals. The probability of a Gov shutdown approaches 70% by October 1st, which would force the FOMC into a 'blind' meeting in October.
Technicals
The short-term setup shows a double top formation at $3,759, suggesting potential consolidation rather than immediate continuation.
Resistance Levels : $3,800 is a critical resistance, both a Fibonacci extension cluster and a psychological level
Support Levels :
Immediate support at $3,740 (breakout confirmation level)
Secondary support at $3,700-$3,730 (previous consolidation zone)
Deeper pullback potential to $3,673 (61.8% Fibonacci retracement)
Wave Structure : Elliott waves suggest completion of a potential Wave 3, with consolidation expected before a possible fifth wave extension toward $3,785-$3,800
Forward Outlook
The setup favours consolidation over the remainder of the week, with key events including Fed Chair Powell's speech and Friday's PCE inflation data serving as potential catalysts for the next directional move.
The momentum divergences suggest limited downside risk from current levels, making any pullback toward $3,700-$3,740 a potential buying opportunity for the anticipated final leg higher toward the $3,800 resistance zone.
Risk management remains crucial given the proximity to potential reversal levels and the unusual nature of gold's correlation with equity strength.
This content is not directed to residents of the EU or UK. Any opinions, news, research, analyses, prices or other information contained on this website is provided as general market commentary and does not constitute investment advice. ThinkMarkets will not accept liability for any loss or damage including, without limitation, to any loss of profit which may arise directly or indirectly from use of or reliance on such information.

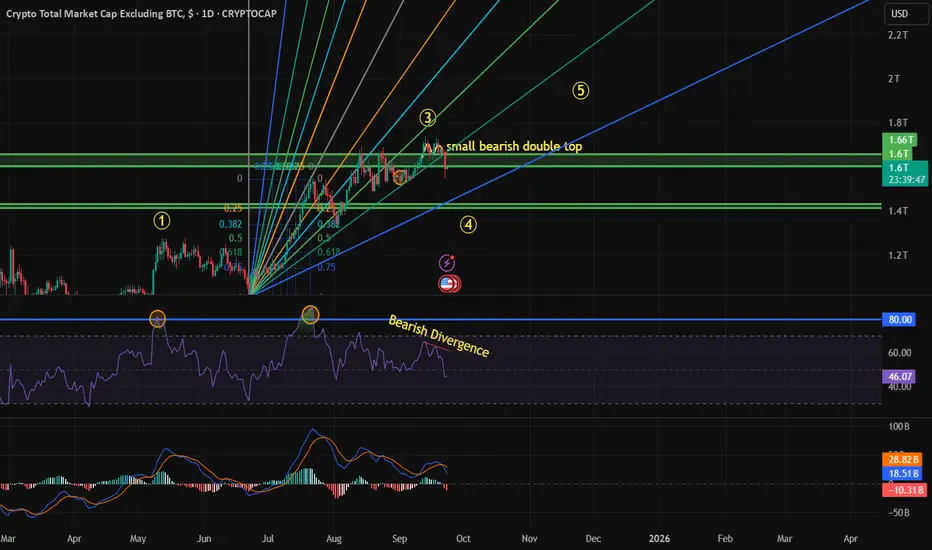
Altcoin Market Correction Underway – Final wave is coming!The total crypto market cap excluding BTC has likely completed Wave 3. At the end of Wave 3, a small bearish double top appeared, and the RSI confirmed weakness with a bearish divergence. During Wave 1, the RSI crossed 80. During Wave 3 going up, the RSI crossed 80 again and reached 86, which indicated that the uptrend would continue. However, at the peak of Wave 3, the divergence suggests exhaustion.
On the Fibonacci speed resistance band, drawn from the end of Wave 2, the price already broke below the 0.618 level. At the same time, BTC dominance broke its downtrend line and increased by more than 1 percent and breaking 0.618 fib resistance, showing capital rotation back to Bitcoin.
All these signals point to the start of Correction wave, the nearest strong support is the 1.42-1.43 trillion (speculative to reach those levels) bulls could push higher before reaching those, BTC correction wave is still ongoing aswell
XAU/USD Update 1Next move on the way focus on proper risk management & stay disciplined. Wishing you successful trades..!
Confluences & Key Reason:
1. Gold has tested the resistance level, where selling pressure is expected , from this zone a possible down side move towards 3357 - 3344.
2. Also 1H SIBI still in pending. Let's see how it will work.
This is not a financial advice. This setup is a little bit risky, due to recent volatility. On higher time frame the structure was bullish.

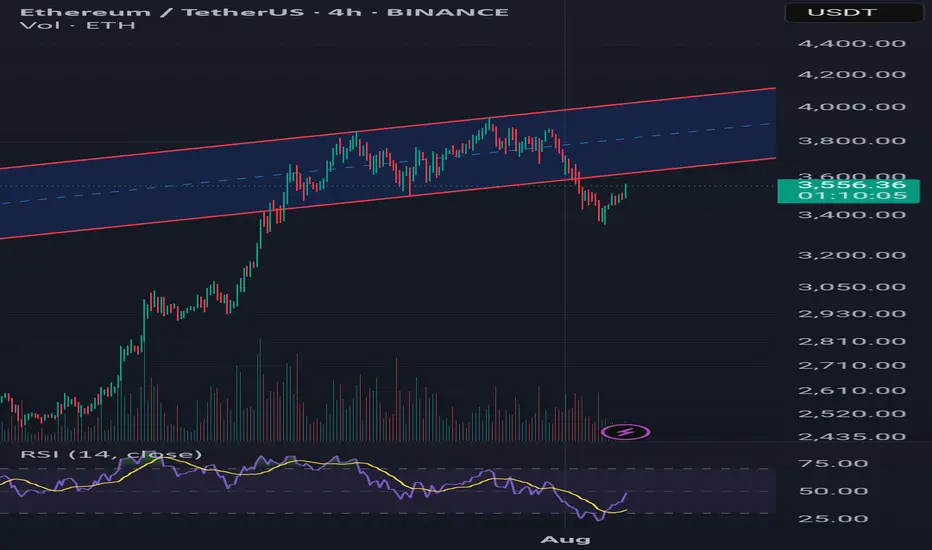
Ethereum at Critical Retest – Pullback or Breakout?Ethereum saw a sharp rally followed by a steady climb inside a rising channel. Recently, price broke below the channel’s lower boundary, signaling potential weakness. Now, ETH is retesting the broken trendline, which could be a classic pullback scenario.
Scenario 1 – Bearish Continuation:
If ETH fails to reclaim the channel and rejects around $3,600–$3,650, selling pressure may return.
Potential targets: $3,400 → $3,250 and, in extension, $3,050.
RSI is recovering from oversold levels but still below midline, hinting at possible limited upside before another drop.
Scenario 2 – Bullish Reclaim:
A daily close above $3,650 with strong volume would invalidate the breakdown and suggest a false break.
In that case, ETH could re-enter the channel and aim for $3,850 and the upper boundary near $4,050.
Risk Management:
Bearish entry: Wait for rejection candle on retest → SL above $3,700.
Bullish entry: Wait for confirmed breakout above $3,650 with volume → SL below $3,550.
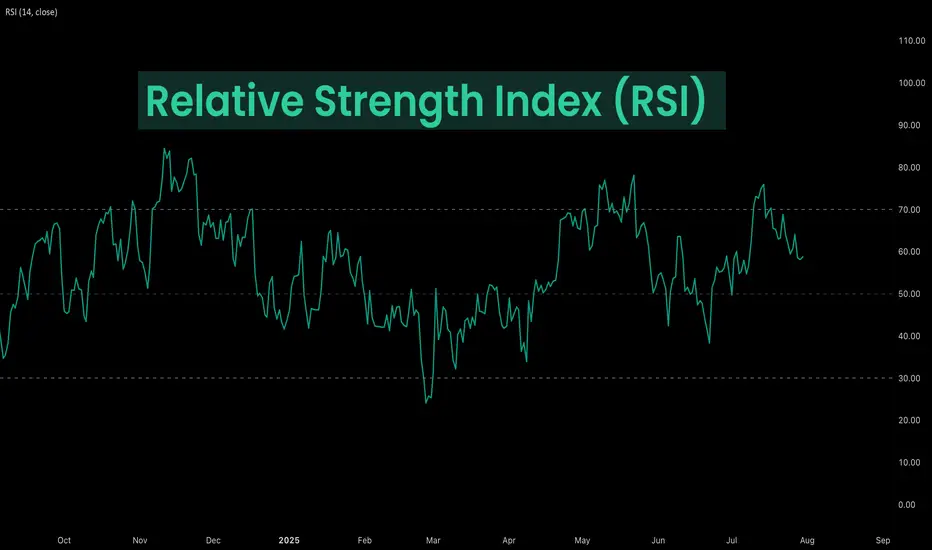
Deep Dive Into Relative Strength Index (RSI)The Relative Strength Index (RSI) is a momentum oscillator developed by J. Welles Wilder Jr. that measures the speed and magnitude of price changes.
Introduction
In the world of trading, timing is everything — and few indicators have stood the test of time like the Relative Strength Index (RSI). Introduced by J. Welles Wilder in 1978, the RSI is a momentum oscillator that helps traders evaluate the strength and speed of price movements. Whether you're trading stocks, forex, or crypto, understanding how RSI is calculated and how to interpret its signals can give you a critical edge.
In this article, we’ll break down exactly how the RSI works, explore its formula, and dive into practical ways you can incorporate it into your trading strategies. From spotting potential reversals to identifying overbought and oversold conditions, the RSI remains a cornerstone of technical analysis — but only if you know how to use it properly.
Let’s explore the mechanics and the mindset behind this powerful indicator.
What Is RSI and How Is It Calculated?
The Relative Strength Index (RSI) is a momentum oscillator that measures the speed and change of price movements over a defined period. It outputs a value between 0 and 100, which helps traders determine whether an asset is overbought or oversold.
The default RSI setting uses a 14-period lookback window and is calculated with the following steps:
🔷Calculate the average gain and loss over the last 14 periods:
Average Gain = Sum of all gains over the past 14 periods / 14
Average Loss = Sum of all losses over the past 14 periods / 14
🔷Compute the Relative Strength (RS):
RS = Average Gain / Average Loss
🔷Apply the RSI formula:
RSI=100−(100/(1+RS))
The result is a single number between 0 and 100 that indicates the asset's momentum.
How to Use RSI in Trading Strategies
⚡️Overbought and Oversold Conditions Strategy
RSI > 70 typically signals that an asset may be overbought and due for a pullback.
RSI < 30 suggests the asset might be oversold, potentially primed for a bounce.
However, these levels aren’t absolute sell or buy signals. In strong trends, RSI can stay overbought or oversold for extended periods.
📈Long Trading Strategy Example:
1. Identify the major trend, to find the long trades it shall be uptrend. On the screen below you can see 1D time frame for BITMART:BTCUSDT.P .
2. Move to lower time frame (in our case 4h) and find the moment when RSI falls below 30. This is our oversold condition and we are going to look for long trade.
3. Find the local support zone and open long trade.
4. Take profit when price reaches resistance level next to the previous swing high
5. Don’t forget to put initial stop loss when enter position. The best stop loss which will give you 3:1 risk to reward ratio.
📉Short Trading Strategy Example
1. Identify the major trend, to find the short trades it shall be downtrend. On the screen below you can see 1D time frame for BITMART:ETHUSDT.P .
2. Move to lower time frame (in our case 4h) and find the moment when RSI grows above 70. This is our overbought condition and we are going to look for short trade.
3. Find the local resistance zone and open short trade.
4. Take profit when price reaches support level next to the previous swing low
5. Don’t forget to put initial stop loss when enter position. The best stop loss which will give you 3:1 risk to reward ratio.
⚡️RSI Breakout Strategy
RSI is breaking through 60 indicating bullish momentum shift if the long-term trend is bullish can be the potential long signal
RSI is breaking down 40 indicating bearish momentum shift if the long-term trend is bearish can be the potential short signal
This strategy works great only on the trending market, don’t use it on the range bounded market to avoid whiplashes.
📈Long trading strategy example:
1. Make sure that long-term trend is bullish. Use 200 period EMA as its approximation. If price remains above it we can look for potential long trade setup.
2. If RSI crossed above the level 60 open long trade.
3. Put the initial stop-loss under the signal candle’s low.
4. Take profit when price reached 3:1 risk-to-reward ratio.
📉Short trading strategy example
1. Make sure that long-term trend is bearish. Use 200 period EMA as it’s approximation. If price remains below it we can look for potential short trade setup.
2. If RSI crossed below the level 40 open short trade.
3. Put the initial stop-loss above the signal candle’s high.
4. Take profit when price reached 3:1 risk-to-reward ratio. In our case we received very fast and profitable trade
⚡️RSI Divergence Strategy
RSI can be used also as a trend reversal indicator if we are looking for divergences. This is very reliable sign of current trend weakness and great opportunity open trade against the trend. Usually it’s not recommended, but in case if divergence can be applicable.
Bullish divergence is the situation when price created the lower low, while RSI made the lower low. Usually, it indicates that current downtrend is weakening and we can look for long trades
Bearish divergence is the situation when price created the higher high, while RSI made the lower high. Usually, it indicates that current uptrend is weakening and we can look for short trades
😎Important hint: it’s rarely covered in textbooks about technical analysis, but in our opinion it’s better to used divergences when RSI was able to cross level 50 between two lows/highs.
📈Long trading strategy example
1. Find at the chart situation, when the price made the lower low
2. At the same time RSI shall set the higher low
3. RSI shall break level 50 between these lows indicating shift to the bullish momentum
4. If price failed to set the clean breakdown open long trade on the candle which set the lower low. Put stop loss under it’s low
5. Take profit at 3:1 RR. When you master this concept, you will be able to have much more RR trades, even 10:1. This is possible because when trend finish you have the highest potential upside
📉Short trading strategy example
1. Find at the chart situation, when the price made the higher high
2. At the same time RSI shall set the lower high
3. RSI shall break level 50 between these highs indicating shift to the bearish momentum
4. If price failed to set the clean breakout open short trade on the candle which set the higher high. Put stop loss above it’s high
5. Take profit at 3:1 RR. When you master this concept, you will be able to have much more RR trades, even 10:1. This is possible because when trend finish you have the highest potential upside
Conclusion
The Relative Strength Index (RSI) remains one of the most powerful and flexible tools in a trader’s technical arsenal — but its real value lies in how you use it.
We’ve explored three key RSI strategies:
✅ Overbought/Oversold setups offer simple entry signals in ranging markets, where price tends to revert to the mean.
✅ Breakout strategies unlock RSI’s momentum-tracking potential, helping you ride strong directional moves with confidence.
✅ Divergence detection reveals hidden shifts in market sentiment, giving you an early warning of possible reversals or trend continuations.
Each approach has its strengths — and its risks — but together, they offer a complete framework for using RSI across different market conditions
🔑 Key Takeaways:
RSI is not just a “buy low, sell high” tool — it’s a multi-dimensional indicator that adapts to trends, momentum, and market structure.
The best RSI signals come from confluence: combining RSI with price action, support/resistance, volume, or trend filters like moving averages.
Patience and discipline are essential — RSI signals are only effective when paired with proper risk management and confirmation.
By mastering RSI beyond the basics, you'll be better equipped to make timely, confident, and informed trading decisions — whether you're entering a pullback, chasing a breakout, or spotting the early signs of reversal.
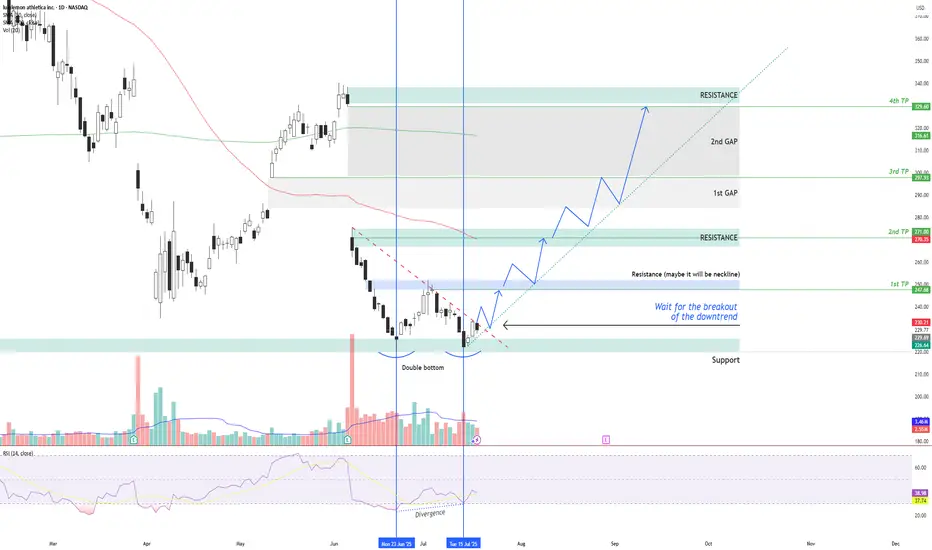
LULU – Double Bottom + RSI Divergence: Multi-Target Setup After LULU NASDAQ:LULU is showing signs of a potential bullish reversal after forming a double bottom structure around the $220 support zone , along with a bullish divergence on the RSI indicator.
Two vertical lines highlight the divergence: while price made a lower low, RSI formed a higher low – indicating a possible momentum shift in favor of buyers.
Currently, price is moving just below a descending trendline, which has been acting as dynamic resistance. The first condition for a long setup is a confirmed breakout above this trendline followed by a successful retest. If that happens, an entry can be considered .
📌 Entry Plan:
Entry: After a breakout and retest of the descending trendline.
1st TP: ~$247 — This level coincides with a local resistance zone, which may act as a neckline of the double bottom.
If price breaks above $247 and retests, it confirms bullish continuation.
📈 Target Structure:
2nd TP: ~$271 — next major resistance zone.
3rd TP: ~$297 — aligns with the first major gap zone.
4th TP: ~$329 — final gap resistance from previous sell-off levels.
This structure allows for scaling into the trade in stages — each breakout and retest offers a new confirmation and extension to the next target zone.
Volume analysis, price action, and RSI momentum all support the probability of a trend reversal — but confirmation is key.
Not financial advice. Always conduct your own research and risk management.
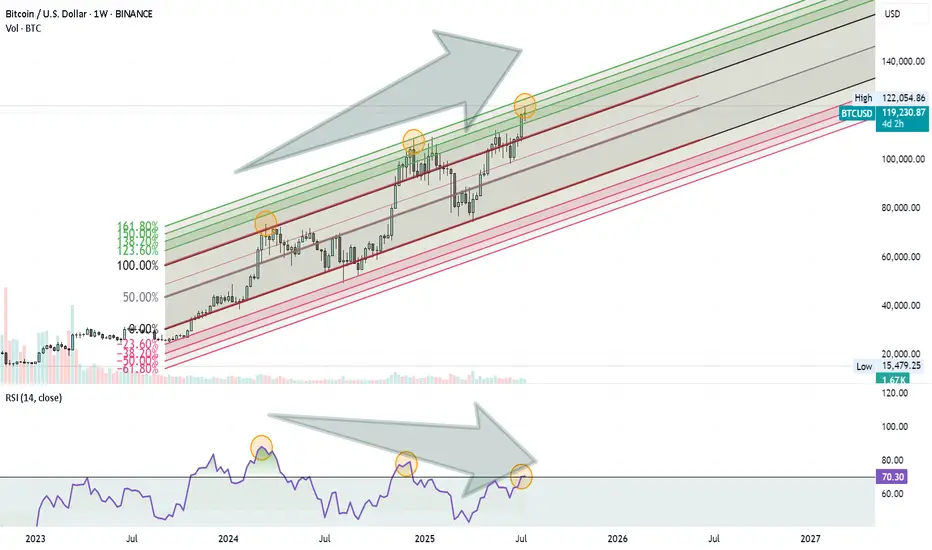
Bitcoin Rally Losing Steam?Bitcoin might be approaching a Turning Point . Here’s what I’m seeing on the weekly chart:
Price is moving inside an ascending Fibonacci channel.
It’s getting close to the 1.60 (160%) extension level, which has acted as a reversal zone before.
At the same time, the RSI is showing a clear negative divergence, suggesting that momentum is weakening.
These signs combined could mean we’re not far from a significant correction.
Nothing is confirmed yet, but it’s a setup worth keeping an eye on.
ETHEREUM for $750?In this chart, I am showing you the worst possible scenario. If we compare this cycle to the past, we see some very similar things on the weekly chart:
- Weekly RSI divergence
- Testing the 50-level RSI and the trend line from the bottom to the top
- Correction to the 0.5 fibbonacci level.
- Last time we had a war between Ukraine and Russia and now we have a war between Israel and Iran
- Last time everyone on X(twitter) was talking and cheering about Alt-Seoson and ToTheMoon and now we have the same situation, DYOR, check X
$750-800 for Ethereum are the lows of the two global channels. So it's a logical bottom. And after the price reaches the bottom, we can reach the top of the channel.
Hence after this mega-dump we will see #ETH at $18000-20000.
What do you think about this scenario?
