Russell 2000 Bullish Bias | Accumulation Before Expansion🎯 US2000 (Russell 2000) Index CFD | Bullish Swing Trade Setup 📈
🔥 MARKET OPPORTUNITY: Small-Cap Breakout Play 🔥
📊 TRADE PLAN OVERVIEW
Strategy: Bullish Accumulation → Resistance Breakout → Re-accumulation Zone
Timeframe: Swing Trade (Multi-day to weeks)
Technical Confirmation: Simple Moving Average (SMA) pullback creating accumulation zone + Overbought resistance breakout signaling continuation momentum
💰 ENTRY STRATEGY: "THIEF LAYERING METHOD" 💰
⚡ Multi-Limit Order Layering Strategy (DCA Style) ⚡
Instead of a single entry, we're using multiple buy limit orders to build our position strategically:
🎯 Layer 1: 2560
🎯 Layer 2: 2580
🎯 Layer 3: 2600
💡 Pro Tip: You can add MORE layers based on your capital and risk appetite! This "ladder entry" approach averages your cost and reduces timing risk during volatile accumulation phases.
🚨 OR: Market Entry Available - Jump in at ANY current price level if you prefer aggressive entry over layering!
🛡️ RISK MANAGEMENT
Stop Loss (Thief's SL): 2530 ⛔
⚠️ IMPORTANT DISCLAIMER:
Dear Ladies & Gentlemen (Thief OG's) 👋 - This is MY stop loss level based on technical invalidation. You are NOT required to follow my exact SL! Adjust according to YOUR risk tolerance, account size, and trading psychology. Trade at your own risk. Your money, your rules! 💪
🎯 PROFIT TARGETS
Target Zone (TP): 2660 🚀
🚔 "Police Force" Resistance Alert:
This level acts as strong resistance + overbought zone + potential bull trap area + correlation pressure point. Smart money takes profits here! Don't be greedy - ESCAPE WITH PROFITS when we hit this zone! 💵
⚠️ IMPORTANT DISCLAIMER:
Dear Ladies & Gentlemen (Thief OG's) 👋 - This is MY take profit target. You are NOT required to follow my exact TP! Scale out partially, move SL to breakeven, or hold for extended targets - it's YOUR choice. Your money, your decision! 🎲
🔗 CORRELATED ASSETS TO WATCH 📡
Monitor these pairs for confluence and risk-on/risk-off sentiment:
💵 TVC:DXY (US Dollar Index) - Inverse correlation; weak dollar = strong equities
📈 SP:SPX (S&P 500) - Broad market sentiment gauge
📊 NASDAQ:NDX (Nasdaq 100) - Tech-heavy index correlation
🏦 AMEX:IWM (iShares Russell 2000 ETF) - Direct ETF tracking Russell 2000
⚡ TVC:VIX (Volatility Index) - Fear gauge; rising VIX = caution for longs
🛢️ BLACKBULL:WTI (Crude Oil) - Risk-on asset correlation
💰 FX:USDJPY - Risk sentiment barometer; weakness supports equities
🏦 AMEX:XLF (Financial Sector ETF) - Russell 2000 has heavy financial exposure
📰 FUNDAMENTAL & ECONOMIC FACTORS 🌍
✅ Bullish Catalysts to Consider:
1️⃣ Federal Reserve Policy Easing 🏦
If Fed maintains dovish stance or signals rate cuts, small-caps (Russell 2000) typically outperform as they're more sensitive to borrowing costs
2️⃣ Economic Soft Landing Narrative 📉➡️📈
If inflation cools without recession, domestic-focused small-caps benefit heavily
3️⃣ Dollar Weakness 💵⬇️
Falling DXY supports risk assets; Russell 2000 tends to rally when USD weakens
4️⃣ Earnings Season Performance 📊
Monitor upcoming small-cap earnings reports; positive surprises fuel momentum
5️⃣ Banking Sector Stability 🏦✅
Russell 2000 has significant financial exposure; stable/rising financials = bullish for index
⚠️ Bearish Risks to Monitor:
1️⃣ Recession Fears 📉😰
Small-caps underperform during economic contraction; watch GDP, unemployment data
2️⃣ Fed Hawkish Surprise 🦅📈
Higher-for-longer rates hurt small-caps disproportionately (debt-heavy balance sheets)
3️⃣ Credit Market Stress 💳⚠️
Rising corporate bond yields or credit spreads = danger for leveraged small-caps
4️⃣ Geopolitical Tensions 🌍💥
Trade wars, conflicts = risk-off sentiment = exodus from small-caps
5️⃣ Strong Dollar Rally 💵🚀
DXY strength typically pressures equities, especially domestic-focused Russell 2000
📅 UPCOMING KEY EVENTS TO WATCH 🗓️
🔔 Fed Meeting Minutes/Speeches - Any policy shift hints
🔔 CPI/PPI Inflation Data - Inflation trajectory crucial for rate policy
🔔 Non-Farm Payrolls (NFP) - Employment strength = economic health gauge
🔔 Small-Cap Earnings Reports - Watch Russell 2000 component earnings
🔔 ISM Manufacturing/Services PMI - Economic activity indicators
🔔 Regional Banking Sector Updates - Financial stability matters for IWM
🎓 KEY TECHNICAL POINTS 🔍
✅ SMA Pullback = Healthy Accumulation - Price retracing to moving average shows institutional buying interest
✅ Overbought Breakout - Previous resistance becomes new support after successful break
✅ Re-accumulation Phase - Consolidation above breakout = continuation pattern
✅ Volume Confirmation - Watch for increasing volume on bullish moves (not shown but critical!)
✅ Risk-Reward Favorable - Layered entry provides cushion; defined exit at 2660
🚨 FINAL THIEF OG WISDOM 🚨
💎 "The market doesn't care about your entry price - it only cares about supply and demand."
📌 Risk Management > Being Right
📌 Patience > Precision
📌 Profits > Predictions
Not financial advice. Trade responsibly. Always use stop losses. Never risk more than you can afford to lose! 🛡️
🔥 LIKE + FOLLOW for more Thief OG setups! 🔥
💬 Drop your thoughts below - Are YOU bullish on small-caps? 💬
Russell2000

RTY: Small Caps Stuck Between Growth Optimism & Macro OutlookRTY Overview and Recent Macro Backdrop
RTY, or Russell 2000 futures, track the performance of the Russell 2000 Index, which represents approximately two thousand U.S. small cap companies. These constituents are drawn from the lower end of the Russell 3000 Index and typically reflect firms with smaller market capitalizations, greater domestic revenue exposure, and higher sensitivity to economic conditions than their large cap peers. The primary deciding factor for inclusion in RTY versus the S&P 500 is market capitalization. The Russell 2000 consists of the smallest two thousand companies within the Russell 3000, while the S&P 500 is a committee selected index composed of roughly five hundred large cap companies that must meet additional criteria such as profitability, liquidity, sector balance, and sustained earnings. Although market cap thresholds shift annually, Russell 2000 constituents generally fall well below the market cap range of S&P 500 companies and are reconstituted mechanically each year based on size rankings.
As the market settles into the new year, RTY has been trading within a more nuanced macro environment shaped by early year repositioning and reassessment of economic expectations. Price action over the past month has been increasingly influenced by evolving views on monetary policy, credit conditions, and the durability of U.S. growth. While recent inflation data has shown signs of moderation, it has remained uneven, keeping rate cut expectations fluid rather than fully priced in. This has limited sustained directional momentum in small caps, as higher borrowing costs continue to pressure balance sheets and earnings visibility. At the same time, resilient employment data and stable consumer demand have helped contain downside risk, allowing buyers to engage at value rather than chase extension. The result has been a rotational and range bound market structure, reflecting cautious positioning and a wait and see approach, with RTY acting as a battleground between early year growth optimism and ongoing policy and financing constraints.
What the Market has done
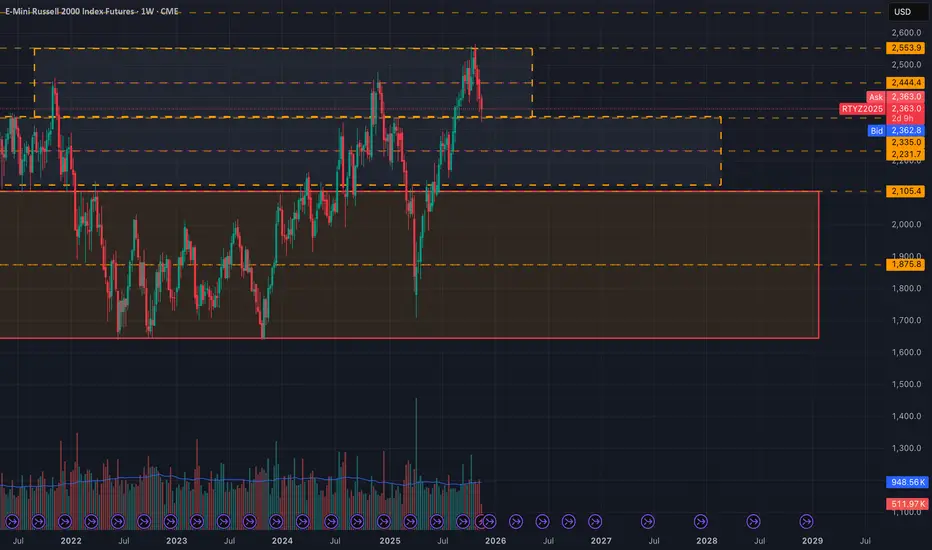
• Market reversed higher and entered an uptrend after concerns surrounding Trump’s liberation day tariffs eased in April 2025.
• In July 2025, the market consolidated and formed bid block 1, which buyers used as a base to drive price higher toward the 2585 area, a key daily resistance established in 2021 and the 2024 yearly high.
• Sellers responded at the 2585 area and offered prices back down toward the 2440 area, aligning with daily support and the 24 Nov weekly HVN.
• Buyers attempted to defend the 2440 area but failed, resulting in a downside auction to the 2320 area, corresponding to the bid block 1 high.
• Buyers defended and initiated at the 2320 area, bidding prices back up to the 2585 area, where sellers remained active.
• Markets have since rotated between the 2585 and 2490 areas.
What to expect in the coming week
The key level to monitor is the 48650 area, which aligns with the previous week’s VPOC and the 15 December weekly Value Area High
Bullish scenario
• If the market is able to hold above the previous week’s settlement, an initial move toward the 2555 area is expected, which aligns with the 22 Dec weekly VAL, the 3 Dec weekly VAH, and the 0.5 weekly SD high.
• If price is able to accept above the 2555 area, continuation toward the 2585 area becomes likely.
• Sellers are expected to respond around the 2585 area based on prior failed auctions and higher timeframe resistance.
• If sellers fail to gain control, the market could extend higher toward the 2620 area, which marks the 8 Dec weekly high.
Neutral scenario
• In the absence of a major news or data catalyst, the market may continue to auction two ways
• A rotational consolidation between the 2490 and 2555 areas would signal continued balance and acceptance of value within this range.
Bearish scenario
• If buyers are unable to defend and hold the 2490 area, expect a move down toward the 2460 area, which aligns with the 1 weekly SD high.
• Continued selling pressure could cause markets to auction prices further down to the 2440 area, which remains a key daily support and the 24 Nov weekly HVN.
Conclusion
In conclusion, RTY remains in a balanced yet highly responsive state, with higher timeframe reference levels clearly defended and defended by both buyers and sellers. The 2490 area is the line in the sand for the coming week, and traders should remain flexible and responsive to acceptance or rejection around this zone. As always, patience and execution around key levels will matter more than prediction.
If you found this breakdown useful, feel free to give a boost, comment, or share your own levels and scenarios below.
Disclaimer: This is not financial advice. Analysis is for educational purposes only; trade your own plan and manage risk.

Bitcoin Cycles and Russell 2000! What's the Connection?I'm not a BTC maxi, and I'm not against BTC at all! I just never understood the fanatics—whether it's the BTC cult or XRP. As I've said before, the human brain is wired to hunt for patterns, confirmations, and setups where none actually exist! That's how conspiracy theories are born!
Sure, on a global scale, conspiracies and certain ideas do turn out to be true! But with BTC and its 4-year cycle model, halvings, and all that jazz, it's such an oversimplified framework—tailor-made for people who aren't used to looking beyond the surface or thinking critically at all! Why bother thinking when they've told you there's this orange coin that should pump every 4 years, then the miners' rewards get slashed and the coin should pump again! Why? Nobody's ever explained it!
It's just that, back then, the halving model was the only marketing gimmick tied to the tech side that could draw in users! How else was a brand-new asset, fresh out of nowhere in the world, supposed to grab attention? So they cooked up this price-growth stimulus like that! But the market's matured now—demand has exploded, enough to soak up any supply out there.
To me, the halving is more of a news event that rallies all the market's forces into a tight timeframe, making it easier to reboot the whole thing.
As far as I'm concerned, the whole story about halvings driving BTC's cycles and growth is pure fiction! On the chart, they've just slapped on the Bitcoin halvings, and down at the bottom is the RUT (Russell 2000)—that's the index of 2,000 small-cap companies across all sorts of sectors!
How does it end up that the reactions on the charts are identical? Are people buying stocks in companies based on the halving of some made-up digital coin? Or is it way simpler: global investors, riding favorable market vibes in the moment, just pile into risk assets—and that includes both Bitcoin and those 2,000 small-cap companies
And for all you BTC diehards to chew on: The RUT index kicked off in the late '80s!
Thirty years before that orange coin even showed up!
Every asset—especially in crypto—needs some kind of hook, a legend, a mystery! Something to stir up the buzz! So let's not keep dragging in the halving as some magical force! Just like we shouldn't put blind faith in these so-called cycles! CRYPTO:BTCUSD

Russell 2000 ~ Breakout Confirmed 3,000 Target On TrackRussell 2000 Technical Update
The Russell 2000 breakout from its multi year consolidation remains intact and is now confirmed by multiple monthly closes above former resistance. The anticipated pullback has played out as expected, providing validation of the breakout structure and keeping the measured move toward the 3,000 area firmly in play.
This update reviews what has developed since the original breakout signal and why the next leg higher remains the dominant path.
What Has Developed Since the Breakout
In October, the Russell 2000 recorded a monthly close above the November 2021 highs near the 2,450 area. This marked a confirmed breakout from a five year consolidation range.
At the time, a pullback to retest former resistance as support was expected. That scenario unfolded precisely.
Price retraced into the 2,280 to 2,350 zone, aligning with the 0.5 to 0.618 Fibonacci retracement levels. Buyers stepped in at support, and November closed back above the breakout level. December has continued to hold above this zone, reinforcing the validity of the move.
Two consecutive monthly closes above a five year resistance level typically signal institutional participation rather than a short term false breakout.
Current Technical Structure
Breakout Confirmation
Monthly closes remain above former resistance near 2,350. This area now acts as structural support.
Fibonacci Alignment
The pullback tested the 0.236 retracement near 2,280 and held. Price is currently trading above the 0.236 retracement, reinforcing bullish structure.
Trend Conditions
Long term moving averages are rising beneath price. Higher lows continue to form on the monthly timeframe. Volume has expanded on advances, supporting the breakout.
The initial breakout phase is complete. Price is now transitioning into the continuation phase.
Why the 3,000 Target Remains Valid
Measured Move Projection
The five year range spans roughly 1,640 to 2,481. Projecting this range from the breakout level produces an upside target above 3,300.
Conservative Targeting
Using approximately 80 percent of the measured move yields a zone near 3,150. Rounding to 3,000 provides a conservative target that accounts for volatility and market noise.
Fibonacci Extensions
Higher timeframe Fibonacci extensions cluster between 3,200 and 3,300, reinforcing the broader target zone.
From current levels near 2,400, the move to 3,000 represents approximately 25 percent upside.
Review of the November Pullback Entry
The outlined plan called for a pullback into the 2,280 to 2,350 area with invalidation below 2,150.
Price reached 2,282 in November, directly into the projected support zone. Buyers defended the level, price rebounded, and structure remained intact.
Risk to reward at entry was approximately 5 to 7 percent risk for 25 to 30 percent potential upside, producing a favorable asymmetric profile.
Why This Move Is Still Early
Cycle Timing
The breakout occurred recently on a monthly timeframe. Large structural breakouts often take 12 to 18 months to reach measured targets.
Institutional Rotation
Small caps underperformed for several years. Capital rotation into this segment typically unfolds gradually, not in a single move.
Participation Profile
Retail participation remains focused on large cap technology. Breakouts that are not yet widely discussed often offer the best continuation potential.
The breakout is confirmed, but it is not yet fully recognized.
Macro Environment
Interest Rate Outlook
Falling or stabilizing rates tend to favor small caps due to their higher sensitivity to financing costs.
Economic Backdrop
The absence of recession supports domestically focused companies that dominate the Russell 2000.
Valuation Context
Small caps continue to trade at a valuation discount relative to large caps, creating room for multiple expansion.
Technical structure and macro conditions are currently aligned.
Risk On Correlation With Crypto
Historically, sustained Russell 2000 breakouts coincide with improving liquidity conditions. These environments often support digital asset strength.
Bitcoin has already advanced meaningfully since the Russell held its breakout. Continued small cap strength would support a broader risk on regime.
This relationship is contextual rather than predictive and should be monitored rather than assumed.
Positioning Framework
Exposure Options
IWM ETF, RTY futures, or structured options depending on experience and risk tolerance.
Risk Management
A monthly close below 2,280 would weaken the breakout thesis. The 3,000 area remains the primary target, with 3,200 as an extended objective.
Time Horizon
This structure favors a medium to long term outlook rather than short term trading.
Monthly closes carry more weight than daily volatility.
Invalidation Risks
• Monthly close below 2,280
• Macro driven risk off events
• Unexpected policy tightening
• Broad market trend deterioration
If invalidated, losses remain defined and manageable relative to upside potential.
Psychology of Structural Breakouts
Early stages feel uncertain. Confirmation feels uncomfortable. Obvious trends tend to appear near the latter stages of a move.
This breakout is confirmed, but not yet crowded.
Summary
• Five year breakout confirmed with multiple monthly closes
• Support held at the anticipated retracement zone
• Measured move targets 3,000 to 3,200
• Upside approximately 25 to 30 percent from current levels
• Risk remains defined below structural support
The most difficult part of the trade was the breakout itself. The market is now in the follow through phase.
Important Disclaimer
This analysis is for educational purposes only and does not constitute financial advice. All markets involve risk, and technical patterns can fail. Always apply appropriate risk management, conduct independent research, and trade in alignment with your risk tolerance.

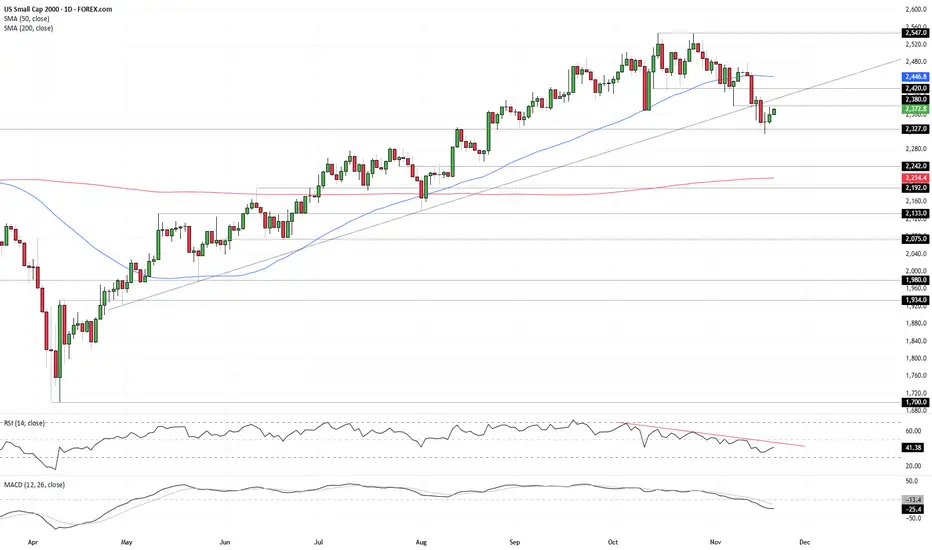
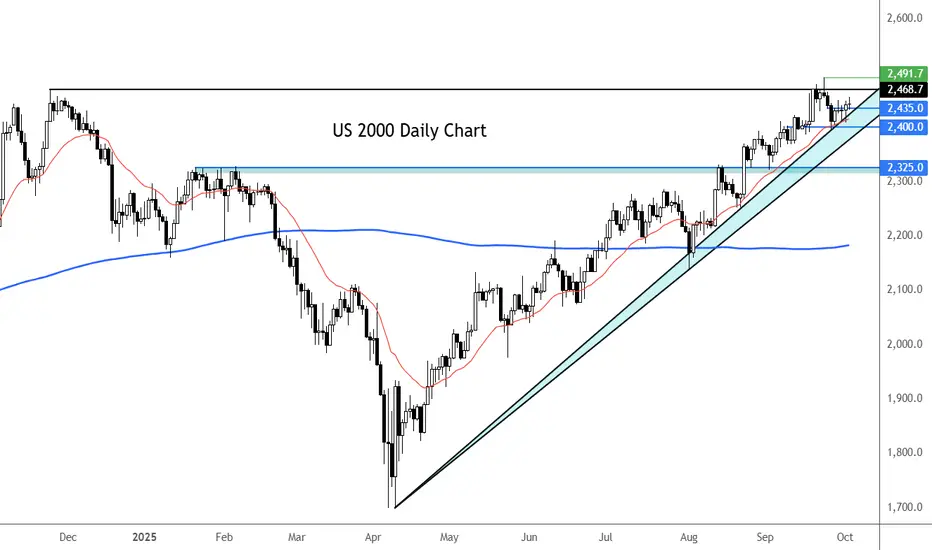
Russell at key supportSanta rally to start soon? Well, maybe. We have now had both the Fed and NFP out of the way, and not much else left except CPI report and a few CB meetings elsewhere. Among the major indices to watch is the Russell which is sitting at key inflection point here around 2520 area, marking prior resistance and middle trend of its LT bullish channel. Needs to hold this support, or at least the next one between 2460-2468 (marking the highs from Nov 2021 and Nov 2024, respectively). Bearish if it goes below that area.
By Fawad Razaqzada, market analyst with Forex.com

Can the Russell 2000 Lead the Next Bull Wave Above Resistance?📊 RUSSELL 2000: The Ultimate Small-Cap Breakout Blueprint 🚀💰
🎯 Market Overview: IWM Russell 2000 Index Analysis
The Russell 2000 (RUT/IWM) is setting up for what could be a chef's kiss momentum play! 🧑🍳✨ We're tracking a bullish continuation setup backed by triangular moving average confluence and a classic pullback-to-breakout pattern. Small-caps are flexing, and this technical structure screams opportunity for swing and day traders alike.
📈 The Trade Setup (Swing/Day Strategy)
Bias: 🟢 BULLISH
Confirmation: Triangular moving average pullback + volume expansion
Key Level to Watch: 2550.0 (Overbought resistance zone breakout)
🎯 Entry Strategy: Layered Scaling Approach
Primary Entry: Post-breakout above 2550.0 ✅
⚡ Pro Tip: Set price alerts on your platform to catch the breakout in real-time without staring at charts all day!
Layered Entry Levels (Scaling In):
🔹 2500.0
🔹 2510.0
🔹 2520.0
🔹 2530.0
🔹 2540.0
This scaling approach allows you to build your position gradually while managing risk like a pro. 🧠💼
🛑 Risk Management Zone
Stop Loss: 2480.0 🔴
⚠️ Disclaimer: This is MY stop-loss based on technical structure. YOU manage your own risk tolerance! Trade smart, not reckless. Your capital, your rules. 💯
🎯 Profit Target Zone
Target: 2610.0 🎯💰
This zone represents confluence of:
Strong historical resistance
Overbought territory
Potential bull trap zone (watch for exhaustion!)
⚠️ Profit-Taking Note: Lock in gains as we approach target. Don't get greedy—pigs get fed, hogs get slaughtered! 🐷🔪 This is MY target, but YOU decide when to secure profits based on YOUR strategy.
🔗 Related Markets & Correlation Watch
Keep an eye on these correlated assets for confirmation:
Direct Exposure:
AMEX:IWM (iShares Russell 2000 ETF) - Primary tracking vehicle
TVC:RUT (Russell 2000 Index Futures)
Correlation Plays:
AMEX:SPY (S&P 500) - Broad market sentiment gauge
NASDAQ:QQQ (Nasdaq-100) - Tech/growth sector correlation
AMEX:DIA (Dow Jones) - Large-cap comparison
Key Correlation Note: Russell 2000 typically outperforms during risk-on environments and underperforms large-caps during risk-off. Watch for small-cap premium expansion as confirmation of bullish thesis. When IWM/IWM/
IWM/SPY ratio rises, small-caps are leading—bullish for RUT! 📊🔥
Economic Indicators:
TVC:DXY (US Dollar Index) - Inverse correlation (weak dollar = small-cap strength)
TVC:TNX (10-Year Treasury Yield) - Interest rate sensitivity
Regional bank stocks (small-cap economy proxy)
🔑 Key Technical Points
✅ Triangular MA Pullback Complete - Classic retest of support
✅ Volume Profile - Accumulation zone established
✅ 2550.0 Resistance - Break and hold = explosive upside
✅ Risk/Reward Ratio - ~1:1.5+ (70 points risk / 110+ points reward)
✅ Timeframe Alignment - Multi-timeframe confluence supporting the move
⚡ The Thief's Edge: Why This Setup Works
Small-caps are the wild horses of the market—volatile, fast, and rewarding when you ride the trend! 🐎💨 The Russell 2000 represents domestic US growth plays, making it hyper-sensitive to:
Economic optimism cycles
Federal Reserve policy shifts
Risk appetite rotations
This setup capitalizes on momentum continuation after a healthy pullback. We're not catching falling knives—we're riding tested support into breakout territory! 🎯
🧠 Trading Psychology Corner
Remember, folks: The market doesn't care about your entry price. It only cares about supply and demand. Manage risk, scale into winners, and cut losers fast. This isn't financial advice—this is a battle-tested framework for market participants who understand probability over certainty. 🎲📉📈
🙏 Support the Analysis!
✨ If you find value in my analysis, a 👍 and 🚀 boost is much appreciated — it helps me share more setups with the community!
#Russell2000 #RUT #IWM #SmallCaps #TechnicalAnalysis #SwingTrading #DayTrading #Breakout #TriangularMA #MomentumTrading #StockMarket #IndexTrading #TradingStrategy #ChartAnalysis #PriceAction #SupportAndResistance #BullishSetup #TradingView #MarketAnalysis #RiskManagement
Stay sharp, trade smart, and let's catch this wave together! 🌊💰

After Russell2000 Post-Tease Breakout, Crypto Bull Run FollowsSince Bitcoin's inception the Russell2000 (IWM) has mimicked a similar pattern involving a tease > dump > breakout with crypto always following suit into a new bull cycle. We all have noticed how most altcoins (such as LTC) didn't follow BTC in price action the past couple of years, but upon yesterday's IWM Breakout into price discovery, we should see altcoins (like LTC) (alongside all kinds of other speculative assets, cyclicals, commodities, etc.) follow suit. This set up suggests a crypto bull run starting now and likely ending within the next 6-12 months.

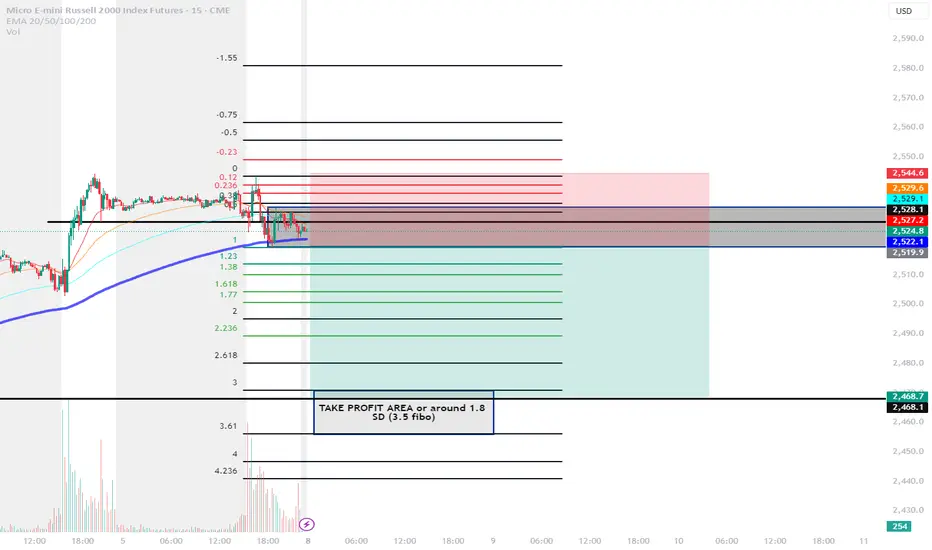
Short RTY, M2K IdeaI believe if we broke the box to the downside. A huge selloff will happen to 1.5 Standard deviation or 3 Fibonacci level drawn from Friday range
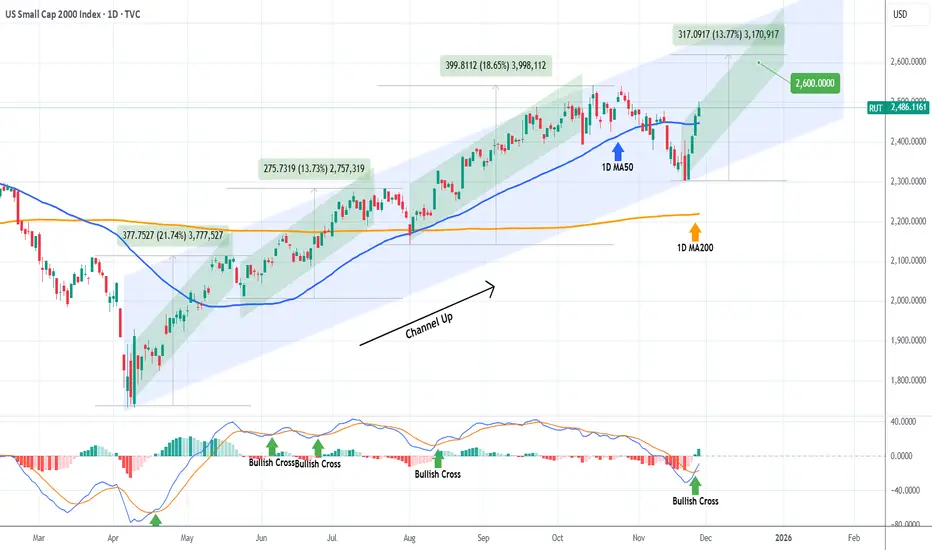
RUSSELL targeting 2600 on this Bullish Leg.Russell 2000 (RUT) has been trading within an 8-month Channel Up since the April 07 market bottom and following its latest correction (Bearish Leg), it recovered this week its 1D MA50 (blue trend-line), having already started the new Bullish Leg.
The minimum rise a Bullish Leg had within this pattern has been +13.73%. As a result, we expect the current one to hit at least 2600. Notice also the 1D MACD Bullish Cross, which has always been a confirmation of a new rally.
---
** Please LIKE 👍, FOLLOW ✅, SHARE 🙌 and COMMENT ✍ if you enjoy this idea! Also share your ideas and charts in the comments section below! This is best way to keep it relevant, support us, keep the content here free and allow the idea to reach as many people as possible. **
---
💸💸💸💸💸💸
👇 👇 👇 👇 👇 👇
Uptrend Started After Liberation Day - All Has Broken BelowThe US markets have been described as “on a rally” for quite some time. I would not agree if it is meant to describe the overall US market, but would agree if it refers specifically to AI or tech stocks. Why?
Among the four major US indices, the Russell—representing a much broader base of US-listed companies—continues to struggle to break above its high from last year, even though the others have far surpassed it. In fact, it has since corrected by 9.5% since its all-time high just last month.
After that, the other indices are also following suit only in the past few days, breaking below this uptrend that started in April.
Russell has taken the lead and has broken below this trend in late October.
The earliest clue came from the Russell Index, where many suppliers of the Magnificent 7 companies are also part of Russell 2000 components. When the Russell—or smaller-cap companies—starts to weaken, it often reflects broader market pressures that may eventually spill over to the rest of the indices or vice versa.
Video version on the process of how I monitor the four indices and then narrow it down to the individual index.
Micro E-mini Russell 2000 Index
Ticker: M2K
Minimum fluctuation:
0.10 index points = $0.50
Disclaimer:
• What presented here is not a recommendation, please consult your licensed broker.
• Our mission is to create lateral thinking skills for every investor and trader, knowing when to take a calculated risk with market uncertainty and a bolder risk when opportunity arises.
CME Real-time Market Data help identify trading set-ups in real-time and express my market views. If you have futures in your trading portfolio, you can check out on CME Group data plans available that suit your trading needs www.tradingview.com

Momentum Weak Despite Nvidia BoostShould small-cap U.S. equities be rallying because AI giant Nvidia just delivered another blowout earnings update? Sure, risk sentiment has improved, and continued AI investment comes with some immediate broader economic benefits, but the move still comes across as a little suspect, especially with the prospect of near-term Fed rate cuts dwindling by the day. While the price signals for our small-cap contract are pointing to upside risks, momentum indicators are not confirming, suggesting selling into strength may be the way to play it, especially if we see a reversal pattern.
Looking at the daily chart, we see a clear morning star bullish reversal pattern printed this week, with follow-through buying after the Nvidia results. However, as was the case in the prior session, the price has been unable to take out 2380 so far, marking the low struck on November 7. It’s only a minor level, but it has seen price action on either side of it this month, making it relevant when assessing setups.
Despite the bullish price signal, RSI (14) and MACD remain firmly bearish. RSI continues to trend lower beneath 50, indicating downside pressure remains even if it’s weakened a touch in recent days. MACD also sits in negative territory, having already crossed the signal line from above in late October. It too is showing signs of turning, but for now the combined message remains one where selling into strength may be the better way to play it.
Should the price be unable to breach and hold above 2380, shorts could be considered beneath the level with a stop above for protection, targeting 2327 support initially. Should that and Tuesday’s low give way, 2275 or 2242 screen as other downside targets.
Of course, if the price can push above and hold 2380, longs could also be considered, allowing for a stop to be placed beneath to protect against reversal. Such a move may see momentum indicators tilt neutral rather than bearish. If that were to occur, the merits of long trades would be improved. 2400, where the price was capped prior to the latest leg lower, looks as an appropriate initial target, with the 50DMA the next after that.
Good luck!
DS
Analysis for What’s Coming - AI Bubble Sentiment The US markets have been described as “on a rally” for quite some time. I would not agree if it is meant to describe the overall US market, but would agree if it refers specifically to AI or tech stocks. Why?
Among the four major US indices, the Russell—representing a much broader base of US-listed companies—continues to struggle to break above its high from last year, even though the others have far surpassed it. In fact, it has since corrected by 9.5% since its all-time high just last month.
After that, the other indices are also following suit only in the past few days, breaking below this uptrend that started in April.
Micro E-mini Russell 2000 Index
Ticker: M2K
Minimum fluctuation:
0.10 index points = $0.50
Disclaimer:
• What presented here is not a recommendation, please consult your licensed broker.
• Our mission is to create lateral thinking skills for every investor and trader, knowing when to take a calculated risk with market uncertainty and a bolder risk when opportunity arises.
CME Real-time Market Data help identify trading set-ups in real-time and express my market views. If you have futures in your trading portfolio, you can check out on CME Group data plans available that suit your trading needs www.tradingview.com

RTY Box LevelsI've taken some time to chart the Russell 200, and I have to say the box is looking quite excellent.
Nice and clean levels, makes a fella wanna put a bid in.
I am not used to trading this name(literally traded it the first time on Monday), but it seems like a good time so far.
I'll be on the look out for LBAFs and LAAFs, no directional bias just trading what is seen atm.
If a look below and fail occurs and is sustained at the upper box, then it is objectively a long (especially if we trade lower first w/a failure to go lower), otherwise if we trade through the level w/ continuation or trade higher first and fail, then a LAAF would take us within the middle box's range.
Trading higher first and failing is more bearish than trading lower first.
Trading lower first and failing to go lower is more bullish than trading higher first.
I like to keep these concepts in mind as I wait for the opening and initial balance ranges to form intraday, and from there, I can form an opinion and initiate a trade.
RUSSELL 25-year Channel Up giving a Sell Signal soon.Russell 2000 (RUT) has been trading within a 25-year Channel Up since the March 2000 High, which was the Top of the A.I. Bubble. Since then it only broke once during the 2008 Housing Crisis. Once recovered, it has used all standard macro levels of Support as short, medium and long-term buy entries respectively, with those being the 1M MA50 (blue trend-line), the 1M MA100 (green trend-line) and the 1M MA200 (orange trend-line).
The April 2025 rebound, which is the market's most recent rally, took place right on the 1M MA100. The index is however approaching the 0.236 Fibonacci level of the Channel Up, which since the 2000 High, has provided almost all rejection points, being the strongest Sell Signal (exception 2021, which was the mega-pump recovery following the March 2020 COVID flash crash).
As you can see, the market has historically started a correction on the 2nd test/ rejection on the 0.236 Fib. Out of those 3 corrections, two of them took place after the index broke above the 0.236 Fib and one just below it. All however have pulled-back to at least the 0.382 (blue) Fib. The key here however is to determine the exact High so that you can draw the 0.382 Fib retracement.
The only condition that most likely won't be fulfilled (as it happened on all previous cases), is that the 1M RSI most likely won't break above the 70.00 overbought level before the correction happens. So there's question mark there.
As for our Target, we expect at least 2230 (Fib 0.382) to get hit around mid 2026.
-------------------------------------------------------------------------------
** Please LIKE 👍, FOLLOW ✅, SHARE 🙌 and COMMENT ✍ if you enjoy this idea! Also share your ideas and charts in the comments section below! This is best way to keep it relevant, support us, keep the content here free and allow the idea to reach as many people as possible. **
-------------------------------------------------------------------------------
💸💸💸💸💸💸
👇 👇 👇 👇 👇 👇

Russell breaks outThe Russell has broken out of its short-term triangle continuation pattern to the upside. If the breakout holds, we could see a run to new all-time highs above 2547 from here. Key support around 2500 has held for now.
Risk appetite remains elevated as markets head into a critical window packed with potential rate cuts, tech earnings, and diplomatic progress between the US and China. The upcoming Trump–Xi meeting has added an extra layer of enthusiasm after Trump signaled possible tariff relief. Confidence in the AI theme continues to drive the rally, with Nvidia’s historic $5 trillion valuation amplifying bullish sentiment across tech-heavy benchmarks like the Nasdaq 100 and S&P 500. But now even the small caps index of 2000 US stocks - the Russell - is joining the rally.
By Fawad Razaqzada, market analyst at FOREX.com

Russell 2000: Is the lagging small-cap about to charge higher?Russell 2000 is the laggard, while the S&P 500, Nasdaq, and Dow scale new record highs.
Could small caps be next to break out?
While all major US equity indices are hitting new all-time highs, the Russell 2000 is still consolidating just below resistance. This sets up a pivotal moment for traders as the Fed decision looms and Q4 earnings heat up.
Price is holding above the lower trendline of a potential ascending triangle pattern, with buyers defending support and momentum building for a potential breakout above peak resistance.
RSI on a daily basis sits in the mid-50s (neutral), but with room for renewed upside if a breakout occurs. Alternatively, a reset down to oversold could lead to a short-term decline of around 5% to the prior bottom.
But October’s strong earnings and increased bets on Fed rate cuts provide a positive tailwind for small caps this quarter.
Watch for a shift in flows from big tech and mega-caps to small caps if market breadth improves post-Fed.
Keep an eye on the top, as a breakout could open the door to new all-time highs and fresh momentum for the Russell 2000. Don’t miss the rotation potential as Q4 trading picks up.
This content is not directed to residents of the EU or UK. Any opinions, news, research, analyses, prices or other information contained on this website is provided as general market commentary and does not constitute investment advice. ThinkMarkets will not accept liability for any loss or damage including, without limitation, to any loss of profit which may arise directly or indirectly from use of or reliance on such information.

Ethereum VS. Russell 2000 Russell 2000 index and Ethereum charts follow a strikingly similar pattern.
Both assets peaked in November 2021 and then entered a prolonged correction. Interestingly, both formed major lows around April 2025.
The Russell 2000, just before breaking through the 2021 ATH resistance area, retested the demand zone, just as CRYPTOCAP:ETH is currently doing.
This similarity suggests that Ethereum could be poised for a strong breakout, following in the footsteps of the Russell 2000.
History is sometimes more than just a coincidence…

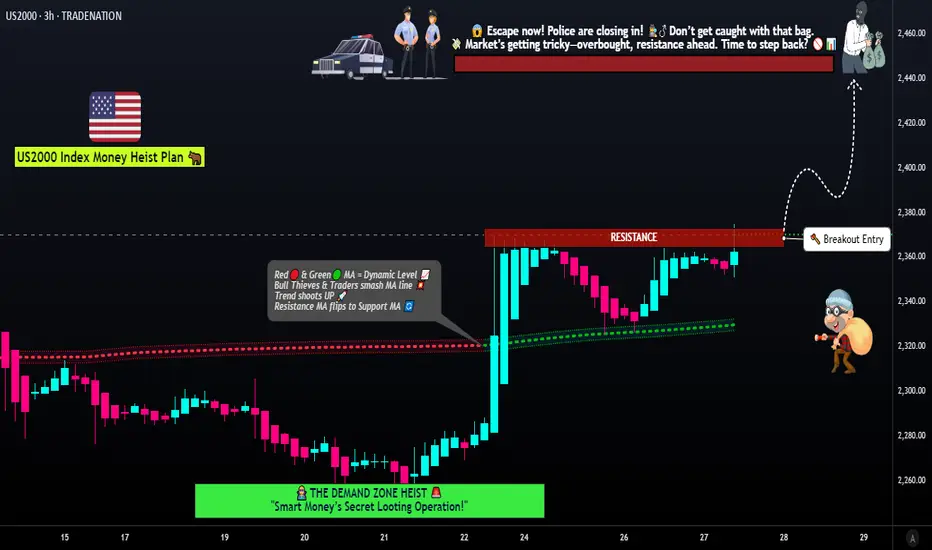
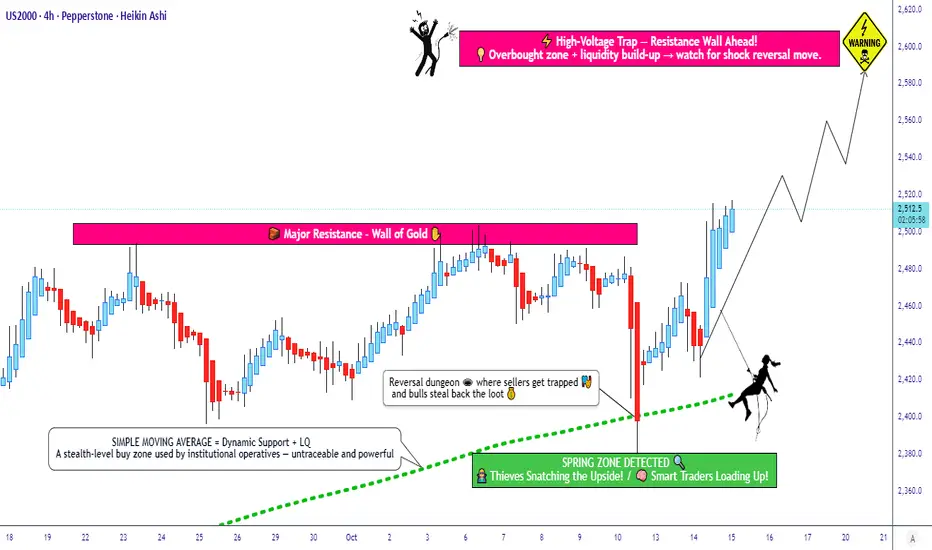
Is Smart Money Accumulating in US2000 Before the Next Move?🎯 RUSSELL 2000: Institutions Loading Up While You Sleep! 💰
📊 Asset Overview
US2000 / RUSSELL 2000 Index CFD - The small-cap kingmaker is showing serious institutional footprints!
🔥 The Setup: Bullish Retest at SMA
The Russell is doing that classic "look weak, go strong" move! 📈
We're seeing a textbook retest pullback at the Simple Moving Average - and guess who's quietly accumulating? The big money institutions! 🏦 While retail traders are panicking, the smart money is silently entering positions like ninjas in the night. 🥷
Translation: The trend is your friend, and right now that friend is buying the dip!
💎 The "Thief Strategy" Entry Plan
Layered Entry Approach 🎯
This isn't your grandma's single-entry strategy! We're using multiple limit orders (aka "The Thief Layering Method"):
Layer 1: 2440
Layer 2: 2460
Layer 3: 2480
Pro tip: Scale in like you're building a pyramid scheme, except this one actually makes money! 😂
Or: Jump in at current market price if you're feeling spicy 🌶️
🛡️ Risk Management
Stop Loss: 2420
⚠️ Thief's Disclaimer: This is MY stop loss based on MY risk tolerance. You do you! Manage your own risk like the responsible adult trader you are (or aspire to be). Take what makes sense for YOUR account size and sleep-at-night level.
🎯 Target Zone
Take Profit: 2600 🚀
Here's where it gets interesting - we've got a POLICE BARRICADE situation brewing! 🚨
What's a Police Barricade? It's when you've got:
✅ Strong resistance level
✅ Overbought conditions
✅ Potential trap zone for late buyers
The Game Plan: Secure those gains before the party gets too crowded! When you see 2600, that's your cue to take profits and live to trade another day.
Another Thief Disclaimer: This is MY target. You're the captain of your own ship! 🚢 If you want to take profits earlier or let it ride longer, that's YOUR call. Make money, then TAKE money - at your own risk and discretion!
🔗 Related Pairs to Watch
Keep your eyes on these correlated instruments:
AMEX:IWM (iShares Russell 2000 ETF)
Direct ETF tracking the Russell 2000
Higher liquidity for stock traders
Mirrors US2000 movement almost perfectly
AMEX:SPY (S&P 500 ETF)
Broad market correlation
Risk-on sentiment indicator
When SPY pumps, Russell often follows (with extra volatility!)
AMEX:DIA (Dow Jones ETF)
Blue-chip correlation check
Divergence signals can warn of small-cap weakness
NASDAQ:QQQ (Nasdaq-100 ETF)
Tech sector correlation
Russell 2000 often leads or lags based on risk appetite
📌 Key Correlation Insight: Russell 2000 is the risk-on barometer! When investors feel confident, small-caps outperform. When fear creeps in, they sell off harder than large-caps. Watch the broader indices for confirmation of market sentiment!
🎓 Technical Summary
Bias: Bullish 🐂
Setup Type: Retest/Pullback Entry
Strategy: Layered Entry (Thief Method)
Risk/Reward: Favorable with defined stops
Institutional Activity: Accumulation phase detected 🏦
⚡ The Bottom Line
This setup screams institutional accumulation! The smart money doesn't announce their entries on CNBC - they quietly load up while everyone else is distracted. Be the thief, not the victim! 🎭
Remember: Markets reward patience and punish FOMO. Layer in, manage your risk, and let the trade come to you!
✨ If you find value in my analysis, a 👍 and 🚀 boost is much appreciated — it helps me share more setups with the community!
⚠️ DISCLAIMER
This is the "Thief Style" trading strategy. Trading involves substantial risk of loss. Always do your own research, manage your own risk, and never trade with money you can't afford to lose. Past performance doesn't guarantee future results. Trade at your own risk! 🎲
#Russell2000 #US2000 #SmallCaps #SwingTrading #DayTrading #TechnicalAnalysis #PullbackEntry #InstitutionalTrading #ThiefStrategy #LayeredEntry #CFDTrading #IndexTrading #BullishSetup #SMARetest #TradingStrategy #RiskManagement #IWM #MarketAnalysis #TradingView #PriceAction
Russell hits new highsSo much for the government shutdown. US equity indices have rallied again today, thanks to ongoing bullish momentum and AI optimism. Bets that the Fed easing will continue to support corporate earnings are keeping the bulls fully in charge with traders continuing to take the ongoing US gov shutdown in their stride..
While tech stocks continue to shine -- led by Advanced Micro Devices (AMD), which soared after signing a deal with OpenAI to roll out AI infrastructure -- small caps are doing great too ahead of the earnings season.
The Russell has been printing lots of bullish price action lately and we have called for new highs on the index. It has not let us down and today climbed to a new high, after taking out a long-term resistance zone between 2461 and 2468, marking the highs from 2021 and 2024.
The breakout means the index has also poked its head above last week's high at 2491, thus invalidating the bearish-looking inverted hammer candle that had pointed to a potential top. Well that candle only preceded a modest pullback, as the index has now hit a new record. 2500, 2600 could be the next upside targets from. Key support levels below that 2461-2468 range are marked on the chart.
By Fawad Razaqzada, market analyst with FOREX.com

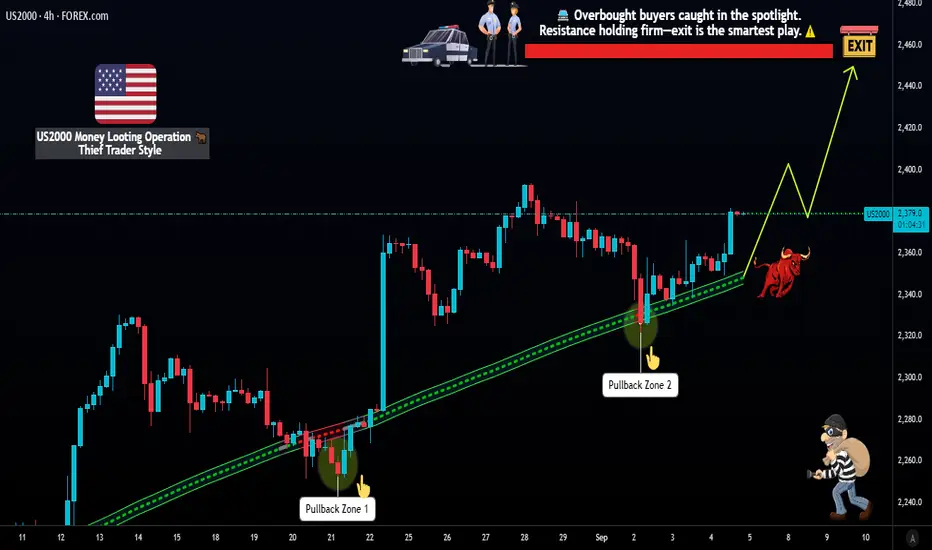
US2000 Layered LSMA Pullback Strategy – Bullish Opportunity🚀 US2000 Index – Thief Plan: LSMA Pullback + Layered Entries 📊
📌 Trading Plan (Swing / Day Trade)
Strategy: Bullish LSMA moving average pullback plan 📈
Thief Style Entries (Layering Method):
Multiple buy-limit layers at 2340 / 2350 / 2360 / 2370
You can increase layers based on your own strategy & risk 🧩
Stop Loss (SL): Thief SL @ 2310 (adjust based on your own plan & risk) 🛡️
Target (TP): Strong resistance at 2450 ⚠️ – “Police barricade” 🚓
Note: This is not a fixed TP recommendation. Thief OG’s 🎭, take profits where it fits your risk and reward. 💰
❓ Why This Plan? (Thief Logic)
🔹 Technical (Thief Strategy)
Bulls loading pressure with LSMA pullback signals 🐂.
Layered entries reduce timing risk and allow multiple profit grabs.
Strong resistance ahead at 2450 = escape zone before “police barricade” 🚨.
🔹 Sentimental Reasoning
Retail sentiment 58% bullish 🟢 vs. 32% bearish 🔴 → optimism is leaning upward.
Institutions also show 52% bullish bias, confirming retail direction ⚖️.
Fear & Greed index at 52/100 = Neutral 😐 → balanced emotions, not overheated.
🔹 Fundamental Reasoning
Earnings growth ~12% expected in 2025 💼 supporting equity demand.
Consumer spending still rising (+0.5% in July) 🛍️ keeps the economy resilient.
Fed policy steady at 4.25%–4.50% 🏦 = stable environment for stocks.
🔹 Macro Reasoning
Inflation above Fed target (Core PCE 2.9% y/y) 📈 = caution flag.
Trade tariffs 🌐 add uncertainty, but no crash-level risk.
Fed rate cut expected in September 🔽 = bullish fuel if confirmed.
👉 Thief Conclusion: Fundamentals 💼 + Sentiment 🧠 + Macro 🌍 align with a slightly bullish thief setup. The layering style plan matches the market bias → stack the layers, steal the profits, and escape before 2450 barricade hits 🚀💰.
*********************************************************************************************************************
📊 US2000 Index CFD Data Report – September 5, 2025
🕒 Real-Time Snapshot
Daily Change: +0.89% (+19.12 pts) 🚀
Monthly Trend: +3.28% 📅
Yearly Trend: +18.21% 🌟
😊 Investor Sentiment Outlook
Retail Traders:
Bullish: 58% 🐂
Bearish: 32% 🐻
Neutral: 10% ⚖️
Institutional Traders:
Bullish: 52% 🐂
Bearish: 38% 🐻
Neutral: 10% ⚖️
🌡️ Fear & Greed Index
Current: 52/100 (Neutral) 😐
Fear: Below 45
Greed: Above 55
Market mood balanced ⚖️
📈 Fundamental Score: 72/100
Corporate earnings growth ~12% (2025 outlook) 💼
Consumer spending resilient (+0.5% in July) 🛍️
Fed funds steady at 4.25%–4.50% 🏦
🌍 Macro Score: 65/100
Inflation still above target (Core PCE 2.9% y/y) 📈
Tariff policies = trade uncertainty 🌐
Fed rate cut expected September 🔽
🐂🐻 Overall Market Outlook: Slightly Bullish
Score: 68/100 🐂
Reason: Strong earnings + consumer demand support upside, but tariffs + inflation cap growth. Expect consolidation with bullish tilt 🚀
🔑 Key Takeaways
Neutral → bullish tilt 😐➡️🐂
Retail + institutional both lean optimistic ⚖️
Fundamentals strong 💼, macro mixed 🌍
Payroll data = key Fed signal today 📊
Thief Plan aligns with market bias & LSMA pullback 📈
👀 Related Pairs to Watch
CAPITALCOM:US30
FOREXCOM:SPX500
PEPPERSTONE:NAS100
TVC:DXY
TVC:VIX
✨ “If you find value in my analysis, a 👍 and 🚀 boost is much appreciated — it helps me share more setups with the community!”
#US2000 #Russell2000 #IndexTrading #ThiefPlan #SwingTrade #DayTrading #StockIndices #MarketOutlook #FearAndGreed #TradingStrategy
Russell eases to test key short-term supportThe Russell has bounce off its lows a tiny bit but could we now see a more decisive recovery heading deeper into the U.S. session?
The markets have been holding firm with tech sector leading the spx500 to a new high today, even though the index then came off earlier highs amid profit taking with government shutdown making things complicated.
Still, the trend is clearly bullish and we could well see the small cap index hold support here around 2435 which was prior resistance.
On the upside 2468 is the main level to watch. Break this and a new ATH above 2491 could be on the cards.
By Fawad Razaqzada, market analyst with FOREX.com
Russell 2000 Year-End Price Target and Technical Rebound OutlookIf you ahven`t bought the Double Bottom on RUT 2K:
Now the Russell 2000 Index (RUT), which tracks small-cap stocks, has recently entered oversold territory, signaling that a potential technical rebound could be on the horizon. Oversold conditions typically occur when selling pressure becomes excessive, driving the index below its fundamental value and creating an opportunity for a corrective bounce.
Several technical indicators, including the Relative Strength Index (RSI), have fallen below the 30 level — a classic oversold signal. Historically, similar setups have led to strong short-term recoveries as buying interest returns once the selling momentum exhausts itself.
Additionally, market breadth indicators suggest that the recent pullback has been broad-based, with a high percentage of RUT 2K components trading below their 50-day and 200-day moving averages. This type of widespread weakness often precedes a period of mean reversion, where prices bounce back toward key resistance levels.
Given these technical signals, my price target for RUT 2K is $2,450 by the end of the year. A rebound toward this level would represent a recovery of approximately 10-12% from current levels, aligning with previous post-oversold rallies in the index. If broader market sentiment stabilizes and small caps benefit from improving economic conditions or easing rate hike pressures, the path toward this target becomes increasingly plausible.
While downside risks remain — including ongoing macroeconomic uncertainty and geopolitical tensions — the technical setup suggests that RUT 2K is primed for a recovery in the coming months.

US2000 Bullish Breakout Strategy! Layer Entries and Escape Plan🚨💰 US2000 / RUSSELL2000 Index Market Robbery Plan 🏦💸 (Swing/Scalping Trade)
🌟Hi! Hola! Ola! Bonjour! Hallo! Marhaba!🌟
Dear Money Makers & Robbers, 🤑💰💸✈️
Based on 🔥 Thief Trading Strategy 🔥 here is our heist plan to rob the US2000 / RUSSELL2000 Index Bank Vault. Stick to the strategy outlined below – this is a layered entry plan, designed to outsmart market police 🚓.
🎯 Entry Plan (Breakout + Layered Thief Style)
📌 Breakout Entry @ 2370.00 ⚡ → Robbery starts here!
📌 Layered Buy Limit Orders: (2370.00) – (2360.00) – (2350.00) – (2340.00)
👉 Add more layers if you want, but only activate after breakout confirmation!
📌 Set Alarm in TradingView ⏰ to know the exact breakout moment.
(Thief Rule: Using multiple entries = more bags of cash 💰. Don’t be lazy – set layers smartly!)
🛑 Stop Loss (SL) – Thief Protection Line
📍 Thief SL @2300.00 (place AFTER breakout)
📍 Adjust based on your risk, lot size, and how many layers you’ve stacked.
👉 Remember: Stop loss is the alarm system – place it wisely or police will catch you 🚨.
🏴☠️ Target 🎯 – Escape Point
🚀 2440.00 = Police Barricade!
Escape with stolen profit bags before they lock down the road 🛑.
👉 You can take profit earlier if you see police headlights flashing 👮♂️.
🧲 Scalpers Note 👀
⚡ Rob fast, rob clean – only scalp long side.
If you’re rich 💎 – straight breakout entry.
If you’re patient thief – layer it like an OG.
📢 News & Risk Management Alert ⚠️
📰 Big news = extra police patrols 🚔.
👉 Avoid new trades during red news events.
👉 Use trailing SL to lock profits – don’t get caught after a good robbery.
💖 Support our robbery gang 💥Hit the Boost Button💥 on TradingView and power up the Thief Trading Squad 🏆🤝❤️🚀.
Stay tuned, more heist plans are on the way… 🤑🐱👤💸
#ThiefTrader #Russell2000 #US2000 #SwingTrade #Scalping #BreakoutTrading #LayerStrategy #BullishPlan #IndexTrading #HeistPlan #TradingView