Silver - Strength Speaks Loudest!!🏆Silver has been one of the strongest performers across almost the entire market, consistently outperforming most assets and leading the momentum higher.
📈Structurally, price remains firmly bullish , respecting the rising blue channel with clean impulsive moves followed by shallow corrections. This behavior is exactly what strong trends look like.
🏹As long as this rising blue channel holds , the plan remains straightforward:
I’ll be looking for trend-following longs on every correction, not chasing highs, but waiting patiently for pullbacks into structure.
Only a clear and decisive break below the channel would invalidate this bullish thesis. Until then, Silver remains a buy-the-dip market, favoring continuation rather than reversal.
⚠️ Disclaimer: This is not financial advice. Always do your own research and manage risk properly.
📚 Stick to your trading plan regarding entries, risk, and management.
Good luck! 🍀
All Strategies Are Good; If Managed Properly!
~Richard Nasr
SAFE

Golden Anchor: The Multi-Domain Resilience of BullionThe price of gold recently surged past $4,045 per ounce, cementing its role as a strategic global asset. This upward trend, pushing the year-to-date gain above 50%, is not merely speculative. It reflects deeply rooted structural forces across multiple global domains, from macroeconomics to high-tech demand. Investors are proactively using gold as a vital hedge against accelerating global uncertainty and fiat currency debasement.
Geopolitics & geostrategy: The De-Dollarization Hedge
Persistent geopolitical tensions drive sustained demand for gold's safe-haven status. Heightened conflict risks and unpredictable US tariff policies create global market volatility. In this fragmented landscape, gold acts as a politically neutral reserve asset, mitigating counterparty risk. Central banks globally are strategically accumulating gold to diversify away from the US dollar, accelerating the de-dollarization trend. This shift enhances national economic sovereignty, fueling gold's ascent.
Macroeconomics: Fiscal Dominance and Rate Cuts
Weakening US economic indicators directly reinforce gold’s appeal. A dip in the University of Michigan’s Consumer Sentiment Index signals broad economic unease. This fragility increases market bets on an earlier and more aggressive Federal Reserve rate-cutting cycle. Lower interest rates reduce the opportunity cost of holding non-yielding gold, boosting its price. Furthermore, the fiscal dominance prevalent in developed economies promotes gold as a critical hedge against the debasement of G7 fiat currencies.
Central Bank & Investment Demand Dynamics
Central bank purchases provide a formidable structural floor for gold prices. Despite the recent price correction, global central banks remain net buyers. They added 220 tonnes in Q3 2025 alone, representing a strategic, long-term commitment to gold. Poland, Kazakhstan, and Azerbaijan are notable accumulators. Retail and institutional investors are also turning to gold ETFs and physical bullion, viewing gold as essential financial insurance during systemic shocks.
Technology, Science, and High-Tech Demand
Technological advancements, particularly the boom in Artificial Intelligence, subtly support gold demand. While gold's main drivers remain macroeconomic, the high-tech sector consumes gold in electronic components and specialized circuits. Industrial demand remains resilient, offsetting a decline in jewelry consumption due to high prices. The massive, energy-intensive growth of AI and data centers indirectly creates a strategic need for high-value, reliable assets like gold to back infrastructure growth and hedge associated capital risks.
Technical Outlook and Consolidation Phase
Gold exhibits high long-term conviction but faces short-term consolidation after its historic rally. The price peaked at over $4,380 per ounce in mid-October before profit-taking began. Analysts expect the price to remain range-bound in the near term, with a maximum pullback risk around the strong $3,500/oz support level. Key technical resistance levels above the current peak are seen at $4,420/oz and $4,500/oz. Investors should utilize short-term dips as strategic long-term accumulation opportunities.

GOLD - Trio Retest!Hello TradingView Family / Fellow Traders. This is Richard, also known as theSignalyst.
📈After rejecting the $3,500 round number and upper bound of the wedge, XAUUSD has been in a correction phase trading within the falling red channel.
📚 As Gold approaches the $3,100 - $3,150 support zone, I will be looking for buy setups on lower timeframes as it is the intersection of three rejections:
1- The lower bound of the falling red channel
2- The lower bound of the rising orange wedge
3- $3,100 - $3,150 support zone
📚 Always follow your trading plan regarding entry, risk management, and trade management.
Good luck!
All Strategies Are Good; If Managed Properly!
~Rich
Disclosure: I am part of Trade Nation's Influencer program and receive a monthly fee for using their TradingView charts in my analysis.

Global Calm, Fiscal Storm: The Yen's Challenge?The USD/JPY currency pair has recently experienced a notable surge, driving the Japanese Yen to its weakest level against the US Dollar in a month. This appreciation primarily stems from a significant improvement in global risk sentiment, sparked by a breakthrough trade agreement between the United States and China. This deal, aimed at reducing the US trade deficit, has bolstered investor confidence and diminished the traditional safe-haven appeal of the Yen. Adding to the dollar's strength is the Federal Reserve's continued hawkish stance, signaling no immediate plans for interest rate cuts and reinforcing the attractiveness of dollar-denominated assets amidst easing concerns about a US recession.
Simultaneously, internal economic pressures in Japan significantly weigh on the Yen. The nation's public debt has reached an unprecedented high, driven by persistent increases in defense spending and social welfare costs due to an aging population. Government subsidies for energy bills and the need to issue more bonds to cover rising expenditures exacerbate this fiscal strain. This challenging domestic backdrop contrasts sharply with the Federal Reserve's position, creating a widening divergence in monetary policy outlooks that favors the US Dollar through yield differentials, despite the Bank of Japan's cautious consideration of future rate adjustments.
Furthermore, reducing global geopolitical tensions has contributed to the shift away from safe-haven currencies. Recent ceasefires and prospects for diplomatic talks in key conflict areas have encouraged a "risk-on" environment in financial markets. This increased appetite for riskier assets directly reduces demand for the Japanese Yen, amplifying the impact of fundamental economic factors and monetary policy divergence on the USD/JPY exchange rate. The pair's trajectory remains subject to evolving global dynamics, upcoming economic data releases, and central bank communications.

Gold ETF(GLD) - Gold is the Safe Haven?Is Gold the safe haven from all the market turmoil? Looking at the chart, it would appear that Gold is unfazed by current market conditions. Price is still making All-Time Highs as price continues to swing above the 25(green), 100,(yellow) and 200(blue) day EMAs. Further fears in the Bond market may increase interest in Gold as a stable asset. What are you thoughts? What are some other assets that are defying 'gravity'?

Silver – Lagging but Still Strong!Hello TradingView Family / Fellow Traders. This is Richard, also known as theSignalyst.
📈 SILVER has been bullish, trading within the rising wedge pattern marked in red.
Following the latest aggressive bullish movement, XAGUSD has formed a demand zone, marked in blue.
🏹 Thus, the highlighted blue circle is a strong area to look for buy setups, as it represents the intersection of demand, support, and the lower red trendline, which acts as a non-horizontal support.
📚 As per my trading style:
As #XAGUSD approaches the blue circle, I will be looking for bullish reversal setups, such as a double bottom pattern, a trendline break, and so on.
Additionally, for the bulls to maintain long-term control, a break above $3,500 is needed.
📚 Always follow your trading plan regarding entry, risk management, and trade management.
Good luck!
All Strategies Are Good; If Managed Properly!
~Rich
Disclosure: I am part of Trade Nation's Influencer program and receive a monthly fee for using their TradingView charts in my analysis.

SAFE Long SL -13.8% SAFE/USDT Long Setup
Reason:
Breakout and Confirmation done in Internal Structure.
Breakout of Wedge with Strong Volume, and Resting on Support.
Strong Bullish bullish momentum with high Volume.
All technical Parameters suggesting a strong Bullish Wave.
Liquidity taken in External Structure.
Best Regards,
The Panda

Could Silver's Price Soar to New Heights?In the realm of precious metals, silver has long captivated investors with its volatility and dual role as both an industrial staple and a safe-haven asset. Recent analyses suggest that the price of silver might skyrocket to unprecedented levels, potentially reaching $100 per ounce. This speculation isn't just idle talk; it's fueled by a complex interplay of market forces, geopolitical tensions, and industrial demand that could reshape the silver market landscape.
The historical performance of silver provides a backdrop for these predictions. After a notable surge in 2020 and a peak in May 2024, silver's price has been influenced by investor sentiment and fundamental market shifts. Keith Neumeyer of First Majestic Silver has been an outspoken advocate for silver's potential, citing historical cycles and current supply-demand dynamics as indicators of future price increases. His foresight, discussed across various platforms, underscores the metal's potential to break through traditional price ceilings.
Geopolitical risks add another layer of complexity to silver's valuation. The potential for an embargo due to escalating tensions between China and Taiwan could disrupt global supply chains, particularly in industries heavily reliant on silver like technology and manufacturing. Such disruptions might not only increase the price due to supply constraints but also elevate silver's status as a safe-haven investment during times of economic uncertainty. Moreover, the ongoing demand from sectors like renewable energy, electronics, and health applications continues to press against the available supply, setting the stage for a significant price rally if these trends intensify.
However, while the scenario of silver reaching $100 per ounce is enticing, it hinges on numerous variables aligning perfectly. Investors must consider not only the positive drivers but also factors like market manipulation, economic policies, and historical resistance levels that have previously capped silver's price growth. Thus, while the future of silver holds immense promise, it also demands a strategic approach from those looking to capitalize on its potential. This situation challenges investors to think critically about market dynamics, urging a blend of optimism with strategic caution.

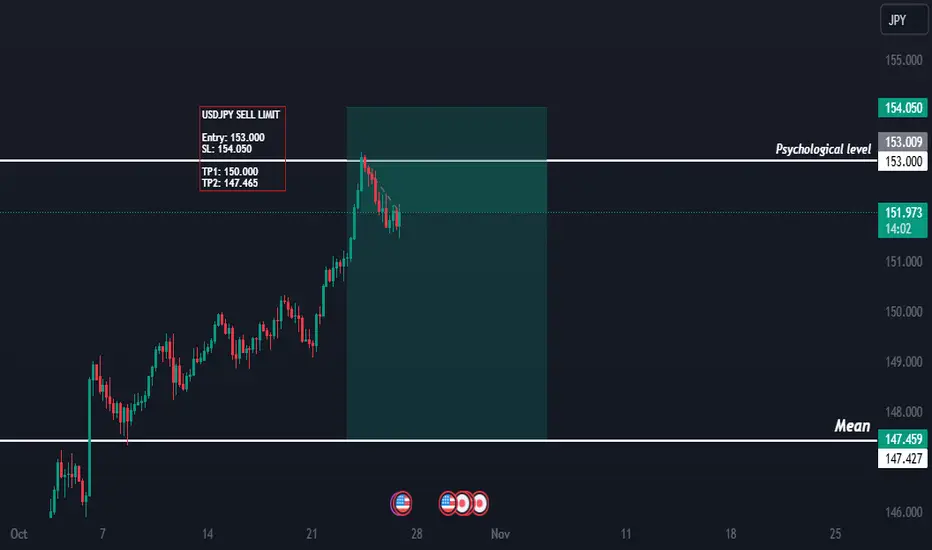
USDJPY: Potential for a Slight Bearish Bias Amid Key FundamentalUSDJPY: Potential for a Slight Bearish Bias Amid Key Fundamental Drivers (25/10/2024)
Today, the USDJPY currency pair could experience a slight bearish bias, driven by recent shifts in both the Japanese and U.S. economic landscape. Here’s a breakdown of the factors contributing to this potential trend, along with insights into what traders should watch as the day unfolds.
1. Bank of Japan’s Potential Shift in Policy
The Bank of Japan (BoJ) has maintained its ultra-loose monetary policy stance for years, but recent signals suggest a possible move towards tightening. Japanese inflation rates have gradually risen, and with core inflation holding steady above target levels, the BoJ may finally consider adjusting its dovish stance. Any indication of a shift toward a more hawkish BoJ, even if gradual, could support the JPY, creating downward pressure on the USDJPY pair.
2. US Dollar Weakness on Federal Reserve Pause Speculation
The US Dollar (USD) has softened recently as speculation grows that the Federal Reserve may pause rate hikes. U.S. economic data has shown signs of cooling inflation, and Fed officials have hinted that a pause could be on the horizon, given recent macroeconomic indicators. A dovish tone from the Fed typically weakens the USD, thus enhancing the relative strength of the JPY. This potential softening in the dollar is an essential factor in the slight bearish bias for USDJPY.
3. Market Sentiment Shifting Towards Safe-Haven Assets
Investor sentiment is currently tilted toward safe-haven assets, largely due to ongoing geopolitical tensions and uncertain global economic conditions. While the USD is also a safe-haven currency, the Japanese Yen (JPY) often gains favor when there’s heightened uncertainty in markets, especially in Asia. This risk-averse sentiment is driving investors to seek the JPY, which could contribute to additional downward momentum in the USDJPY pair today.
4. Technical Indicators Suggest Resistance for USDJPY
From a technical perspective, USDJPY is encountering resistance around the 150.00 level. This is a critical psychological threshold, and the pair’s failure to break above this level reinforces a potential bearish sentiment. With Relative Strength Index (RSI) levels approaching overbought territory, a bearish correction might be anticipated. Additionally, a dip below the 149.00 support level could confirm this outlook and signal further downside potential.
Summary: Slight Bearish Bias for USDJPY
Today’s fundamental factors suggest a slight bearish bias for USDJPY, largely due to potential changes in Bank of Japan policy, a softer US Dollar from Federal Reserve pause speculation, and increased demand for safe-haven assets. Technical resistance at key levels also reinforces the likelihood of a bearish tilt for the pair.
Traders should watch for real-time updates on BoJ announcements, Fed commentary, and any developments in geopolitical news that could impact USDJPY direction.
---
Keywords
1. USDJPY forecast
2. Bank of Japan policy
3. US Dollar analysis
4. Fed rate pause
5. USDJPY bearish trend
6. Forex trading insights
7. Safe-haven assets
8. Japanese Yen strength
9. USDJPY technical levels
Safe Token Price Surge 74% Amidst Upbit Listing The Safe ( NYSE:SAFE ) token, a crucial part of the Safe ecosystem, recently experienced a massive price surge following a key listing announcement.
What is Safe?
Safe is a leading player in the Web3 space, offering a robust ownership layer for decentralized applications and digital asset management. It powers over $100 billion worth of assets through Safe{Core}, a comprehensive stack for account abstraction, and Safe{Wallet}, an industry-standard multi-sig wallet. The project’s aim is to turn every Ethereum account into a “smart account,” unlocking a variety of new use cases in sectors like AI, Staking, DeFi, SocialFi, and gaming.
Safe offers features like gasless transactions, face-ID logins, recovery solutions, and more, aiming to simplify Web3 for users and developers alike. Its ecosystem includes over 200 projects, such as Gnosis Pay and Worldcoin, and operates across more than 15 networks. With over 8 million Safe accounts created and 40 million transactions executed since its launch, Safe has established itself as a secure, battle-tested infrastructure for Web3, with notable users including Vitalik Buterin, Shopify, and Reddit.
Recent Achievements and Milestones
Safe’s latest milestone comes with the announcement of its token listing on Upbit, South Korea’s largest crypto exchange, supporting trading pairs in KRW, USDT, and BTC. This listing has sparked significant market interest, leading to a remarkable price surge of 74%, reaching a peak of $1.75 and bringing its market cap above $813 million.
Moreover, Safe has announced that its total value locked (TVL) is more than five times that of Robinhood's centralized exchange, further cementing its place as a benchmark of security and utility in the decentralized finance space.
Price Performance
At the time of writing, the SAFE token is trading at around $1.45, representing a 53% increase in the past 24 hours. Prior to the Upbit listing announcement, NYSE:SAFE experienced a slight dip in price, dropping below $1.00 on October 23. However, the listing news reversed this trend, leading to the recent price surge.
Despite the bullish sentiment, investors should exercise caution. The Relative Strength Index (RSI) currently sits at 76, indicating that the asset is in overbought territory. This suggests that a trend reversal could occur in the short term, as the token is trading above key moving averages.
Technical Analysis
From a technical perspective, the SAFE token's recent surge places it in overbought territory, with the RSI at 76—a key indicator that a pullback might be on the horizon. The token is currently supported by the $1.08 price point, a crucial level that could trigger a consolidation phase if tested. A failure to hold above this support could see NYSE:SAFE revisit its one-month low.
However, if market momentum continues and support holds, NYSE:SAFE could make a run toward its one-month high of $1.85 and possibly breach the $2.00 mark. Key moving averages are aligned with the bullish trend, suggesting that upward movement could continue in the near term.
Outlook
Safe’s long-term fundamentals remain strong. Its ecosystem, partnerships, and focus on key innovations like account abstraction, gasless transactions, and user-friendly infrastructure make it a leading contender in the Web3 space. With support from prominent figures in the crypto world and web2 giants like Shopify, Safe is positioned to continue growing its user base and ecosystem.
Moreover, Safe’s modular approach to Web3 enables unprecedented customization and scalability for developers. The fact that Safe{Wallet} is trusted for self-custody of assets and high-value NFTs further solidifies its credibility in the space.
Conclusion
Safe ( NYSE:SAFE ) is at an exciting point in its trajectory, with recent price action reflecting the market's confidence in its long-term potential. However, given its overbought status, short-term traders should be cautious of potential pullbacks. For long-term holders, Safe's robust fundamentals and growing ecosystem make it a compelling investment in the Web3 and decentralized finance space.
As always, investors should conduct their own research and assess their risk tolerance before making any trading decisions. Safe offers both opportunity and risk, particularly given its volatile price action and upcoming developments in the ecosystem.

Slightly Bearish Bias Expected on XAGUSD today 09/10/2024.XAGUSD Analysis for 09/10/2024: Slightly Bearish Bias Expected
In today's analysis of XAGUSD (silver to USD), the market appears to be leaning towards a slightly bearish bias based on the latest fundamental factors and current market conditions. As of 09/10/2024, several critical drivers are influencing the precious metal's price, suggesting that downside momentum could dominate the day. This article highlights the key reasons behind the potential bearish outlook for silver.
Fundamental Factors Supporting Bearish Bias
1. Strengthening US Dollar
One of the most significant factors weighing on XAGUSD today is the strengthening of the US Dollar. The US Dollar Index (DXY) has been rising, supported by robust US economic data and expectations that the Federal Reserve may continue its hawkish stance. A stronger USD typically puts pressure on commodities like silver, as it becomes more expensive for investors holding other currencies, leading to reduced demand.
2. Rising US Treasury Yields
Alongside the stronger US Dollar, US Treasury yields have been climbing, reflecting investor expectations for continued high interest rates. Higher yields tend to increase the opportunity cost of holding non-yielding assets like silver, leading to selling pressure in the silver market.
3. Weakening Global Demand for Safe-Haven Assets
Silver, like gold, often benefits from its status as a safe-haven asset in times of uncertainty. However, recent improvements in global risk sentiment have reduced the demand for such assets. The relatively calm geopolitical landscape and better-than-expected economic data from key regions like the US and China have shifted investor attention away from safe havens, contributing to the bearish outlook for silver.
Technical Outlook for XAGUSD on 09/10/2024
- Support and Resistance Levels
XAGUSD is currently facing resistance around the $23.00 level, with key support lying near the $22.50 level. A break below the $22.50 support could trigger further downside momentum, reinforcing the slightly bearish bias for today.
- Moving Averages
The 50-day Moving Average (MA) has turned slightly downward, indicating bearish momentum. Additionally, the Relative Strength Index (RSI) is trending lower but still above the oversold territory, suggesting that there is room for further downside before a potential rebound.
Impact of Market Sentiment and Commodity Outlook
- Commodity Price Pressure
Commodities, in general, have been under pressure as global growth concerns and rising interest rates weigh on demand. Silver, being both an industrial and precious metal, is particularly sensitive to changes in economic outlooks. If growth expectations continue to moderate, it could limit the industrial demand for silver, further pushing prices lower.
- Geopolitical Stability
The relatively stable geopolitical environment has also played a role in reducing demand for silver as a hedge against uncertainty. Unless new tensions emerge, this stability could continue to weigh on safe-haven demand.
Conclusion
In summary, the outlook for XAGUSD today, 09/10/2024, appears to be slightly bearish. A combination of factors, including a stronger US Dollar, rising US Treasury yields, and lower demand for safe-haven assets, are all contributing to downward pressure on silver prices. From a technical perspective, the metal is facing resistance at $23.00, and a break below $22.50 could open the door to further losses.
Traders should monitor key support levels and consider potential short positions if silver continues to trade under pressure. However, it's essential to remain cautious and watch for any sudden shifts in market sentiment or global events that could alter this outlook.
---
Keywords for SEO:
XAGUSD analysis, silver price forecast, XAGUSD bearish bias, US Dollar strength, rising US Treasury yields, safe-haven demand, silver technical analysis, support and resistance levels, XAGUSD 09/10/2024, precious metals market outlook, silver trend, XAGUSD trend, forex trading, commodity market analysis, silver to USD, XAGUSD trading strategy, forex forecast, trading silver today.
USDJPY Analysis: Potential Bullish Bias for the Upcoming Week!USDJPY Analysis: Potential Bullish Bias for the Upcoming Week (Sept 23-29, 2024)
As we look ahead to the coming week, USDJPY appears poised for a potential slightly bullish bias. This outlook is based on a confluence of fundamental factors and current market conditions that favor USD strength relative to the Japanese yen. Below is a breakdown of key drivers supporting this outlook, along with insights that could influence price action.
1. Federal Reserve's Hawkish Stance
One of the key drivers for a potential bullish bias in USDJPY next week is the persistent hawkish tone from the Federal Reserve. Although the Fed opted to pause rate hikes in September, policymakers have indicated that they are open to further tightening if inflationary pressures persist. Recent inflation data in the U.S. showed a slight uptick in the Consumer Price Index (CPI), suggesting that the Fed may still consider additional rate hikes in 2024. Higher U.S. interest rates would continue to bolster the U.S. dollar, driving demand for USDJPY as traders seek yield differentials.
2. Bank of Japan's Dovish Policy
In stark contrast to the Fed, the Bank of Japan (BoJ) remains committed to its ultra-loose monetary policy, including negative interest rates and yield curve control. The BoJ's dovish approach continues to weigh on the Japanese yen, especially in an environment where other major central banks are tightening monetary policy. While some market participants expect the BoJ to consider policy changes in the future, there have been no concrete signals indicating a shift in the near term. This widening policy divergence between the Fed and BoJ is a key factor supporting a bullish outlook for USDJPY.
3. Safe Haven Demand Waning
The yen is traditionally viewed as a safe-haven asset, particularly during periods of global market volatility. However, recent market stability, coupled with optimism surrounding global growth prospects, has reduced demand for the yen as a haven. As risk sentiment improves, investors are more likely to allocate capital into higher-yielding assets, which could further weaken the yen.
Moreover, geopolitical tensions that previously supported yen demand have eased slightly, making USDJPY more likely to drift higher in a low-risk environment.
4. U.S. Treasury Yields Rising
Another factor contributing to the bullish bias in USDJPY is the rise in U.S. Treasury yields. Higher yields on U.S. government bonds make the dollar more attractive to foreign investors, adding upward pressure to USDJPY. The correlation between USDJPY and U.S. Treasury yields is well-documented, and as yields rise, so too does the currency pair. Traders will be closely monitoring U.S. economic data next week, including durable goods orders and GDP figures, to gauge the potential for further yield increases.
5. Technical Analysis: Key Support and Resistance Levels
From a technical perspective, USDJPY is trading within a well-defined range, but with a slight bullish bias as long as it holds above key support at the 147.50 level. A break above the psychological 150.00 level could open the door to further upside, with resistance seen at 151.50. On the downside, failure to hold above 147.50 could lead to a test of lower levels around 146.00. Momentum indicators, including the Relative Strength Index (RSI), are currently neutral but leaning slightly toward overbought territory, suggesting room for further gains before a pullback.
6. U.S. Economic Data Next Week
Next week, market participants will pay close attention to several high-impact economic reports out of the U.S., including the Durable Goods Orders on Tuesday and GDP Growth on Thursday. Positive readings on these metrics could fuel further gains in USDJPY, reinforcing the bullish bias. Conversely, any disappointing data could dampen USD strength and lead to some consolidation in the pair.
Conclusion
Given the combination of hawkish signals from the Fed, the BoJ's ongoing dovish stance, rising U.S. Treasury yields, and waning safe-haven demand, USDJPY appears to have a slightly bullish bias heading into next week. Traders should watch for any shifts in risk sentiment or unexpected economic data that could alter this outlook. The key levels to watch are 147.50 for support and 150.00 for resistance.
Keywords: USDJPY forecast, USDJPY bullish, USDJPY analysis, Bank of Japan policy, Federal Reserve rate hikes, U.S. Treasury yields, Japanese yen, safe-haven demand, forex trading, USDJPY technical analysis, USDJPY key levels, USDJPY next week, trading USDJPY.

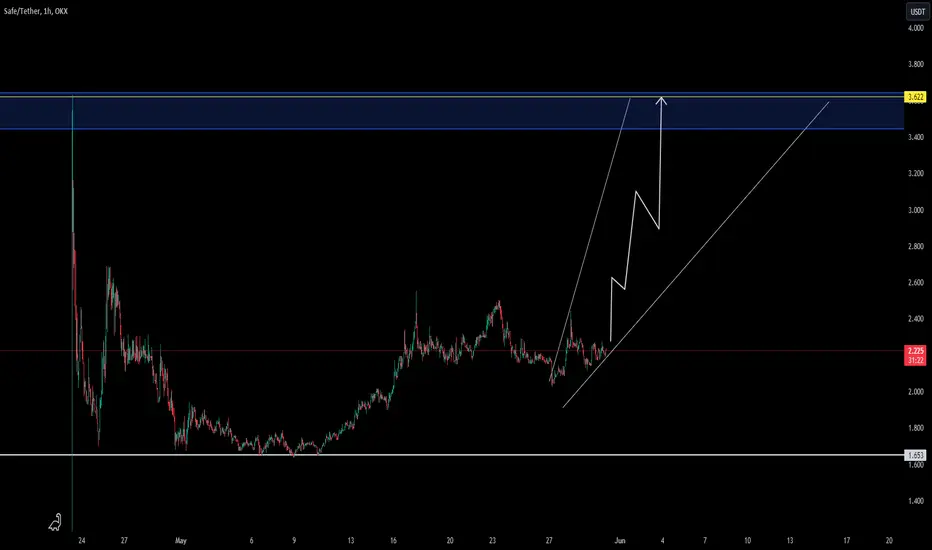
SAFE NEW INCREASE VOLUMEHello traders,
SAFEUSDT is showing an interesting reversal pattern that could signal a new trend towards its previous all-time high (ATH) level.
Today, the coin has demonstrated a new trend activation, prompting us to update the idea chart to reflect this increased potential.
There is a high probability that we will see a rise in volume in the upcoming time frames.
Markets are going on their way, and there is not always a reason that the market should move directly. Sometimes it takes more time before the trend gets a confirmation.
there are no guarantees in the market and This idea is not trading advice.
The goal is to check where are the moment possibilities in trading, and the possibilities that the market can have in the coming time frames. ( depending on study and high chance)
#DXY #USD #Dollar #Index #Eddy#DXY #USD #Dollar #Index #Eddy
(( If he breaks the areas and swaps them with this kind of movement, I expect the supply range to grow! )) Then!... In My Opinion... The US Dollar is the most Valuable & Safest Asset! What do you think?

SHA: $0.00077 | Digital iNHERiTANCE an Asset Management bffa next generation asset management
from iDs wallet custody to iDENTiTY
solid team
and niche partners
artificially depressed for a bigger payout for next cycle of bull run
pre arranged deal should be done at 0.01 as validation of goodwill

XAUUSD 22/10/23XU showing us the results of major fundamental events as tensions rise the price of gold is sure to follow, as one of the safest assets to own even in 2023 gold is worth its weight! (unlike the USD)
heading into this week iam looking for a low run into another new high from this very favourable asset.
longs are for sure but a small rebalance is in order so will be looking out for this to come at some stage.
Remember to always read order flow and follow what price is showing you instead of trading based on your desired direction. And, as always, stick to your risk and your plan.
We'll be closely monitoring market openings and price action throughout the week. If you find this analysis useful, let us know in the comments below and hit the boost button to show your support. Here's to a successful week of trading!

Gold - was, is and will always be our Safe Haven!Hello TradingView Family / Fellow Traders. This is Richard, also known as theSignalyst.
on Daily: Left Chart
After rejecting the 1800.0 support, Gold has been bullish especially after breaking above 1900.0.
Currently, XAUUSD is sitting around a strong resistance in green.
For the bulls to remain in control, we need a break above 1960.0.
📈 In this case, a movement till the 2000.0 round number would be expected.
on H1: Right Chart
Meanwhile, the bears can still kick in. To be confirmed if the last low in gray at 1934.0 is broken downward around.
📉 In this case, we will be expecting a correction till the 1900.0 support.
📚 Always follow your trading plan regarding entry, risk management, and trade management.
Good luck!
All Strategies Are Good; If Managed Properly!
~Rich

SafeMoon SFM #SFM $SFM Safe moon Price.Let's go over some basic charts and look back and see if we can find any real support or structure to help us remain calm and or find our next moves to be made. It takes all the Wind out of peoples sails when they see their coins/tokens going to new lows and or getting the FUD and or feelings they are going to $0.00. We will try and look for some optimistic as well as pessimistic views to go over and try and give people some insight.
Well, we had a few requests for this so here it is. Wasn't too sure about charting SFM Safe moon. But the cats out of the bag now who knows where this will end up. Such a crazy community and such strong HATERS and Supporters. Lol not sure if I'll have the energy for this one consistently.

XAUUSD Ascending tunnel 4h Since 5th of June to today - ascending tunnel formation built out of higher highs and higher lows creating the shape of a tunnel going up.
The range to sustain the pattern is 1789 - 1825.
A break below 1789 with a 4h close, will allow for further decline down, as a first stage to 1760 hourly support.
A break above 1825 with a 4h close, will allow for target of 1920 weekly resistance to reach in the short-medium term.
Important levels range at the high 1790's and low 1800's.
Triple top between 2011-2013 on the weekly level show around 1800 - relevance to today is high.
A break above will be significant for the continuation of the uptrend breaking new highs.
On a fundamental level, needless to say, 10 trillion USD printed money together with overall lack of certainty and hysteria continue to push Gold higher.
Printed money dropping the US $ value and lack of real investment in equities don't provide much ground for drop of Gold price below important supports.

Bonds dont like the clown showThe selling in bonds continues as inflation continues on. Wings in my area are almost $10/lb, highest i have seen this in my life (only 28 tho). Most of the time I check to see if there is any short term bond buying, this time however, short term bonds are selling too. It would seem that investors are spooked, Investors really have no where to run at this point. Crypto winter is here, Stocks did great today but those gains are no longer viable with a hawkish fed, homes are skyrocketing but people are already warning of a top, businesses have a labor shortage and with inflation it's obvious investors do not see US debt as a safe haven anymore. At least for now. I will keep you all updated. Hope you all have your popcorn at the ready.

SIR LONGALOT EYING QUEEN SHITCOIN SAFEMOON FOR NEXT LEGNever traded on any of those DEFI platforms and not arsed ever figuring it out BUT this looks hot as fuck.
Break out of range and use it as base to push ta fuck
Sir Longalot spies this mega pump GOD ENTRY mover

Avery clear signelHello!
I have been away for over a year now. I'm sorry for my absence. I have been working on a new business venture. I now have more time on my hands to produce charts again! With that said.
We are facing here a very clear inversion in bonds as the bond market sees buying and selling. Keep an eye on that as the market is pricing in a rate hike in my honest opinion.

bnbusdt # bnbusdt
ep:502
tp:666
sl:open
market:spot
side:long
time:long time
Ask me all questions
** warning
Disclaimer: This analysis is only for people who specialize in risk and capital management and for others there is a possibility of losing all or part of the capital. **
