Search in ideas for "2014"

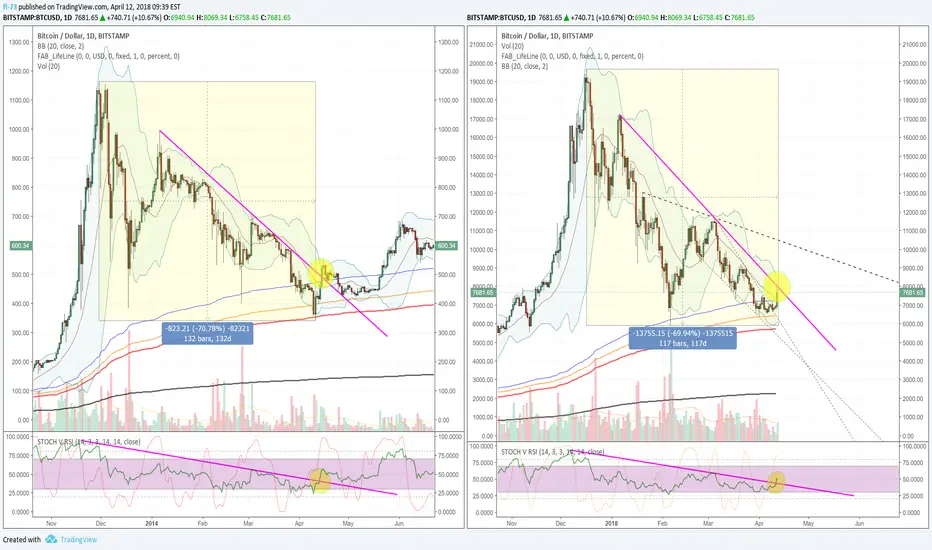
2014 vs 2018 BTC Bear Market ComparisonLooking into the theory that the 2018 Bitcoin chart painting is eerily similar to the bear market of 2014 - Maybe the MM's algo is doing it all over again.
Take a look and decide for yourself.
History may not always repeat, but it sure does rhyme.

2014 CRASH SUPERPOSITION I have updated my superposition charts to reflect the channel break that we had recently.
I believe that this chart is even more realistic than my previous ones as the 2014 ghost pattern (in blue) is only compressed by 25% on time frame. I think this is also reasonable as we have in a slightly faster moving market today than in 2014.
So as you can see the top breakdown happened in 2014 as well and finally it happened to be a bull trap. My advice to everyone can only be to stay careful. I don't think the correction is over. But this is just an opinion.

2014 BTC vs 2018 BTC - History is rhyming right now Looking into the theory that the 2018 Bitcoin chart painting is eerily similar to the bear market of 2014 - Maybe the MM's algo is doing it all over again.
Take a look and decide for yourself.
History may not always repeat, but it sure does rhyme.
I don't necessarily believe we will see $2,700 BTC any day soon, however after unbiased perspective it is not out of the realm of possibility.

2014 BITCOIN CHART ANALYSIS. ARE WE GONNA SEE THE SAME IN 2018?this is an analysis i did on the 2014 chart of bitcoin. It indeed looks very similar to current situation. After the break of the downtrend resistance, the price looked for the trend resistance of the previous bullish/sideways trend. Soon after that, it went back down again to search for new lows after a very long period of sideways boring movement. Are we gonna see the same thing happening now?

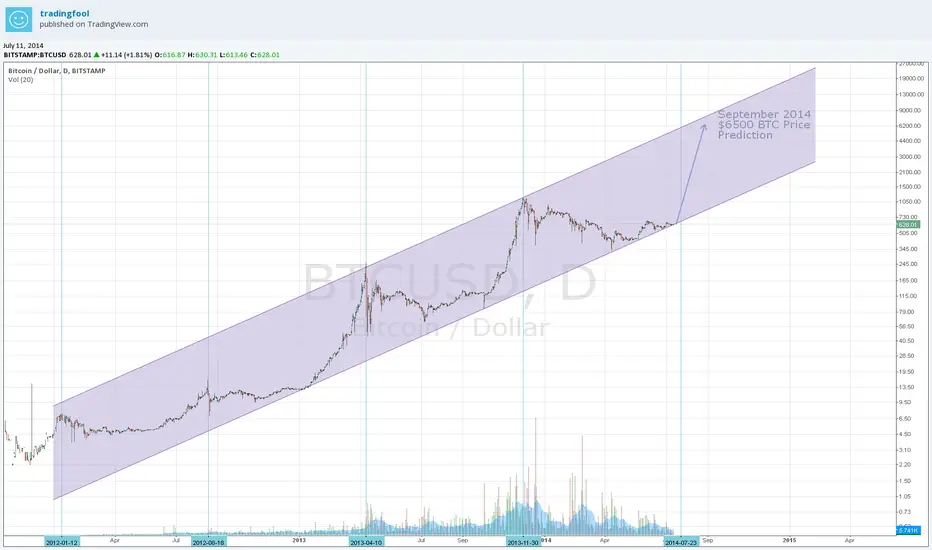
Bitcoin (BTC/USD) Price Prediction for August/September 2014Based on the last 3-4 Bitcoin price spikes, the next one is coming very soon, around August/September of 2014.
The price also appears that it will reach above $5,000 with the next spike, possibly as high as $6,500. After that it will sharply decline in correction as historically has always happened after each spikes. But it will settle to a new high, possible around $2,000.
This was made by user "colinistheman" on bitcointalk.org forums

Bitcoin 2014 fractal - Checks out- 2014 break through log resistance inspired confidence in the market, good news (Dell announces support of Bitcoin, Overstock.com)
- 2018 break through log resistance inspires confidence
-Support line at $8400 based on initial correction after the move through the resistance line in 2014
Trade Idea:
Buy at $8400
Sell at $8970

2014 crash comparison (final stage) : the compression & entryFollowing on from the almighty 2014 crash comparison I made months ago and that went pretty crazy buzzy.. I think that after the patience, the possible entry point described back then is now potentially reached.
Regarding this, I just made a first BTC call today. I putted 5% of my capital here on a Buy&Hold trade which means there is no stop loss on this trade. Some ppl may have thought I was just riding the crypto wave to scam ppl and gather subscribers back then... well... here I am today proving you wrong. I just sold according to the plan until today where I make exactly what I told you months ago... making the actual bullish speculative entry !
Hope this idea will inspire some of you !
Don't forget to hit the like/follow button if you feel like this post deserves it ;)
That's the best way to support me and help pushing this content to other users.
Kindly,
Phil

2014 Bear Run: Fractal, Tailor-Made or AdjustedDear Traders,
the following is an update on my previous fractal study.
The adjustments on the Historical Bear Run of 2013/2014 are mainly: volatility & length.
At the moment, accumulation is the main attraction.
Theoretically, August should bring us a fanatical bull flag and mid-September should be the real spring of the accumulation phase, ending the bear season.
I don't think it is wise to follow fractals blindly, but it sure is fun.
Only time will tell.
Have fun & take care,
S.


Bitcoin 2014 Bear Market RepeatOn the monthly chart bitcoin -3.94% broke through the $6000 support after 10 months of consolidation in a descending triangle , exactly what happened in 2014. If this pattern repeats, which it is, starting off with a small 22% drop, and resting, it should continue down to a full 50% correction forming a bottom at $3000 between January-August of 2019, as it has done in Jan-August of 2015. This would then start a bull run in a neat channel lasting into January of 2020 all the way back up to $20,000, before breaking all time highs and shooting out to $400,000 as the price makes another 2000% gains during the course of 2020. We'll see if the pattern repeats for a third time. out of experience they only happen twice.

BTC comparison 2014 / 2018, break up or down?I have tracked BTC/USD 2014 market movements and correlated them to the current Bitcoin chart, marking possible similarities, resistances & breakouts. The current position of Bitcoin after the recent rally is drawing closer to the upper resistance, so will BTC breakout - fakeout or drop down to the lower resistance - decision time is looming with Bitcoin maintaning it's price ranging at 6500 USD its on course for a clash with the upper resistance by Mid October at any rate.

A little comparision between 2014 bear market and todays market.Just a comparision of the accelerated bear market we are in today vs the 2014 2 year bear market. The numbers and letters have nothing to do with Elliot wave just a way to mark some peaks and troughs. There is a definite similar structure as seen on this chart. I am a forever bull but I like to look at the whole picture and I am not a HODLer. www.tradingview.com

Comparing BTC with the 2013 and 2014 cyclesI keep seeing the 2014 bear fractal charts everywhere. There seems to be a trend going on or something. However, many people forget that before 2014, there was another rally, in early 2013.
Both rallies ended in a large correction, with a subsequent logarithmic downtrend line.
In both cases the trendline was broken. In 2014 it was a failed breakout, meaning that after breaking through the log res, it failed to go above the previous fibonacci resistance (mostly the 0.5 and 0.38 fib levels from the entire rise of the bull move).
It then continued to decline.
In 2013 however, we see a successful breakout from the downtrend line, leading to the second rally of 2013.
The question is now: Which path will BTC take now?
I think that BTC will continue to climb to the 0.38 fibo level, around 11500. Then, the usual oscillations, and afterwards it shall be decided if BTC does another rally like in 2013, or fails and continues to decline like in 2014.
People who pretend to know are liars, no one knows what will happen. However, one can position himself or herself accordingly after we hit 11500.
I will be prepared for both scenarios. Luckily, after the first pumps or dumps, it should be clear which direction BTC will take :)

*BITCOIN BIGGER PICTURE* -2014 fractal-Hi there. I want to share with you this idea of BTC fractal of 2014. Well, let's begin.
First of all, I want to be clear with you: I DON'T want to be in a bear market for longer. But, if it's the case, I will be ready for it, and I'll make money while it happens. So that's why I want to take into account this very possible scenario, so that nothing catches me by surprise.
As you see, the fractal is PERFECT. So, what makes you think that will not continue to be fulfilled?
1) Price action: BTC has gone through the log scale trendline. Well, many people think that because of this we are no longer in a beartrend. But, see what happened in 2014? All those bulls got rekt
If this short bull streak happens, alts will fly so hard. This weeks have been just a preview of what can happen with the alts if BTC rises to the $11-13k zone
2) Fibonacci levels: I have tried to mark it in the best possible way, so that it is seen that the final target is between 78.6 and 85% fib ($3000-4500) IF THE FRACTAL IS FULFILLED. The intermediate bull run would end at 38.2% fib ($11500-12500 approx)
3) MACD: Weekly MACD is going down strongly, and since 2015 it has not gone below 0
4) RSI: blue box has acted as support but has been broken, so now it is a resistance. The orange line is a resistance like the 2014 one. The drop would be expected once it reaches the red circle
5) Stochastic RSI: this indicator needs to be reset after spending a lot of time in the area of <20. So it would be difficult to make a big drop without being in the area of >80. The drop would be expected when it reaches that area red circle
Well that's it. I will update the idea as time goes by. If I see any movement that invalidates the fractal, I'll publish it here
If you liked or liked this, I would appreciate a like and share
Legal disclaimer: *THIS IS NOT A BUY / SELL SIGNAL. Try to do your own research before trading.*

Will 2014 and 2017 repeat again?Will 2014 and 2017 repeat again? We had 2 big bubbles on the monthly Bollingerbands, they give you the signal to sell, next time watch this and if that happens again sell all your coins.

Bitcoin comparison 2014 / 2018 - break up or down? decision timeI have tracked BTC/USD 2014 market movements and correlated them to the current Bitcoin chart, marking possible similarities, resistances & breakouts. The current position of Bitcoin after the recent rally is drawing closer to the upper resistance, so will BTC breakout - fakeout or drop down to the lower resistance - decision time is looming with Bitcoin maintaning it's price ranging at 6500 USD its on course for a clash with the upper resistance by Mid October at any rate.

IS BITCOIN DEAD? [2014 edition]The 2014's one and the current bubble look pretty same... I compared them and found out that both are based on Elliot's waves.
LOOK AT 2018 edition TO FIND SOME SIMILARITIES
I suggest you to read this in order to understand Elliot's waves

Fractal similarity now and 2014This is a more bearish scenario -at least midterm bearish, longterm btc is of course always bullish :)
I notice the similarity of this behaviour with summer 2014. Let's see if this will play out like this again.
In the plot I drew the standard moving average SMA200, as you can see in 2014 it didn't manage to push through it,
and apparently now it behaves also like that, until now.
Let's see what will happen, there is still the chance for a 2013 fractaly and a bullrun, see my last chart.

SILVER 2014 - BTC SIMILARITYPLEASE SEE OUR CHART ON THIS LEVEL OF SUPPORT IN SILVER IN 2014.
NOTICE THE LEVEL OF SUPPORT. JUST AS THE PRICE DROPPED, MARKET SENTIMENT WAS ABOUT 94% BUY.
THE BANKS PUSHED THE SELL AND KER-CHING, BANKS MAKE BUCKS, RETAIL INVESTORS GET REKKT!

Bitcoin August/September 2014 Price Prediction Graph (BTC/USD)Based on the last 3-4 Bitcoin price spikes, the next one is coming very soon, around August/September of 2014.
Note: For some reason the top of the purple parallel lines is way too high. It should be touching the top of each spike. I am new to tradingview graph tools and I couldn't seem to make it remember my setting for some reason. The bottom of the purple box is in the correct location.
The price also appears that it will reach above $5,000 with the next spike, possibly as high as $6,500. After that it will sharply decline in correction as historically has always happened after each spikes. But it will settle to a new high, possible around $2,000.
This was made by user "colinistheman" on bitcointalk.org forums