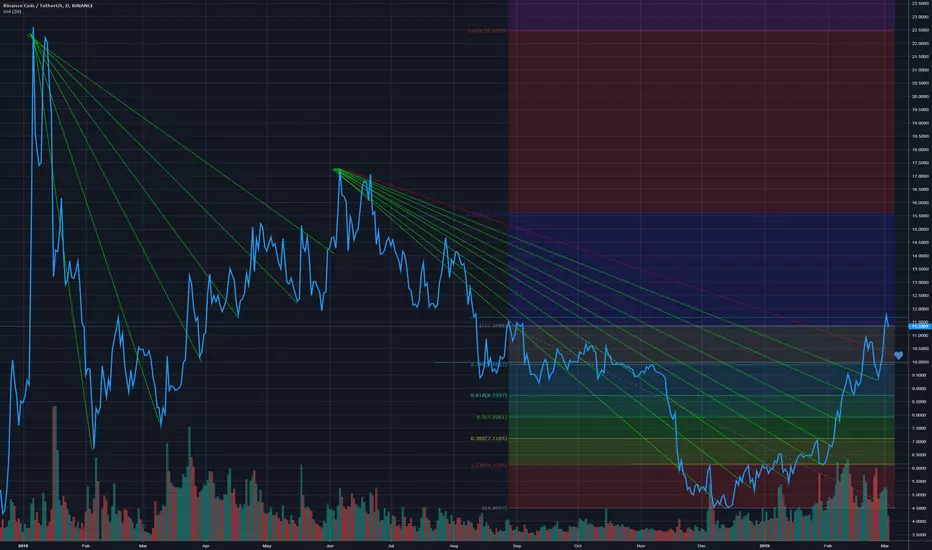
Monthly Analysis: Binance - This is the bottom.A buy signal cannot be more obvious than this.
- Connect the Low to the High of the 22 month bullish wave.
- The 20 month bearish wave just ended in the perfect convergence
of Candlesticks and Western Technicals to give a buy signal.
- A Hammer candlestick signal creates horizontal support at the low
of the pattern at 0.00102. Not only did this occur on the low of the
Bollinger Band, signaling that the asset is oversold, but it also occurred
exactly at the 78.6% retracement of the up-wave.
- Remarkably, there is a convergence of strong Western Technical sell signals.
The high of the Bollinger Band lines up with the Tom DeMark TDST resistance line.
- Assuming an uninterrupted DeMark bullish wave, I see this asset being bullish
until approximately October/November of this year.
Technical Analysis of Bitcoin appears to be quite the inverse of this. Whether
or not you believe that Bitcoin will go higher or lower, confidence in the stability
and security of the reputable Binance exchange makes buying the Binance token
BNB an easy long.
Search in ideas for "CANDLESTICK"

Chainlink - Will it reverse? Signs point to staying in channel.So far, on the 1W, 1D, and 4H charts, and we see the same patterns emerge. We see a bearish reversal candlestick pattern at current level now, which needs to be confirmed near area of value (this could be a fibonacci resistance level, or a current trendline). So we will pay attention to the candlesticks between $11.50 - $12.25, and if we see any pattern emerge that looks like a pivot point or a reversal pattern, it may be time to act.
From what I can see, the long term channel is unlikely to reverse, so we should see it stay within the channel, but beware of any changes in the structure - accompanied by a reversal pattern, this would be a reason to be worried about a reversal.
Another view from previous hours in the same trend channel.

Possible BNB drop [1D timeframe] [SHORT] ** See more below- Volumes are not enough to break the previous resistance, that's why in the past three days we have seen two strong resistances at 11.6$ which were not broken.
- If you look at green candlestick (1D timeframe), you will see that always, after 4/5 candlesticks the price recorrects itself by dropping. We are now at 4th.
- By looking at the green lines on the graphs, the uptrend follows a logic, which suggests a drop
- The main trend-line is almost in the "blu zone" with Fibonacci.
For these reasons I do not think it will go up now, but will drop and reach the heart point (about 10.5$), to recover after some day.
Be carefull guys.
A Response To DLavrov Crypto is an unregulated and manipulated market - This cannot be honestly disputed
Based on my personal analysis of 1W BTCUSDT BITTREX , I think that the entire price movement from January 28th to present day can be precisely explained based on the Tom DeMark indicator .
I don't want to be a person who vandalizes Top Authors' Trading Ideas by posting my own charts in the comments section as a way to advertise my ego, so I will describe in words the Tom DeMark algorithm and why price action was predictable. This will be a long post.
First some back-story: The reason that we use candlesticks on charts is because of Steve Nison . He is the father of Candlestick Analysis. Steve Nison in his seminars teaches about "trend exhaustion" . What he teaches is the work of Tom DeMark. What I'm about to explain is information which is known to the richest institutional traders in the world. There are large organizations who specialize in and only trade based on Tom DeMark's work. I begin:
Tom DeMark developed an algorithm, a specific set of rules which predictably identify points of TREND EXHAUSTION in charts of all time frames, across all markets. The algorithm and psychology is thus:
How To Identify Trend Exhaustion:
1) Identify a SETUP where 9 ***consecutive*** candles close higher/lower than the open/close 4 periods earlier. [ MOMENTUM ]
1) (Expect a 1-4 candle correction in the opposite direction of the momentum.) [ CORRECTION ]
2) This MOMENTUM creates a COUNTDOWN (TREND). After the 9th candle, identify 13 additional candles (they do not need to be sequential) whose close is higher/lower than the open/close 2 periods earlier. [ TREND ]
2) (The TREND which was created by the MOMENTUM of the SETUP has exhausted itself. Expect a correction in the opposite direction of the trend.) [ EXHAUSTION ]
TL;DR : This recent price action which we observed on the 1W chart was caused by a chain of events begun on May 14th 2018. Events:
1) Tom DeMark Sequential on May 14th 2018 identified a period beginning 9 consecutive days of bearish MOMENTUM.
2) This bearish MOMENTUM exhausted itself on July 09 2018 and culminated in a +34% price correction, ending 3 periods later on a Bearish Engulfing Pattern.
3) The Tom DeMark bearish COUNTDOWN began on August 06 2018 where for the first time price closed lower than the candle 2 periods earlier.
4) The Tom DeMark bearish COUNTDOWN culminated on the 13th close lower than the close 2 candles prior, on January 28th 2019 . This completed the Tom DeMark SETUP+COUNTDOWN and indicates an end to the bullish trend which began on May 14th 2018 .
5) What followed immediately thereafter was the +10% move which 3 periods later peaked at $4,200 .
What should we expect now based on Tom Demark analysis? By my interpretation, I anticipate a period of 5 MONTHS of a bullish trend on 1W charts, completing a Tom DeMark 9-13-9, and expect a pullback at this point, April 01 2019.
Summary: I believe that this price action occurred in an unregulated and highly manipulated market but that based on Technical Analysis using the Tom DeMark methodology, this price action was anticipated and acted upon by BIG MONEY INSTITUTIONS and traders who specialize in this indicator. In a field which encompasses everything from Ascending Triangles to Heikin Ashi Candles, Gann Boxes to Fibonacci Retracements, Short Positions, Long Positions, Leverage, Market Fundamentals, Elliott Waves, and flying Bitcoin rainbow unicorns, there is no one trader who is a master of everything.
I WISH TO LEAVE ON THIS POINT:
Some of you may have found my analysis informational and will use this knowledge to further your trading education to increase your profitability as a trader. To those of you, you're welcome. I share freely from the kindness of my heart and sharing knowledge lightens my soul and makes the world a better place. To those of you who have not found my analysis informational, I do not think that you will berate me and inundate me with insults as I have not offended you. I ask you to heed my words: Dmitriy Lavrov is a kind and beautiful person who for years has shared his hard and costly knowledge with the TradingView community for free . He posts Trading Ideas because he wishes to help people improve their lives . I have the great honor to work with Dmitriy on the personal community which he is building and I can tell you first hand that he is a rare and trustworthy, kind and humble, honest and beautiful man. I ask you to please stop being negative and using his TradingView comments section as an emotional garbage can . He is a human and like all of us he has feelings which he must live with every day. It is a finger in the eye and a punch in the stomach to do something kind for people for free and to be insulted and injured for it. I ask you to please reflect on your poor behaviour and stop.
Thank you for your time.
I encourage you all to study Steve Nison and Dmitriy Lavrov to become expert traders . Farewell.
zerocashcool

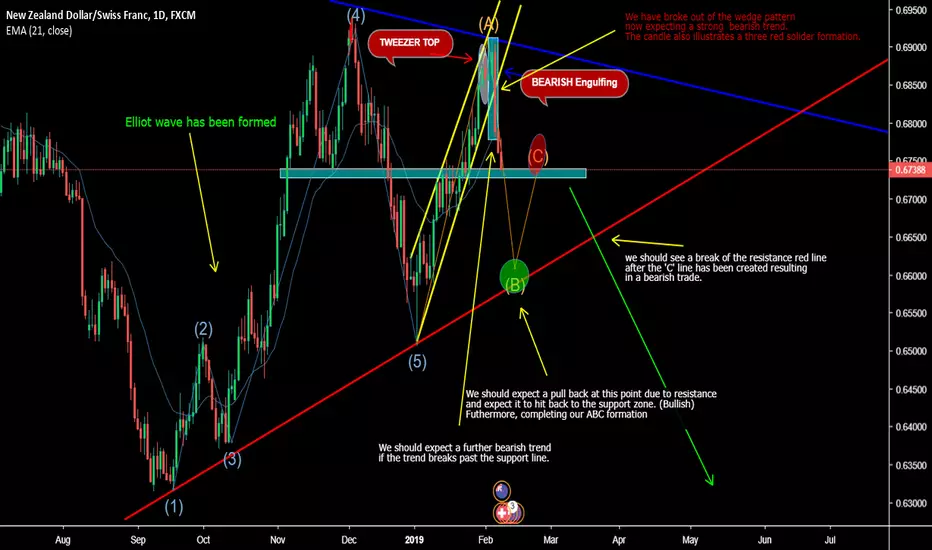
NZDCHF SELLELLIOT WAVE HAS BEEN FORMED. THIS IS THEN FOLLOWED WITH AN ABC FORMATION.
WE HAVE FORMED A TWEEZER TOP AND BEARISH ENGULFING WHICH IS A STRONG CANDLESTICK SIGN THAT THE TRADE IS MOST LIKELY GOING TO CONTINUE TO BE BEARISH.
WAIT FOR THE CANDLESTICKS TO BREAK PAST THE SUPPORT LINE THEN SELL.
Candlestick tradetrade based on shooting star candle and pattern formation along with downtrend formation.

BTC QM or inside bar candlestick#BTC/USD
$BTC in 3months chart
if price success to close above $58787.6 price will move upward to touch $100k.
and if close below $58787.6 it is possible to drop around $17k.

EURUSD-Weekly Market Analysis-Feb21,Wk4EURUSD is not showing the clearest sign of the market movement, it can swing either direction, if to choose a direction to go, I will choose to short it, the reasons as follows
1) The candlestick forms within the sell zone
2) The daily chart close with a long wick above the candle
3) it is a weak bearish candle close on the 4-hourly chart, but it is still a bearish engulfing candle.
Breaking and closing below the previous low candle would prolong the bearish movement to 1.1981

Daily Candletick Projection For FridayThis is my daily candlestick projection for Unilever, this is to support my call for $62.50 by 12/18. If price drops tomorrow I will be averaging down greatly.

Candlestick Analysis of Bitcoin shows a bearish scenarioAs you can see from the charts, I have simply pointed out the previous candles which was again formed yesterday on one day chart. Powerful reversals had been started after this candle in the past. Although, it is not guaranteed that such candles always lead to reversals, but this definitely seems to be a bullish trap until it crosses 12000. Until then I would day trade rather than going Long and Holding for few days.
One more thing I would like to point out is yesterday's candle failed to cross the line which I have drawn from the December's top. (I don't know if this counts or not)
I may be right or wrong. So please make your own decisions and view it as education material and not to make trades.
My earlier two analysis proved to be right, so I hope to be right this time too and continue with my 100% track record.

3M Wave Analysis – 21 May 2025
- 3M reversed from multi-month resistance level 154.00
- Likely to fall to support level 145.00
3M recently reversed down from the multi-month resistance level 154.00 (which has been reversing the price from the end of January) intersecting with the upper daily Bollinger Band.
The downward reversal from the resistance level 154.00 formed the daily Japanese candlesticks reversal pattern Evening Star.
Given the strength of the resistance level 154.00 and the overbought daily Stochastic, 3M can be expected to fall to the next support level 145.00.

S&P 500 (March 2025) - Expecting Resistance At All-Time HighsA rally to ATH is always a good sight to see but what I don't want to see is a fake out, especially in the higher timeframes like the weekly or daily.
Candlesticks like doji's, shooting stars just above ATH can increase the likelihood of a retracement back down into previous inefficiencies.
For the next two weeks, we all are going to be on a wild ride!

[W] ACB - SMA 9/20/50 Golden Cross - BuyI've never researched cannabis stocks before, I don't know anything about the industry, and I might be dead wrong about what I'm seeing but based on candlesticks, oscillators, fibonacci, and moving averages I'm seeing this being an opportunity to buy and hold until price hits EMA 200 on the up side around $50. Do your own analysis and see what you can see.

MSFT: Technical Weakness Ahead of EarningsNASDAQ:MSFT reports next week but is having some selling pressure ahead of its report. The two very small-bodied indecision candlesticks with wicks and tails, and now followed by a larger down day, indicate weakness for potentially more downside. However, because weak to moderate support levels are not far off, selling short is not a good idea for swing traders.

Gold has a cluster of morning star candlesticks in the day frameAccording to the book, the trade is like this, with the second goal, but I think this is a candle trap for big fish to collect goods at lower prices.
Consider locking in profits at target 1 or not reaching target 1, and wait to consider further. I like the scenario of a quick 60-70 increase in price to the 2100 range and then withdrawing the candle's wick to decrease quickly once more.

SGDMYR may weaken further... SGDMYR in the coming week it reach a sensitive price range 3.2166, in the coming week's Weekly Candlesticks if it Break and Close below 3.2166, 3.2000 will be broken.

S&P 500: Will October’s Lows Be Retested?It’s common to hear strategists predicting the S&P 500 will retest its October lows. Today’s charts consider the big index to ask whether its technicals support such a deep pullback.
First, the daily chart may have a basing pattern around 3,800. Also notice some potentially relevant candlesticks, starting with a hammer on December 22. The New Year began with an outside day (and false breakdown under 3,800), followed by an inside bar on Wednesday. That kind of price action may suggest prices are finding a floor.
Second, the Relative Strength Index has been turning higher and is now above its RSI-based moving average.
Taking a step back, remember that the index based at 3,600 as the fourth quarter began. Is it now basing 200 points higher as a new quarter begins? (Both times defying projections of a 3,200 floor.)
Next is the S&P 500’s weekly chart. The 3,800 level represents a 50 percent retracement of the rally between early October and late November. It’s also near a monthly low from last May.
In addition, the last three weekly candles have long tails, which may suggest buyers have defended lows.
Finally, breadth appears to be strong. (The Advance/Decline line has continued to push higher and is back near its recent peak.)
Of course, upcoming events like CPI on January 12 and corporate earnings are potential risks. But if the index holds its ground through those headlines, traders may find it’s already established a new and higher low.
TradeStation has, for decades, advanced the trading industry, providing access to stocks, options, futures and cryptocurrencies. See our Overview for more.
Important Information
TradeStation Securities, Inc., TradeStation Crypto, Inc., and TradeStation Technologies, Inc. are each wholly owned subsidiaries of TradeStation Group, Inc., all operating, and providing products and services, under the TradeStation brand and trademark. TradeStation Crypto, Inc. offers to self-directed investors and traders cryptocurrency brokerage services. It is neither licensed with the SEC or the CFTC nor is it a Member of NFA. When applying for, or purchasing, accounts, subscriptions, products, and services, it is important that you know which company you will be dealing with. Please click here for further important information explaining what this means.
This content is for informational and educational purposes only. This is not a recommendation regarding any investment or investment strategy. Any opinions expressed herein are those of the author and do not represent the views or opinions of TradeStation or any of its affiliates.
Investing involves risks. Past performance, whether actual or indicated by historical tests of strategies, is no guarantee of future performance or success. There is a possibility that you may sustain a loss equal to or greater than your entire investment regardless of which asset class you trade (equities, options, futures, or digital assets); therefore, you should not invest or risk money that you cannot afford to lose. Before trading any asset class, first read the relevant risk disclosure statements on the Important Documents page, found here: www.tradestation.com .

BTCUSD LONG POSITONPrice action is telling us that the selling power is slowly becoming exhausted meaning the bulls we taking charge again. I believe the market will go up to where I have my TP level.
The candlesticks suggest that there is due to be a reversal which is why I have bought in where I have.
Simply easy analysis and we shall see where it takes us.
Happy Trading.

CRUDE OIL (WTI) Detailed Technical Outlook 🛢
Update for WTI Crude Oil.
In this video, we will analysis candlesticks together.
We will identify key level.
We will discuss potential scenarios.
❤️Please, support this video with like and comment!❤️

SPY sooner or later it will reverse trend$SPY - A Morning star is a visual pattern consisting of three candlesticks that are interpreted as bullish signs by technical analysts. A morning star forms following a downward trend and it indicates the start of an upward climb. Let's keep an eye out for the next one.

Amgen Could Be ToppySometimes in a bear market a handful of stocks remain closer to their highs before rolling over. Amgen (AMGN) could face such a condition.
The main pattern on today’s chart are the candlesticks of July 8, 11 and 12. The drugmaker attempted to push above $249 but each time closed below that level. Also notice how this price area roughly matches the closing price before the high-volume bearish gap on April 28.
The result could be a lower high. This may indicate sellers are back in control, especially with a potential double top near $258.
Next, stochastics are dipping from an overbought condition.
Finally you have the 50-day simple moving average (SMA), which AMGN held on Thursday. A break under this level could make traders expect a retest of the recent lows below $230.
TradeStation has, for decades, advanced the trading industry, providing access to stocks, options, futures and cryptocurrencies. See our Overview for more.
Important Information
TradeStation Securities, Inc., TradeStation Crypto, Inc., and TradeStation Technologies, Inc. are each wholly owned subsidiaries of TradeStation Group, Inc., all operating, and providing products and services, under the TradeStation brand and trademark. You Can Trade, Inc. is also a wholly owned subsidiary of TradeStation Group, Inc., operating under its own brand and trademarks. TradeStation Crypto, Inc. offers to self-directed investors and traders cryptocurrency brokerage services. It is neither licensed with the SEC or the CFTC nor is it a Member of NFA. When applying for, or purchasing, accounts, subscriptions, products, and services, it is important that you know which company you will be dealing with. Please click here for further important information explaining what this means.
This content is for informational and educational purposes only. This is not a recommendation regarding any investment or investment strategy. Any opinions expressed herein are those of the author and do not represent the views or opinions of TradeStation or any of its affiliates.
Investing involves risks. Past performance, whether actual or indicated by historical tests of strategies, is no guarantee of future performance or success. There is a possibility that you may sustain a loss equal to or greater than your entire investment regardless of which asset class you trade (equities, options, futures, or digital assets); therefore, you should not invest or risk money that you cannot afford to lose. Before trading any asset class, first read the relevant risk disclosure statements on the Important Documents page, found here: www.tradestation.com .

NZD weaknessNZD weakness all around, i think this will go down too, didnt reach resistance but candlesticks showing me weakness

Bitcoin Technical AnalysisCandlesticks are the fastest way to show the state of the market in my opinion. Currently, the weekly candle is a bearish candle with antennae appearing, reflecting buying force appearing but selling force still prevails as shown in the body of a very long bearish candle, so the downtrend prevails. It is possible to end this week with a doji before a bearish or bullish candle appears to confirm whether the market continues to decline or rise.
Currently BTC price is at 29,000 below the 32,000 support price line. If BTCUSDT price fails to break above $32,000, the bear market continues and BTCUSDT continues towards $19,000.
Therefore, we need a financial plan to buy BTC at the best price and a suitable strategy to increase assets.
