GOLD longtrend line candlestick pattern
trend line candlestick pattern
trend line candlestick pattern
------------------------------------------------------------->money manage is very important *********************
Search in ideas for "CANDLESTICK"

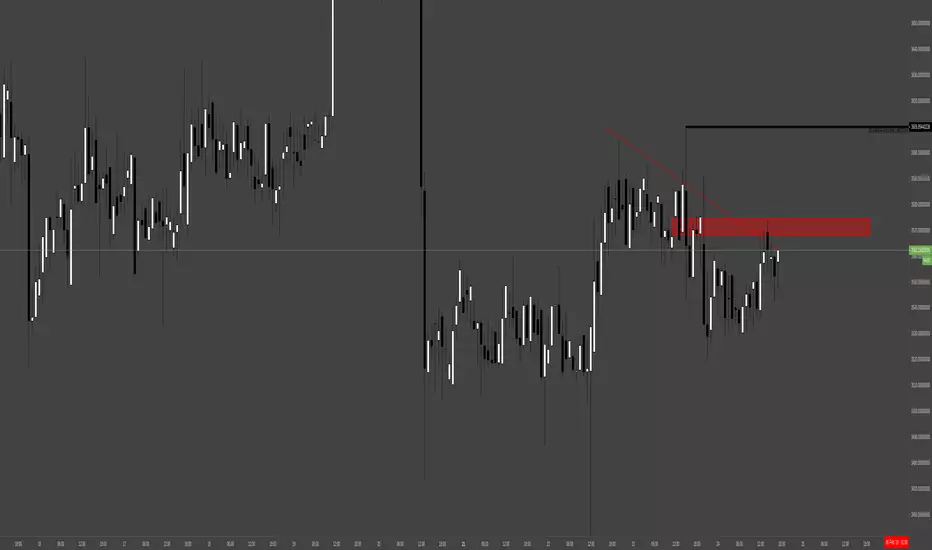
PB&J - Short Trade ExamplesPB&J - Short Trade Examples
- After an SMA 10 / EMA 30 Dead Cross, the time frame can be viewed from a short perspective, especially so when the market is in a down trend. I published a Weekly analysis of Bitcoin suggesting prices falling into $50,200 and $45,600. While I have long trades open at these locations, I took this opportunity to look for short opportunities on the 4H time frame, and this highlights the Nison PB&J strategy perfectly.
- Wait for a pull up into the sweet spot between the moving averages. Wait for a bearish reversal candlestick pattern to close(!) and Western technical confirmation before opening a short trade. If the candle closes as a High Wave, Doji, or Pivot High, consider placing a short trade with a stop loss above the pattern high with a profit target of a recent swing low.
- You can take profit in whichever way you want, selling a percentage of your position at your target and letting the rest ride, perhaps with a trailing stop.
PB&J is a brilliant strategy and with expert knowledge about candlestick analysis you can make a ton of money. If you haven't learned your candlestick analysis from Steve Nison - you've learned second-hand garbage which will cost you money. Follow the white rabbit.

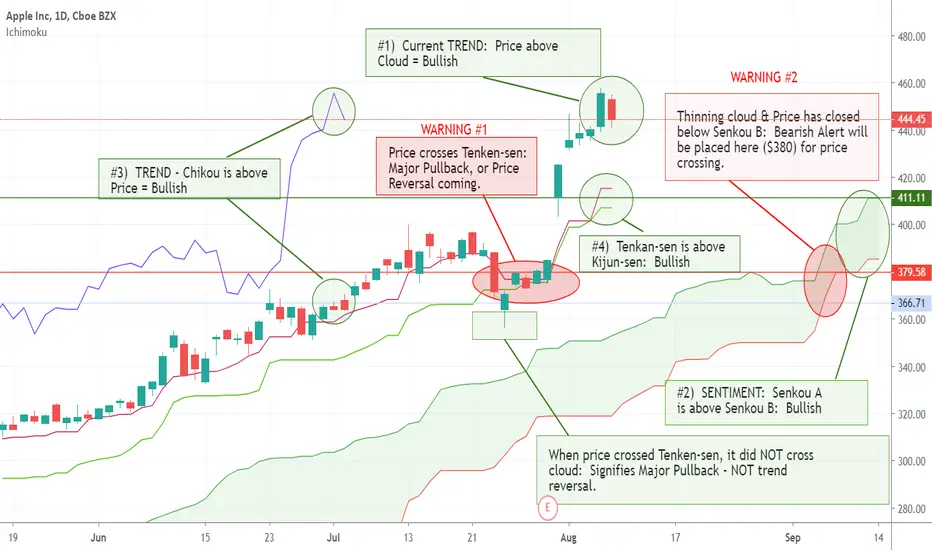
What does Ichimoku tell us about AAPL right now?If we look at AAPL a different way, again - looking at only the technicals - we see the 4 rules of Ichimoku are telling us that this stock is currently: Bullish.
That being said, there are some red flags popping up that I have also labeled. We could nit pick a couple more, but I ran out of room and wanted to keep this as simple as possible.
4 Rules:
1) Price in relation to Cloud: Price is Above Cloud = Bullish
2) Tenkan-sen in relation to Kijun-sen: Tenkan-sen above Kijun-sen = Bullish
3) Relationship of Chikou to Price: Chikou is Well Above Price = Bullish
4) Senkou A in relation to Senkou B: Senkou A is over Senkou B = Bullish
Warnings:
1) Price has crossed paths with Tenkan-sen - Signifying either a Major Pullback, or a Trend Reversal: The price has crossed over the Tenkan-sen line - this is a major red flag! We look closer, and find the price never surpassed down to, or through the Cloud. So this means this is a Major Pullback, but not a Trend Reversal.
Looking to the futhure, we see the price that has crossed this line, has also crossed below Senkou B - Signifying an entry point we want to stay AWAY from. So we draw a line at this spot, count the number of bars that consolidated at this point, and we will set an alert here.
2) The Cloud itself is thinning. A thinning cloud leads to a higher probability of a Trend Reversal. As we just had price hitting Tenkan-sen, we will start watching Candlestick patterns for signs of Reversals.
In one of my other posts, we already identified the 2 Candlestick pattern from Today and Yesterday, as a Bearish Harami. This is significant, and normally a sign of a reversal. We must look for 1 more Candlestick to confirm!
Thanks!
Bitcoin Falling Window = 3K?
Candlestick patterns originated in the West like this:
Steve Nison was consulting for one of the biggest firms at the time. In the other room he heard a Japanese analyst practical yell in excitement: "We have a rising window!" Steve went in to see what it was all about and the analyst was holding a huge book with candlestick charts which they and Japan would mail back and forth to each other every week. Everything we know about candlestick charts originates with this "Rising Window".
Here on 1H BTCUSDT we have a GAP UP in price. This means that demand was so large that the candle gapped above even the previous high of the candle. This is extremely bullish, so much so that the window becomes some of the strongest support you can find in trading. The smaller the window, the more accurate and strong the support. The bottom end of the window is the strongest part of it. What I illustrate in the image is that the rising window support did not hold - e.g. extremely bearish behavior.
In Forex, Rising/Falling Windows should be extremely rare, on time frames like 1H with a heavily traded currency pair like BTCUSDT.
Maybe this is even a case for a test of 3K...
Ethereum Appears to Have Bottomed (as well!)Almost the entire cryptocurrency complex rebounded today, following two days of heavy selling. The appearance of one of my favorite (and only) chart patterns I pay attention to gives me the confidence to write this note. I've been trading the markets since 1995, and in that time I've realized that there is vastly more "technical analysis" that DOESN'T work, than does. One of the few things you can have confidence in the markets is the appearance of a HAMMER candlestick pattern following a sell off. And there seems to be a logical explanation for its formation. Markets are made up of small investors and huge institutional investors, market makers, hedge funds, and other large investors. These well-connected investors tend be better informed than those of us little guys. There is a vast amount of information available on the internet for the HAMMER candlestick, but I will briefly summarize it by saying that it is a candlestick with the open, high, and close, all within relatively close distance to each other, and a long tail for a LOW of the day. Essentially what is happening is large investors are purposefully forcing the price down taking out stops as it plunges. They are essentially picking up cryptocoins (or whatever it is you're trading) on the cheap! After they have accumulated the available supply at low prices, the price is forced back up. The more thinly traded the market, which cryptocurrencies are, the more the technique works. That's why I've highlighted a number of them here on the chart. It's a strategy works, and will continue to work--until it doesn't. ;)

Litecoin Appears to Have Bottomed Almost the entire cryptocurrency complex rebounded today, following two days of heavy selling. The appearance of one of my favorite (and only) chart patterns I pay attention to gives me the confidence to write this note. I've been trading the markets since 1995, and in that time I've realized that there is vastly more "technical analysis" that DOESN'T work, than does. One of the few things you can have confidence in the markets is the appearance of a HAMMER candlestick pattern following a sell off. And there seems to be a logical explanation for its formation. Markets are made up of small investors and huge institutional investors, market makers, hedge funds, and other large investors. These well-connected investors tend be better informed than those of us little guys. There is a vast amount of information available on the internet for the HAMMER candlestick, but I will briefly summarize it by saying that it is a candlestick with the open, high, and close, all within relatively close distance to each other, and a long tail for a LOW of the day. Essentially what is happening is large investors are purposefully forcing the price down taking out stops as it plunges. They are essentially picking up cryptocoins (or whatever it is you're trading) on the cheap! After they have accumulated the available supply at low prices, the price is forced back up. The more thinly traded the market, which cryptocurrencies are, the more the technique works. That's why I've highlighted a number of them here on the chart. It's a strategy works, and will continue to work--until it doesn't. ;)

USD/CHF Short Setup – In 3 StepsUSD/CHF Short Setup – Daily Rejection and Monthly Rocket Booster Confirm Bearish Outlook 📉🔥
The USD/CHF OANDA:USDCHF currency pair is shaping up for a compelling short trade, backed by clear technical signals across multiple timeframes.
On the daily chart, price action is currently trading below the 13 EMA, a widely respected dynamic trendline that often acts as resistance in bearish markets.
Staying under this level suggests that short-term momentum remains tilted to the downside. Adding weight to this bearish bias is the appearance of a long
upper shadow on the most recent daily candle. This candlestick formation signals strong selling pressure at higher levels — buyers attempted to push
price upward but were met with aggressive selling, leaving behind a sharp rejection wick. Such long upper shadows are often a precursor to deeper downside follow-through.
Zooming out to the monthly chart, the Rocket Booster Strategy has aligned bearish, reinforcing the downside bias. This strategy — designed to catch explosive moves when momentum and structure agree on higher timeframes —
suggests that the pair could be preparing for a sustained leg lower rather than just a short-term pullback.
This combination of signals creates what traders call multi-timeframe confluence: the daily chart gives us the entry trigger, while the monthly chart
provides the confirmation and longer-term directional bias. When both are in harmony, setups tend to have higher conviction.
Key Points at a Glance:
Daily Chart → Price below 13 EMA, bearish momentum intact.
Candlestick Signal → Long upper shadow shows rejection and seller dominance.
Monthly Chart → Rocket Booster Strategy aligned bearishly, pointing to larger downside potential.
Trade Idea:
Aggressive traders may consider entering short positions near current levels while conservative traders may wait for a daily close confirming continued
weakness below the 13 EMA. A logical stop-loss placement would be just above the recent long upper shadow, protecting against false breakouts. Profit
targets could be staged at recent swing lows, with an extended target toward major support on the monthly chart.
With momentum, structure, and rejection signals all pointing lower, USD/CHF appears ready to offer a high-probability shorting opportunity.
Rocket boost this content to learn more.
⚠️ Disclaimer: This analysis is for educational purposes only and should not be taken as financial advice. Trading forex and CFDs carries significant risk and may not be suitable for all investors.
Before risking real money, it’s strongly recommended to practice on a simulation (demo) account to gain confidence with entries, exits, and trade management. Always use proper risk management and develop a clear profit-taking strategy to protect your capital.

GAMUDA - Leading stock in CONSTRUCTION SECTORGAMUDA - CURRENT PRICE : RM4.97
Based on Japanese Candlestick , 30 April 2025 candle was a LONG CLOSING BOZU WHITE CANDLE . At that particular moment, it changed the trend from BEARISH to BULLISH because :
1) Price already above EMA 200 and closed on that day above EMA 50
2) Price closed into ICHIMOKU CLOUD
3) CHIKOU SPAN starts moving above CANDLESTICK
4) MACD also bullish
At current moment, after two days of selling pressure the share price turns positive today and closed higher than previous day's high. This may consider as potential buy on dips for those didn't have position yet. Supported by rising EMAs, the share price may move up to test the all time high level.
ENTRY PRICE : RM4.94 - RM4.98
TARGET : RM5.36 and RM5.57
SUPPORT : Below EMA 50 on closing basis

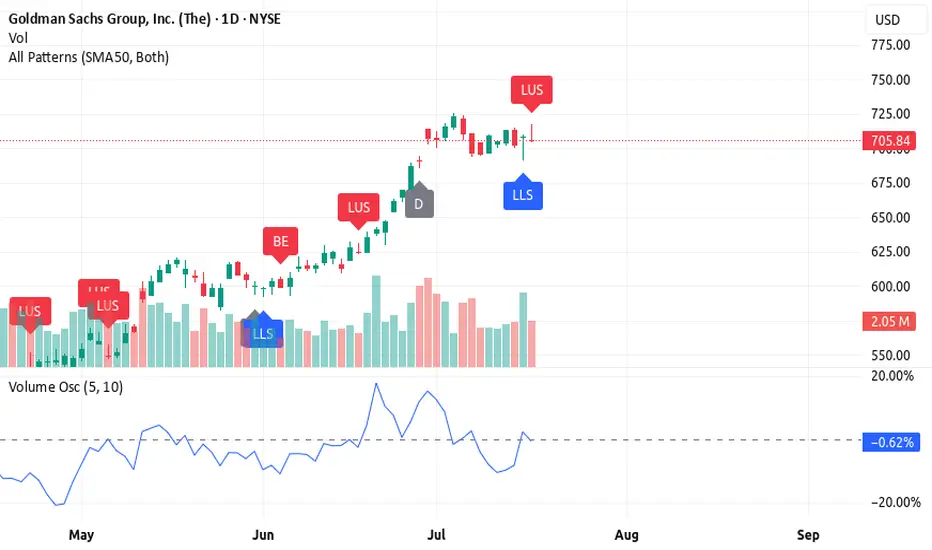
3 Reasons Why Goldman Sachs (GS) Still Looks Bullish🚀 3 Reasons Why Goldman Sachs (GS) Still Looks Bullish (Despite a Bearish Candle)
Goldman Sachs is in a bullish trend, but the latest candlestick is flashing a warning. Here's why GS still looks strong — and what to watch for next 📈
1️⃣ Candlestick pattern – long upper shadow
The long upper shadow shows sellers pushed the price down from the highs, signaling resistance. While bearish short-term, it often happens during strong trends as the market breathes before pushing higher.
2️⃣ High volume on a bearish candle
The negative volume shows resistance, but it may actually represent bear exhaustion. High volume without a breakdown
suggests bears tried to push it down — and failed. Classic fake-out.
3️⃣ Volume oscillator still rising
Despite the pullback candle, the volume oscillator is holding above zero and trending up, showing momentum is still on the bulls' side.
🔥 Rocket Booster Strategy still intact
✅ Price above 50 EMA
✅ Price above 200 EMA
⚠️ Just a temporary shakeout? If the next candle confirms support, GS may continue the bullish push.
⚠️ Disclaimer: Always use a simulation (demo) account before trading with real money. Learn proper risk management and profit-taking strategies to protect your capital.
Is Ethereum Back In Business? A Confluence of Bullish Patterns Is Ethereum Back In Business? A Confluence of Bullish Patterns, Brutal Liquidations, and Fundamental Strength
The cryptocurrency market is a theater of perpetual drama, a relentless cycle of fear and greed, innovation and volatility. In this unforgiving arena, Ethereum, the world’s second-largest digital asset, has once again captured the spotlight. After a period of underperformance that left investors questioning its momentum, a confluence of technical signals, market-shaking liquidations, and strengthening fundamentals has ignited a fierce debate: Is Ethereum truly back in business? The answer is not a simple yes or no but a complex narrative woven from bullish chart patterns, the chaotic fallout of political spats, and the quiet, inexorable growth of its underlying network.
At the heart of the bullish thesis lies a classic technical analysis signal: the Morningstar candlestick pattern. For traders and analysts who scour charts for clues about future price movements, the appearance of a Morningstar on Ethereum's monthly chart is a development of profound significance. Simultaneously, the market has been violently shaken by an $800 million liquidation event, a brutal culling of leveraged positions in both Bitcoin and Ether, reportedly triggered by a public feud between political and tech titans Donald Trump and Elon Musk. This event serves as a stark reminder of the market's fragility and its susceptibility to external shocks.
Yet, beneath this surface-level chaos, a different story is unfolding. On-chain metrics point to a network that is not just surviving but thriving. Institutional interest is surging, evidenced by substantial inflows into newly approved spot Ethereum Exchange Traded Funds (ETFs). Whales, the market's largest players, are sending mixed but largely accumulative signals. And technological upgrades continue to enhance the network's scalability and utility. This article will delve into these competing narratives—the hopeful story told by the Morningstar pattern, the cautionary tale of massive liquidations, and the quietly confident hum of Ethereum's fundamental growth—to paint a comprehensive picture of where the pioneering smart contract platform stands today.
The Morningstar's Dawn: A Technical Harbinger of a Bullish Reversal
In the lexicon of technical analysis, candlestick patterns provide a visual language for market sentiment. The Morningstar is one of the most revered bullish reversal patterns, a three-candle formation that often signals the end of a downtrend and the beginning of a new upward climb. Its appearance on a high-timeframe chart, such as the monthly chart for Ethereum, carries significant weight, suggesting a major shift in market psychology from bearish despair to bullish optimism.
To understand its power, one must first understand its structure. The pattern consists of three distinct candles appearing after a prolonged price decline. The first is a long bearish candle (typically colored red or black), which confirms the continuation of the downtrend and reflects the sellers' firm control. The second candle is the "star" of the pattern—a small-bodied candle that can be either bullish or bearish. This candle often gaps down from the previous one, indicating a moment of acute indecision in the market. The selling pressure that characterized the first candle has waned, but buyers have not yet seized full control. It represents a point of equilibrium, a pause where the prevailing trend loses its momentum. The third and final candle is a long bullish candle (typically green or white) that closes well into the body of the first bearish candle. This final candle is the confirmation; it signifies that buyers have decisively taken over, overwhelming the sellers and initiating a reversal.
The psychology behind the Morningstar pattern is a story of a power shift. The long bearish candle shows sellers are confident. The small middle candle reveals that confidence is cracking; a battle for control is underway. The final strong bullish candle declares the buyers as the victors, signaling that the path of least resistance is now upwards.
Recently, several crypto analysts have highlighted the formation of this very pattern on Ethereum’s monthly chart. After a period of consolidation and price decline, the emergence of a Morningstar suggests that the bottom of the recent downtrend may be in. Analysts see this as a macro reversal signal, a technical foundation for a potential rally. Some have set initial price targets around $3,300, viewing the current resistance levels as temporary hurdles that will likely be broken in the face of this powerful bullish formation. When combined with other indicators, such as trading volume, which ideally should increase during the formation of the third candle, the Morningstar provides a compelling technical argument that Ethereum is gearing up for a significant move higher. While no technical pattern is infallible, its appearance on a macro scale has undeniably injected a strong dose of optimism into the market, suggesting that Ethereum’s period of slumber may be coming to an end.
The $800 Million Purge: A Tale of Liquidations and Political Tremors
Just as technical analysts were celebrating the bullish omens on the charts, the market delivered a brutal reminder of its inherent volatility. A massive liquidation event, totaling over $800 million and by some estimates approaching $1 billion, swept through the cryptocurrency markets, disproportionately affecting leveraged traders in Bitcoin and Ethereum. In a span of just 24 hours, hundreds of thousands of traders saw their positions forcibly closed, a cascade of selling that sent prices tumbling.
Liquidations are the boogeyman of leveraged trading. When a trader uses borrowed funds (leverage) to amplify their position, they must maintain a certain amount of collateral. If the market moves against their position and their collateral falls below a required threshold, the exchange automatically closes the position to prevent further losses. This forced selling creates a domino effect. As prices fall, more long positions hit their liquidation points, triggering more selling, which in turn drives prices down further, liquidating even more positions. This is a liquidation cascade, and it can lead to rapid and violent price drops.
Recent data showed that long positions accounted for the overwhelming majority of these liquidations, indicating that the market was caught off guard by the sudden downturn. Exchanges like Bybit and Binance were at the epicenter of this financial storm, with Bybit alone reportedly accounting for nearly $354 million in liquidations. The largest single liquidation order was a multi-million dollar position, underscoring the high stakes involved.
What triggered this sudden market panic? Many analysts pointed to an unlikely source: a public and increasingly acrimonious feud between former U.S. President Donald Trump and Tesla CEO Elon Musk. The dispute, reportedly stemming from disagreements over a major tax and spending bill, spilled out onto social media, creating a storm of uncertainty that rattled investors. In today's interconnected world, high-profile clashes between powerful figures can have an immediate and tangible impact on financial markets, particularly on assets perceived as "risk-on," such as cryptocurrencies.
The public fallout was seen as a destabilizing event, injecting political uncertainty into an already fragile market. The fear was that the conflict could have broader economic implications or affect the regulatory landscape for technology and digital assets. This sentiment sparked a broad-based sell-off, not just in crypto but across traditional equities as well. For a market driven heavily by narrative and sentiment, the Trump-Musk tussle provided a powerful bearish catalyst, spooking investors and triggering the cascade of liquidations that sent Bitcoin and Ethereum prices sharply lower. The event serves as a crucial counterpoint to the bullish technical picture, highlighting how susceptible the crypto market remains to macroeconomic and political shocks, regardless of its own internal fundamentals.
The Bullish Undercurrent: On-Chain Metrics and Institutional Adoption
While the liquidation event painted a picture of chaos and fear, a deeper dive into Ethereum's on-chain data and ecosystem developments reveals a much more optimistic and resilient narrative. These fundamental metrics, which track the health and growth of the network itself, often provide a clearer long-term signal than the noise of short-term price fluctuations.
A Thriving and Growing Network
One of the most reliable indicators of a blockchain's long-term value is its network activity. On this front, Ethereum is showing undeniable strength. The number of unique active addresses interacting with the blockchain has been on a steady rise. Recent data shows a significant surge, with weekly active addresses surpassing 17 million, a testament to growing engagement and adoption. This isn't just speculative trading; it reflects genuine usage across Ethereum's vast ecosystem, including decentralized finance (DeFi), non-fungible tokens (NFTs), and Layer 2 scaling solutions.
Furthermore, the growth in new users joining the network is a powerful leading indicator of future demand. The rate of new address creation has been on an upward trajectory, signaling that Ethereum's value proposition continues to attract a broader audience. This organic growth is the lifeblood of any network, creating a flywheel effect: more users attract more developers, who build more valuable applications, which in turn attract even more users.
The Rise of Layer 2 and Technological Upgrades
A key driver of this network growth has been the maturation of Layer 2 scaling solutions like Arbitrum, Optimism, and Base. These networks handle transactions off the main Ethereum chain, allowing for faster speeds and dramatically lower fees while still inheriting Ethereum's security. The explosion of activity on these Layer 2s has been a game-changer, alleviating congestion on the main network and making Ethereum accessible to a wider range of users and applications.
Simultaneously, core protocol upgrades continue to enhance Ethereum's capabilities. The recent Pectra upgrade, for example, has improved scalability and further refined the network's deflationary mechanics. Since the implementation of EIP-1559, a portion of every transaction fee is "burned," or permanently removed from circulation. This, combined with the vast amount of ETH locked in staking contracts, creates a dynamic where the supply of available ETH is constantly shrinking. This principle of decreasing supply coupled with increasing demand is a fundamental recipe for long-term price appreciation.
The Arrival of Institutional Capital
Perhaps the most significant bullish development for Ethereum in recent times has been the approval and successful launch of spot Ethereum ETFs in the United States. This provides a regulated and accessible on-ramp for institutional investors to gain exposure to ETH, unlocking a potential wave of new capital. The early data is promising. In May 2025 alone, spot Ethereum ETFs recorded net inflows of over half a billion dollars, a sharp increase from the previous month.
This institutional validation is a powerful signal. It signifies that some of the world's largest financial players view Ethereum not just as a speculative asset, but as a foundational technology with long-term strategic value. This flow of "sticky" institutional money is expected to provide a strong support floor for the price and reduce volatility over the long run.
The Whale Watch: Accumulation and Confidence
The behavior of "whales"—large holders of Ethereum—provides another crucial, albeit sometimes conflicting, layer of insight. On one hand, there have been reports of significant accumulation by these large players. Data shows massive transfers of ETH from exchanges to private wallets, a classic sign of long-term holding, as it reduces the immediately available supply for selling. One notable transaction involved Galaxy Digital moving hundreds of millions of dollars worth of ETH into a private wallet, suggesting strong institutional confidence. Over the past month, data from on-chain analytics firms has shown that whale wallets have increased their holdings, while retail holdings have slightly decreased, a pattern often seen before a bullish market run.
However, the picture is not entirely one-sided. There have also been instances of long-term whales selling off portions of their holdings, contributing to short-term price drops. This reflects the diverse strategies among large holders. Some may be taking profits, while others are positioning for a long-term hold. Despite the mixed short-term signals, the broader trend appears to be one of accumulation and a net outflow of ETH from exchanges, which is a fundamentally bullish indicator. With exchange balances hitting seven-year lows, the potential for a supply squeeze is becoming increasingly real.
Conclusion: Navigating the Storm Towards a Bullish Horizon
So, is Ethereum back in business? The evidence suggests a resounding, if complex, "yes." The current market environment is a fascinating juxtaposition of short-term turmoil and long-term strength. The public spat between Trump and Musk, and the subsequent $800 million liquidation event, underscore the market's vulnerability to sudden shocks and the perils of leveraged trading. These events serve as a healthy dose of caution, reminding investors that the path forward will undoubtedly be volatile.
However, when we look past the immediate noise, the underlying picture is one of robust and accelerating health. The Morningstar pattern on the monthly chart provides a powerful technical signal that a macro trend reversal is underway, suggesting that the recent period of bearish sentiment has exhausted itself. This technical optimism is strongly supported by fundamentals. Ethereum's network is growing at a remarkable pace, fueled by the success of Layer 2 solutions and continuous protocol improvements that enhance its scalability and economic model.
The most compelling evidence, however, comes from the demand side. The launch of spot Ethereum ETFs has opened the floodgates for institutional capital, a structural shift that will likely define Ethereum's market for years to come. This, combined with the steady accumulation by whales and a shrinking available supply due to burning and staking, creates a powerful bullish cocktail.
Ethereum is navigating a perfect storm of conflicting signals. The violent waves of short-term liquidations and political drama can be disorienting. But beneath the surface, the deep currents of network growth, technological innovation, and institutional adoption are flowing strongly in one direction. For investors who can look beyond the immediate horizon, the story told by Ethereum's fundamentals, supported by classic bullish chart patterns, is not just one of being "back in business"—it's a story of a platform solidifying its position as a cornerstone of the decentralized future.

Bitcoin’s Bullish Patterns_Ready for a Breakout!?As I expected in the previous post , Bitcoin( BINANCE:BTCUSDT ) approached the Heavy Support zone($93,300-$90,500) and Support lines but quickly started to rise.
Bitcoin is moving in the Support zone($96,150-$94,700) . And in this increase of Bitcoin in the last few hours, we can see the Morning Star Candlestick Pattern well in the 2-hour time frame .
Educational tip : The Morning Star is a bullish reversal candlestick pattern that forms after a downtrend, consisting of three candles: a large bearish candle, a small indecisive candle, and a strong bullish candle. It signals a potential trend reversal and growing buying momentum.
In terms of Classic Technical Analysis , it seems that Bitcoin has succeeded in forming the Descending Broadening Wedge Pattern , which can be a sign of Bitcoin's increase .
According to the theory of Elliott waves , it seems that the entire corrective waves inside the descending channel were all in the form of a Zigzag Correction(ABC/5-3-5) so that it seems that Bitcoin finally completed the main wave C in the previous hours. If Bitcoin breaks the upper line of the wedge pattern, we can confirm the end of the main wave C .
I expect Bitcoin to be able to touch the Targets I specified on the chart AFTER breaking the upper line of the Descending Channel .
Note: If Bitcoin goes below $94,400, we expect more dumps.
Do you think Bitcoin can finally break out of this Descending Channel? Pump or Dump?
Please respect each other's ideas and express them politely if you agree or disagree.
Bitcoin Analyze (BTCUSDT), 2-hour time frame.
Be sure to follow the updated ideas.
Do not forget to put Stop loss for your positions (For every position you want to open).
Please follow your strategy and updates; this is just my Idea, and I will gladly see your ideas in this post.
Please do not forget the ✅' like '✅ button 🙏😊 & Share it with your friends; thanks, and Trade safe.

Bearish Signals on the S&P 500Despite recently reaching an all-time high of 5,669, the S&P 500's monthly chart is on track to end July with a bearish shooting star candlestick pattern, snapping a two-month bullish phase. Follow-through selling on the chart could see the unit trade as far south as support at 4,776.
Meanwhile, on the weekly chart, last week ended in a bearish engulfing candlestick pattern (which focusses on real bodies, not upper and lower shadows), with the market index down -1.4% week to date. Channel resistance-turned-support extended from the high of 4,607, coupled with support coming in at 5,264, calls for attention as the next layer of support.
Therefore, in addition to monthly and weekly charts showing negative divergences from the Relative Strength Index (RSI), chart studies demonstrate the scope to press lower until connecting with weekly support around 5,300.

Anupam Rasayan Simple Price Action Analysis BullishNSE:ANURAS The Price is in an Uptrend making HHs and HLs on a Candlestick Chart.
The expectation is that it will continue the existing Uptrend and hence will create a new HL and HH in the candlestick chart, this should take the price up to 1254.45 for now. therefore, a Cup like shape might form in this chart.
We also do have a Trap Zone which might stop the current correction and help to create the HL in this chart.
In this kind of chart, one must buy in tranches at every dip and hold for an approx. 28% to 31% Return on Investment. That is 279 to 297 points.

Nvidia Bounce TrackWhile the main scenario for this stock implies a further advancement in price considering the importance of its product(s) in AI development and deployment, this project attempts to anticipate or "catch", a significant reversal signal, preferably with a candlestick shadow at one of the shapes (similar to the examples highlighted in past price action). 2 other relevant occurrences might pop somewhere else in the snapshot, without shadows, but with other candlestick patterns.
A reversal of a wave (:no matter how big or small), provides a strategic entry relative to the context of the market or the context of future potential scenarios, having a tight exit strategy (above the high or in this case below the low of the signal candle), while being open to higher rewards relative to risk.
This Simulation of potential future scenarios, resulting in a hybrid design that takes into account at least 10 such main scenarios, has been carefully selected, processed, and applied, with alien nen technology and mechanisms, brought to you from the depths of a Black Hole, where time and space collapse into a wonder of oneness and transcendence, called Singularity.

SNOW: Positive Technical Patterns Ahead of EarningsNYSE:SNOW is completing a long-term bottom formation that is only visible on a weekly chart. The company was highly touted at IPO but has struggled since then.
Candlestick patterns indicate pro traders in the mix right now. The stock reports earnings Feb 28th, next week. Candlestick patterns and Pro trader influence imply a possible good report this time around.

Be Strong Resistance in Bearish TrendI'm back to trade
now we see the candlestick shows a bearish movement and if we see a price movement that tries to pass 1950 - 1955 and is rejected twice , then there is a support area that has been touched three times at 1810 .
and since this post was made, the candlestick movement is trying to return to the 1950-1955 price, but this prediction will be a reversal because the RSI indicator that I use (more precisely, the Ultimate RSI indicator by Lux Algo) is still in the Oversold realm.
This has been confirmed as a Resistance Line if we look at the movement on Oct 23 and the price falls until it finds the support point as I mentioned before.
So, what do you guys think? Considering that the Fed is still maintaining and even increasing its interest rates, my analysis may still be considered reasonable (or perhaps not at all)

‘Abandoned Baby’ in Amazon.com?Amazon.com tried to rally a week ago. It proceeded to fall on weak quarterly results, leaving some potentially difficult patterns on the daily chart.
First, the single candlestick on February 2 was isolated above the other recent prices. That is sometimes known as a bearish “abandoned baby” -- essentially a failed breakout.
The location of the candlestick is potentially important. By occurring at the falling 200-day simple moving average (SMA), it suggests the longer-term downtrend remains in effect. (It was AMZN’s first test of the 200-day SMA since August.)
It was also near a bearish gap on October 28, which was triggered by weak guidance.
Next, the Relative Strength Index (RSI) is retreating from an overbought condition.
Traders looking for continuation lower may now watch for a potential break of the trendline along the lows of 2023.
TradeStation has, for decades, advanced the trading industry, providing access to stocks, options, futures and cryptocurrencies. See our Overview for more.
Important Information
TradeStation Securities, Inc., TradeStation Crypto, Inc., and TradeStation Technologies, Inc. are each wholly owned subsidiaries of TradeStation Group, Inc., all operating, and providing products and services, under the TradeStation brand and trademark. TradeStation Crypto, Inc. offers to self-directed investors and traders cryptocurrency brokerage services. It is neither licensed with the SEC or the CFTC nor is it a Member of NFA. When applying for, or purchasing, accounts, subscriptions, products, and services, it is important that you know which company you will be dealing with. Please click here for further important information explaining what this means.
This content is for informational and educational purposes only. This is not a recommendation regarding any investment or investment strategy. Any opinions expressed herein are those of the author and do not represent the views or opinions of TradeStation or any of its affiliates.
Investing involves risks. Past performance, whether actual or indicated by historical tests of strategies, is no guarantee of future performance or success. There is a possibility that you may sustain a loss equal to or greater than your entire investment regardless of which asset class you trade (equities, options, futures, or digital assets); therefore, you should not invest or risk money that you cannot afford to lose. Before trading any asset class, first read the relevant risk disclosure statements on the Important Documents page, found here: www.tradestation.com .

"Put"ting An End To The Bear Market with GannI have been bearish since Feb 7, 2022, with a long-term price target of the pre-Corona high, as evidenced in the attached chart "Sound of bubbles bursting" Feb 18 .
I have been using 3 month dated Near the Money Puts on the QQQ.
But what I wanted to share was the use of Gann and the excellent Candlestick recognition in TradingView.
I was looking at tripling down on my Put activity today and performing all kinds of analysis. But what caught my eye was the excellent Gann Box tool. I studied Gann as part of my IFTA Certified Financial Technician exams but was not a big believer.
But see the GANN plot on this chart, wow does it fit perfectly?
See how the boxes and fans correlate with the bear market waves, both pullbacks and bear market rallies.
It also matches well with my Dec 30 put targets.
Also, I want to congratulate the TV team on their Candlestick recognition; it is a great time saver. I also love how it updates in real-time on a 1-minute chart.
Well, that's it from me; suffice it to say:
We are in a bear market.
Until there is complete capitulation, and all the good economic news turns bad, we will stay in a bear market.
My next price target is the Pre-pandemic high.
If you like this, like and follow for further market updates.
Best of luck
Barry

candlestick represents 15 minutes of price movement.A green candle tells us that the price went up during these 15 minutes whilst a red candle tells us that the price went down during the 15 minutes. The open of a green candle is where the price started to form. Let’s say this candlestick started to form at 9:00 oclock then the opening price is at 9:00 whereas the close will be at 9:15 where the candlestick finished its movement. The low represents the lowest point the price was fluctuating during the 15 min period and the high the highest price the candle reached during the 15 min period. Notice here that a green candle has its open below while a red candle has its open price up and close price down since red represents a price decline and green a price incline.
If you are on a one hour chart everything stays the same except the open price will be at 9 and closing price will be at 10.

BTC 4H - Change of Polarity: long
Buyers now assume the greatest risk entering under resistance.
Wait for the market to pull back and test for a Change of Polarity.
Buy on the close of a bullish candlestick reversal signal:
- Hammer
- Bullish Engulfing Pattern
- Morning Star
Set your stop loss below the low of the candlestick pattern.

DXY SELL • a 3RD TOUCH on our D1 downward candlestick
• bearish engulfing candlestick formation on H1
• for the more conservative less aggressive traders entry can be found once the inner upward trendline is broken
• targets are set by the D1 upward trendline

Piercing line Pattern (Reversal Signal)The piercing line is a two-stick pattern, made up of a long red candle, followed by a long green candle.
There is usually a significant gap down between the first candlestick’s closing price and the green candlestick’s opening.

ETHO price upward movement Candlestick pattern on the chart indicates for bullish trend coming. Candlestick pattern "Inversed hammer" is a strong indicator of changing trends which combined with the bounce of RSI allows to think positively about price upward movement. New support ground at 0.1516$ also adds to the prediction. On the 1h chart you can see top levels expected to achieve by ETHO, based on previous sellers pressure at 0.21$. I've added SL and TP areas to illustrate my expectations, on which you can base your decision to enter the market. Enjoy!
