XAUUSD (GOLD) POTENTIAL LONG OPPORTUNITY GOLD POTENTIAL LONG
After this recent week of market activity the commodity market had displayed a strong buyer interest move on Gold. After looking at the daily timeframe chart you can see that price had been holding around the lows since early August of this year. After some time this last week the market had shown strong buyer interest based on the strength of the buyer breach above the significant levels around 1206. After seeing this strong move made by the buyers it had caught my interest and had allowed me to build a possible trading scenario based on that. ALSO A TIP TO INCREASE BIG PROFITS, when looking for significant structure a HUGE tell sign if its a significant level is the strength of the BREAKOUT. ALSO; how do we know if it's a breakout ? THE STRENGTH OF THE BREAK. I usually don't give such profitable tips for free but these two concepts will really allow you to increase profits and your trading probabilities. So, lets dive into it !
1D Chart:
* on this time frame the buyers displayed a strong break above the multi-month structure level around 1206
*the momentum showed me first off they're interest in this pair, because they created a significant break, as well as its more probable for the next move to be to the upside then to the downside
*watch for a weak pullback on the daily time frame and a hold of a price to confirm the breakout and buyer control
4H Chart:
*on this time frame look for a weak pullback into the multi-month structure level
*look for strong buyer interest again around 1206 to confirm the buyer interest in this pair
1H Chart:
*use this time frame for a good risk/reward ratio
*watch for strong buyer interest also on this pair around 1206
Search in ideas for "COMMODITY"

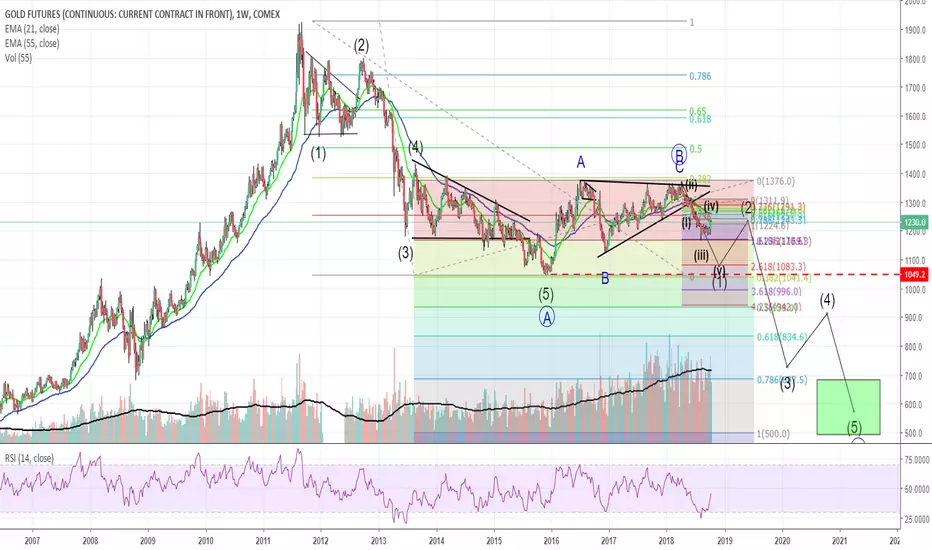
GC1! Gold possible strongly bearish scenario unfoldingThanks for viewing.
The 2003 to 2011 run-up of gold from ~$300 to ~$1850 retraced partially to a swing low in 2015 of around $1050 (wave (A)). After this, there has been some rather unconvincing bullish behaviour. I deleted my wave counts within the wave B triangle (to declutter) but they are 5,3,5 waves or "3s". Within the 5 sub-wave moves (in the 5, 3, 5 moves) I can see truncations (or failures to reach normal wave extensions) and wave failures (breaking the EW retracement rules). Afetr such a deep and sustained price drop, the correction failed to reach the 0.382 retracement level to recover some of the losses. Clearly price has an easier time moving down as compared to dragging itself upwards. Even though the upward price movements were quite steep at times ($1050 to $1377 in about 10 months) these show no clear signs of being impulse waves in the upwards direction.
What I am expecting is that we recently completed a larger degree wave B and have started the wave C correction down (triangles only appear in wave 4, B, and in the final X wave (I am not grouping wedges in with triangles e.g. a leading first wave diagonal).
Because the run-up in 2003 to 2011 was around 600% in what has traditionally been a relatively stable commodity it would seem that we can reasonably expect prices to return to pre-run-up levels (there is a tendency for this to happen following a speculative bubble). If Wave C extends 1:1 of wave A then we might reach $500 an ounce. Early days in wave 3 down still, although, if you look back at the wave 3 drop in wave A you can see that the drop was deep and steep. In all, the total 44% drop took ~4 years.
Scenario 2, that I view as less likely, is that we are about to finish a wave 2 retracement in a new impulse wave move up. Against this view: I can't seem to find a plausible way to subdivide the A wave into 3 waves - it simply has no significant counter-trend move around mid-span. 3 corrective waves ( ABC ) would need to be present for the correction to have completed so that we can start a new bullish impulse wave. For that view: wave 1 seems to be more hesitant while waves 3 and 5 are strongly impulsive, so the 2015 to present move could potentially be the basis of a new upwards price move - although it seems far too early.
I recently head about an expat that requested his salary paid in gold 0.09% and held all his savings in gold. From my reading of the situation, I would be less than comfortable if all my savings were in gold. Protect your funds and good luck everyone.
Sugar (SUGAR/USD) Daily Chart Analysis 10/13Technical Analysis and Outlook
The Sugar finished higher for the second consecutive day with the completion of Sugar Rally $0.1232 in play since flagged by Trade selector Signal on Oct 1, as the commodity consolidates much higher range journey.
The stage for transforming from bullish by completing the move is signaling down prices are likely to occur in near term, with first Mean Support resting at $0.1194 , while very significant the Mean Support lies at $0.1116 . On the upside, there is major Key Resistance $0.1268 .

CRB Commodity Index 2018 Head and Shouder's Reversal CRB Commodity Index on 8/15/18 broke down from a 2018 Head And Shoulder's Pattern,
a reversal of fortune, the implications of which seem to imply that inflationary pressures may have reached a peak
for the year, and with that, a slowdown in world economic growth, foreshadowed by the recent decline in world stock indices,
and US interest rates.
THE_UNWIND
Sugar Beaten Down Commodity Ready for Turn (CANE)Sugar , the commodity has been in a prolonged downtrend for some time now.
The Sugar ETN CANE offers one the opportunity to go LONG Sugar,
at extremely discounted and washed out price.
As a completely contrarian play.....
CANE LOW on 8/2/18 at 6.75, looks to me to be a WASHOUT LOW. USE that as a STOP,
Begin to accumulate. Long Trade. Upside Target; To Be Determined.
THE_UNWIND

GBPCAD - Fitting trade to match commodity fundamentalTechnically this setup looks great; echo-phone pattern has been respected on the resistance side, moreover the bearish H&S has just been broken out of. All that is left to see, is if there will be a retest, and how that neckline will stand up to it.
Regarding fundamentals, this trade plays on recent moves in commodity prices and is a good hedge outside of the EUR, and USD markets.

Copper Commodity FuturesAfter wave (A) completes long the abc move up and then shift to a short position to play the wave (C) down.

13k EOY measured move?watching these levels
would coincide with wyckoff spring and positive news catalysts (tether audit, eth=commodity, mt gox whale being stopped, eth scaling, possible ETF, etc.)

GCC - A new rally could start soon in Commodity group.Follow the price action in the Commodity group.

GOLD, short position on the break of the trend line, 4 hour After a great dollar rally, gold confirmed a trend line yesterday. After slight pullback it is testing the level again. A break can trigger a short position with a good Risk-Reward ratio.
So far the dollar strength seems to continue and unless political tension escalate, like Iran/China trade/North Korea and so on, selling pressure on gold should push the commodity through the trend line.
We are also still in risk-on mood, with risk currencies like AUD and NZD inching higher.
Happy Trading!

WTI - US CRUDE OILWTI US CRUDE OIL , looks pretty strong to the upside and has gained momentum in the last few days due to the geopolitical situation. We can expect some upside for this commodity, There is some resistance coming for it, but another 5 to 7% looks quiet bullish. Any geopolitical uncertainty can surely change its course to the down side.

PATIENTLY WAITING FOR OIL TO GO DOWN!Patiently waiting for oil to go down.
Waiting for a clean entry on this commodity, trust me guys all this patience will be worth!

SHORT ON HEATING OIL GUYS!Well, here we have it guys, I believe that a short on Heating Oil is probable guys.
I truly believe that we can get a short here on this commodity guys.
TP: 1.9200/1.8200

PALLADIUM BUYWe last bought this in October for 920 to say we got out too early is an understatement. Since then we have been waiting to get back in and never had the opportunity, the current pullback looks pretty good:- unfolding in 3 clear waves against a recent new high. Divergence at the blue (3) top adds to the case suggesting that the move higher had lost momentum rather than being over.
The green trend line is a little lower than I would like but was not tested on the two previous pullbacks (neither of which we traded) so it may not be this time. We still like commodities higher but do not overload Commodity risk.

Aug.01.16 w/ bulk commodity w/ FED ECBChinese PBOC changed its FX intervention principle since Aug.1.16.
Given CN's commodity input output int'l trading status. It created inevitable influence to int'l market.
Last week, PBOC unchanged its FX intervention principle to old one. (e.g. a small cycle closes last week)

XAU/USD set for more gainsIt can be observed on the hourly chart for the yellow metal that the bullion broke out of the descending channel pattern to the upside. Due to that reason it can be assumed that more gains are to be scored, as on Thursday morning the commodity price fluctuated just below the 1,280 mark. The 1,280 mark seemed to pose some sort of rather weak but still notable resistance.
This recent breakout, which was initially not expected, occurred due to fundamental reasons. The recent quarrels between the United States and North Korea have created a sort of run to safety. Moreover, it reversed the recent fundamental strengthening of the US Dollar after the JOLTS Jobs Openings release.

Average of GBP/Major Commodity CurrenciesAn equal weighted average of GBP vs three major commodity currencies (AUD, NZD, and CAD) shows potential for the start of a bullish move starting here in the middle of the range formed since Brexit.
My chart shows some consolidation in the immediate area potentially closing this week with a small bullish Doji.
I currently have a GBPAUD short open with SL at BE, I may indirectly hedge that position hedge that position with a GBPCAD long entry if it ends today forming a weekly Doji.

US Oil A short to 38.2 is likely possible at the momentum but a rally may happen as it's commodity link pair USDCAD shows strong bearish movements.


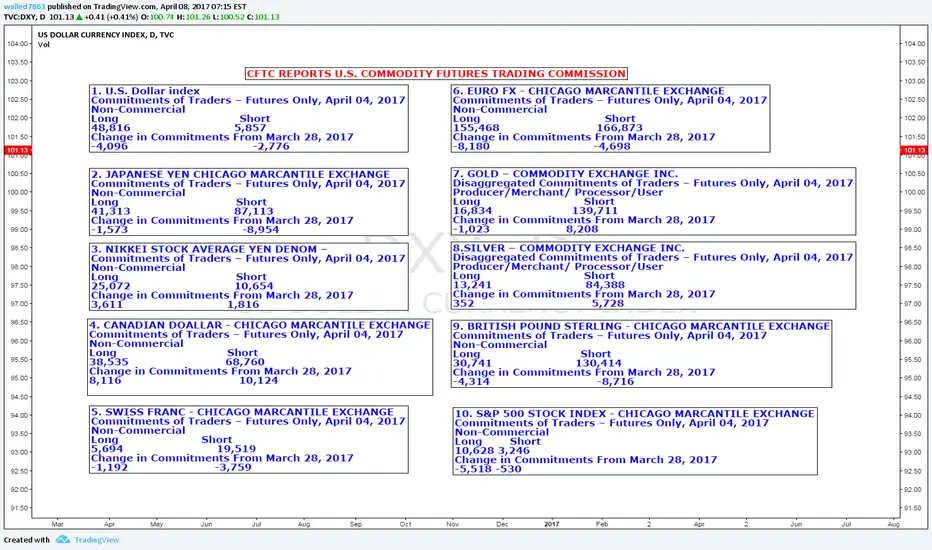
CFTC COMMODITY FUTURES TRADING USD, GOLD, SILVER, EUR FX GOOD LUCK
CFTC COMMODITY FUTURES TRADING COMMISSION

NZD/USD: the NZD is pressed by the lowering of the commodity priCurrent trend
On Thursday the pair was lowering and tested the level of 0.6850, which is has been trying to break for the second week, again. The NZD weakened due to the general lowering of the world commodity prices: the CRB index reached the minimum from the last August level around 177.0 on Thursday, as it has been lowering in general from January. Today the pair was corrected to the middle line of Bollinger Bands around 0.6900, but soon will again began to lower to the key support level of 0.6850 due to the April USA employment market data today. The Nonfarm Payroll index is expected to be 194K, which is significantly higher that the March level of 98K.
Support and resistance
Technically the price stopped at the middle line of Bollinger Bands around 0.6900. The anticipation of the strong US releases and Stochastic readings, which reached the overbought area, can let the price to reverse and lower to the level of 0.6850 and further to 0.6760. If the data are disappointing, the price after the breakout of 0.6900 can grow to the upper border of Bollinger Bands at 0.6960 and Fibonacci corrections 61.8% at the level of 0.6980.
Support levels: 0.6850, 0.6760 and 0.6700.
Resistance levels: 0.6900, 0.6960 and 0.6980.
Trading scenario
Open short positions at the current price with the target at 0.6850, 0.6760 and atop loss around 0.6920. If the price is set above the level of 0.6900, open long positions with the target at 0.6960, 0.6980 and stop loss at 0.6880.

AUDUSD And Other Commodity Currencies Higher Again?Hello Traders,
we hope you have a relaxed weekend.
In this idea, we'll be looking at AUDUSD long. As the market shows us a bullish sequence against the December low 2016. We will expect further bullish momentum in AUDUSD. Especially commodity currencies such as AUD, NZD and CAD.
With Gold and Silver, new bullish cycle, we expect aussie, kiwi and loonie also to follow the path of gold and silver moving higher.
But before we call AUDUSD long confirmed, the pair should first take out the high at around 0.77575, to continue its bullish momentum.
In the case of a break of the 0.77575. We will consider long trades after a pullback to the initial breakout level. We will keep you updated with that. As of for right now, we will be on the sidelines, as the pair also could start a lower degree correction from current levels to the last breakout level at around 0.76324.
When we see a significant breakout out of the 0.77575 our target will be around 0.79484, for the short-term, as we expect AUDUSD to move even higher, but this would be the first target which we will consider.
Hope you enjoyed this short overview. We will be publishing charts now more frequently. As always trade with care and always use a stop-loss
Cheers
