Robusta hit the target after 2 years at $28.00I don't know about you but I prefer Arabica Coffee to Robusta.
It's sweeter, it's fuller and it's not that bitter.
Anyways, I sent out this trade idea in September 2021!
The price broke above the Falling Wedge and there were strong signs of upside.
This trade idea was a slow pace and anyone who held onto this trade, most likely would have made very little money due to the daily interest expense charges.
It really does add up. And unfortunately, we traders can't treat these markets like medium to long term investors who deal with derivatives.
Anyways, the target hit at $28.00 and the price looks to be consolidating here before further upside. Hopefully, a new pattern forms and we can get wired back into the trade.
INTERESTING FACTS ABOUT THE ROBUSTA COFFEE COMMODITY
Second Most Traded Coffee:
Robusta is the second most traded type of coffee, following Arabica, in terms of global market demand and trade activity.
Price Determination:
Robusta coffee prices are influenced by factors such as weather conditions, crop yields, global supply and demand dynamics, currency exchange rates, and geopolitical events.
Use in Blends:
Robusta coffee is often used in coffee blends, alongside Arabica, to provide a stronger and more full-bodied flavor profile.
Coffee Exporter Revenue:
Robusta coffee exports contribute to the revenue of major coffee-producing countries such as Vietnam, Brazil, Indonesia, and Uganda, driving economic activity and foreign exchange earnings.
Search in ideas for "COMMODITY"

New Zealand dollar edges higherThe New Zealand dollar has posted small gains on Thursday, as NZD/USD has pushed above the 0.68 line in the North American session.
New Zealand is hugely dependent on its export industry, and the Covid pandemic has taken its toll on exports, as global demand has fallen. However, with the worst of Covid hopefully behind us, global demand has picked up, which bodes well for New Zealand's economy. The ANZ Commodity Price Index climbed 3.9% in February, its strongest gain since March 2021.
The war in Ukraine has intensified, with fierce fighting reported near Ukraine's major cities as the number of refugees fleeing from Ukraine has hit one million. Western countries has imposed severe sanctions on Moscow as relations between East and West have plummeted. Russian and Ukrainian officials will hold talks later today, which has raised risk sentiment and kept the New Zealand dollar in positive territory. NZD/USD has been on an impressive roll, posting four straight winning weeks and has gained close to 1 per cent this week. So far at least, the panic in the financial markets has not weighed on the New Zealand dollar, which is sensitive to risk.
The Fed is again on center stage, as Chair Jerome Powell testified on the Hill on Wednesday and will appear before lawmakers today as well. There had been some speculation that the war in Ukraine might force the Fed to delay a rate hike, but Powell removed any such doubts in his testimony, stating that the hike would go ahead as planned. Powell's comments suggested that the Fed will stick with the traditional 25-bps move rather than a massive half-point hike. The confirmation of a rate hike by Powell boosted US Treasury yields, and currently the 10-year yield is at 1.85%.
There is resistance at 0.6826 and 0.6908
NZD/USD has support at 0.6647 and 0.6550

Oranges, Citrus, Commodity Inflation CycleI couldn't find any ETFs for oranges, I don't think one exists. In instances like this you have to get creative.
In one of my value scanners, I found a citrus company $LMNR Limoniera. International citrus producer.
I've been long this stock since it the mid-$14s.
If the thesis on commodities, oranges, and global reflation turns out to be even somewhat correct, this stock should do alright. Revisiting or surpassing previous all-time highs is not out of the question.

AUD/CAD Long Opportunity - Battle of the Commodity Currencies Hello Fellow Trader!
Great risk to reward play forming on AUD/CAD with AUD looking to strengthen against the USD as the Iron Ore price strengthens and oil dropping effecting the Canadian Dollar.
Key Points:
- Price crosses September trend line
- Consolidation above trend line
- We have the 21 EMA crossing above the 50 EMA
- Price sitting on 38.2% Fibonacci retracement
- RSI to test above 50 territory
Caution:
- 50 EMA and 200 EMA will act as resistance, so risk management is important if failed.
Key Levels:
Support – 0.95105, 0.95000
Resistance – 50 EMA, 200 EMA, 0.95500, 0.95770, 0.95950
Entry Zone:
Optimal entry provides the greatest reward to risk ratio while supporting entry is a zone for reversal signals.
Optimal Entry – 0.95200
Supporting Entry – 095300
Candle Reversals for entry
- Bullish Hammer
- Bullish Engulfing
- Bullish Piercing
The Risk:
As traders, it is your job to mitigate the risk and only trade structures that provide high probability and great reward to risk ratios.
If you are not comfortable with defined exit levels, experiment with Moving Averages to help set solid exit rules to protect your capital.
IF: Price breaks below 0.95105 – this would suggest the structure is not in our favour and would be wise to reduce exposure or close the trade until a solid signal gives us reasons to re-enter.
Reward / Reward Targets:
Optimal Entry 0.95200 – Target 1 0.95500 = 2.2x Reward to Risk
Optimal Entry 0.95200– Target 2 0.95770 = 4x Reward to Risk
Optimal Entry 0.95200– Target 3 0.95950 = 5.5x Reward to Risk
Supporting Entry 095300 – Target 1 0.95500 = 1x Reward to Risk
Supporting Entry 095300 – Target 2 0.95770 = 2x Reward to Risk
Supporting Entry 095300 – Target 3 0.95950 = 2.7x Reward to Risk

S&P GOLDMAN SACHS COMMODITY INDEX (SPGSCI) WeeklyDates in the future with the greatest probability for a price high or price low

NZDUSD - 2nd Wave Retracement In CompletionDo you have the answer to that equation on the chart?
That's usually how I find as many technical reasons as possible to identify a trade that I will not regret making.
The dollar is near the bottom of its major range at 94.4, commodity currencies have proven to be weak as well.
So shorting NZDUSD is quite a safe choice and given the fact, the price has retraced very significantly.
Always go for the trade you have no reason not to make.

Aud/Usd completing wave Cthe Aussie is completing wave c which should be up in 5 waves targeting 100% fibo expansion.
d'ont forget that gold is giving a bullish signal and the Aussie dollar is named the commodity currency.
stop loss is near its a closing below the trend line drawn on chart.
good luck!!!

RBNZ rate decision & NZDUSD at confluence resistanceWe observe a tug of war between buyers and sellers near .7280 -.7310 area, here lies the confluence resistance, channel bottom line crossing the down trend line.
1- RBNZ rate decision may give the direction cues.
2- Longer term down-trend is still intact with resistance @ .7740 handle, but since Aug 2015 kiwi showing resilience against greenback.
3- we have short term bullish bais above .7220 and looking to enter long once RBNZ rate decision announced.
4- From commodity bloc both aussie and kiwi are performing better against king dollar as compared to CAD which may struggle further as OIL remain range bound.

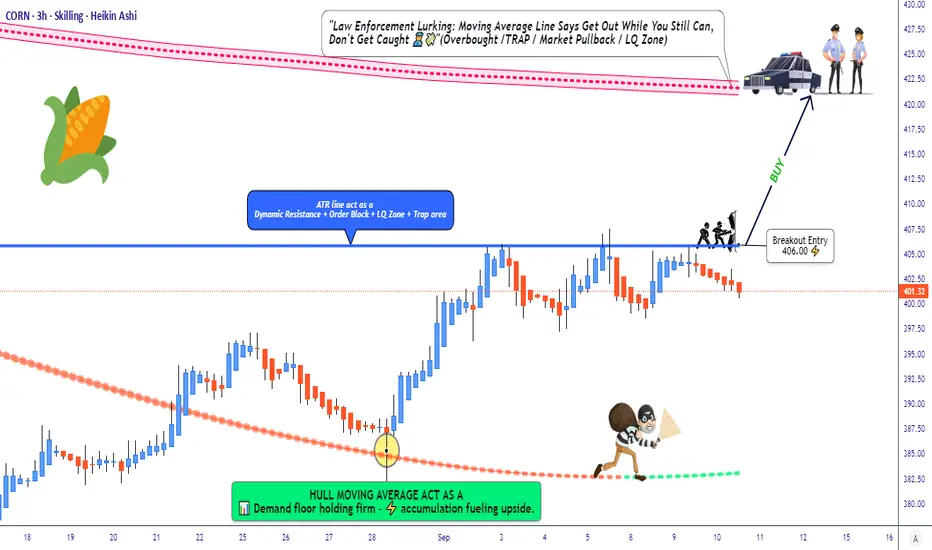
CORN Setup: Is This The Bullish Breakout We've Been Waiting For?🌽 CORN CFD | Money Heist Plan 🎭 (Swing / Day Trade)
🔑 Trading Plan (Thief Style Strategy)
Entry (Breakout Trigger): 📈 406.00 — when candle breaks ATR resistance, bullish plan activates.
Layering Entries (Thief Method):
Buy Limit Layers: 400.0 | 402.0 | 405.0 | 407.0 | 410.0 (flexible — adjust/add more based on breakout confirmation).
Layering helps manage entries & average position smartly.
Stop Loss (Thief’s Safety Lock): @ 395.00 🛑 after breakout trigger.
⚠️ Adjust SL based on your own risk tolerance.
Target (Escape Point): 🎯 421.00
Resistance zone + overbought condition = “police barricade” (take profits before getting trapped).
🌍 Why This Plan? | Thief Technical + Macro/Fundamental Mix
📊 Technical Edge
ATR breakout level at 406.00 ⚡
Momentum build-up near resistance, potential squeeze if volume spikes.
Layered entries provide risk-managed exposure.
🌽 CORN Market Data (10 Sep 2025)
Daily Change: -1.05% 🔴
Monthly Performance: +3.13% 🟢
Yearly Performance: -1.90% 🔴
👥 Investor Sentiment
Retail: 45% Long 😊 | 55% Short 😟 (slightly bearish bias).
Institutions: Net short 91,487 contracts 🏦 (hedging against oversupply).
😨 Fear & Greed Index
Score: 51/100 (Neutral 😐)
Balance between fear (supply risks) vs greed (demand resilience).
📉 Fundamentals & Macro Score
Supply Side
Record US production: 16.7B bushels 🟢
Brazil’s harvest adds oversupply pressure 🔴
Crop diseases (Tar Spot & Southern Rust) hurting yields 🔴
Demand Side
Exports YTD: +46.8% 🌍
Ethanol production: 1.105M barrels/day ⛽ (+30k WoW) 🟢
Tariff risks (China/Mexico) could slow trade 🔴
Macro Score: 6/10 → Moderately Bullish
🎯 Market Outlook Summary
Bull Case (Long) ✅
Strong exports (+28.6% YTD)
Biofuel/ethanol demand supporting floor
Technical rebound chances
Bear Case (Short) ❌
Record harvests (US/Brazil/Ukraine) = oversupply
Institutions scaling up shorts
Global glut risks
📌 Outlook Bias: Bearish-to-Neutral 🐻⚖️
Short-term pressure from supply glut, but demand stabilizes downside.
📌 Key Takeaways for Traders
Breakout Watch: 406.00 🚨
Layered Entry: Manage risk via staggered buys.
Target Zone: 421.00 (book profits before trap).
Macro Mix: Demand solid but supply risks dominate.
Watch List: CAPITALCOM:CORN , CBOT:ZS1! (Soybeans), CBOT:ZW1! (Wheat), CBOT:ZC1! (Corn Futures)
🔗 Pairs to Watch (in USD)
AMEX:SOYB (Soybeans CFD): Moves in lockstep with CORN due to shared ag trends.
AMEX:WEAT (Wheat CFD): Grains often trend together—keep an eye out!
TVC:USOIL : Influences ethanol demand, impacting CORN indirectly.
TVC:DXY (US Dollar Index): A rising USD could pressure commodity prices.
✨ “If you find value in my analysis, a 👍 and 🚀 boost is much appreciated — it helps me share more setups with the community!”
#CORN #Commodities #SwingTrade #DayTrade #ThiefStrategy #MoneyHeistPlan #Futures #LayeringStrategy #BreakoutTrading #Agriculture #Ethanol #TradingCommunity
2 Tale of Commodities: US Crude $USOIL and $COPPERUS Crude Oil is stuck in a long consolidation pattern with the price stuck between 85 $ and 65 $. With Crude Oil unable to break the sideways consolidation pattern Dr Copper is making new highs in a recent month. On the weekly price chart of the world’s most traded commodity i.e. Crude Oil where we see a consolidation for more than 12 months. With new US administration the Crude output is estimated to go up, which will put downward pressure on the Crude Prices $USOIL. TVC:USOIL prices will most probably remain range bound within the 0.612 and 0.5 Fib retracement levels with prices ranging between 80 $ and 65 $.
But we see the prices of Dr. Copper remain in a bullish trend over the last 5 years. At a Macroeconomic level CAPITALCOM:COPPER prices are a leading indicator of the strength of the economy. With Stock market index making new highs across markets CSEMA:S&P , IG:NASDAQ , TVC:DEU40 and macro economy doing well, CAPITALCOM:COPPER prices are expected to remain strong.
So Long CAPITALCOM:COPPER , neutral $USOIL.

Bullish time in CORN ahead \o/You can see here the CBOT:ZC1! price displayed in a line chart. After reaching its high in early 2022, the bears took control, driving the price down significantly until now.
The factors in play are as following:
Seasonality: Corn prices have historically shown strength from December through March, aligning with planting and crop cycles. This seasonal trend could provide a solid backdrop for a potential price recovery. (highlighted in green on the chart)
Interest Rates: We’ve reached a pivotal moment in the Federal Reserve's interest rate cycle. The rate hikes that began in March 2022 coincided with the start of the bearish trend, while recent rate cuts in September 2024 may support a rebound in commodity prices, including corn. This shift in monetary policy could act as a bullish catalyst for corn and other commodities. (highlighted in orange on this chart)
Technical Indicators: For additional confirmation, one could wait for a bullish crossover of the moving averages (a golden cross). Such a cross would reinforce the technical setup and definitively signal the onset of a new bull market in corn.
With these factors in play, corn could be setting up for a strong rally in the months ahead.

COPPER signaling the start of rate cuts? Potential danger ahead.Copper (HG1!) completed two straight red months following May's High at the top of the 3-year Rising Wedge pattern. Last time the commodity formed this pattern was back from May 2006 to September 2008. In fact the recent May 2024 Higher High resembles that of May 2008, whose rejection broke the Rising Wedge downwards.
As you can see, during both patterns, the US10Y (orange trend-line) stopped rising and turned sideways on Lower Highs, while the U.S. Interest Rate had peaked and started falling.
What 2006 - 2008 suggests, is that possible rate cuts may be ahead of us, pragmatically the markets have already priced this to a large percentage in September. But at the same time, it highlights the danger of a market-wide collapse, as the first month after the September 2007 rate cut, the stock markets peaked and the U.S. Housing Crisis begun.
What could be different this time and avert a new financial crisis of such proportions is that the stock markets haven't shown any signs of correcting yet. As a result, potential rate cuts may have a mostly positive bullish continuation effect as post July 2019.
What do you think will happen next? Bullish continuation or new Bear Market?
-------------------------------------------------------------------------------
** Please LIKE 👍, FOLLOW ✅, SHARE 🙌 and COMMENT ✍ if you enjoy this idea! Also share your ideas and charts in the comments section below! This is best way to keep it relevant, support us, keep the content here free and allow the idea to reach as many people as possible. **
-------------------------------------------------------------------------------
💸💸💸💸💸💸
👇 👇 👇 👇 👇 👇

Golden, Green, or ScarletHey There, Welcome Back. Today we analyze the evergreen hedge commodity.
- If you are an Indian, Given that Gold rallied almost 17% in a very short span You must be quite happy. We Indians love gold. Especially, the ladies in our homes.
- The chart of Gold Futures is showing something interesting. The price took quite a rejection from the recent support zone.
- If this rejection holds, we may see a correction/retracement.
- On the other hand, we may just see a consolidation phase (Which is usual after a good rally)
- Only future price action will tell what's what but in the meantime, here are a few rumors/updates to know in the vicinity of Gold (Some are just rumors so take it with a pinch of salt) :
- BRICS Bloc is rumored to introduce a gold-backed currency that will any day be more reliable than the flat currency every other country has.
- US is battling Economy slowdown and recession. The United States has the world's highest national debt with $30.1 trillion owed to creditors as of the first quarter of 2023- Al Jazeera.
- The US Credit ratings were reduced to AA+ from the elite AAA
- If the BRICS Currency comes out, 85% of the global population will stop using US Dollars for intra trades settlement (BRICS Nations)
- Russia is out of the SWIFT System meaning USD Dealings are off the table. That reduces the demand for dollars.
- Saudi Arabia is rumored to join BRICS. Also, for the first time, they are considering accepting other currencies besides the Dollar for Oil trades. This may hugely impact the almighty dollar.
- In the calendar year 2022, central banks around the world purchased a record 1,136 tonnes of gold.
- RBI’s hoard of gold is now almost 800 tonnes
- China’s Central Bank is accumulating gold for straight 9 months
- Gold may soon be the King once again.
Does that mean we will start buying gold at any given price? Absolutely Not. But we will surely keep a check on the global news, the price action, and our overall asset allocations.
Have Requests, Questions, or Suggestions? DM us or comment below.👇
⚠️Disclaimer: We are not registered advisors. The views expressed here are merely personal opinions. Irrespective of the language used, Nothing mentioned here should be considered as advice or recommendation. Please consult with your financial advisors before making any investment decisions. Like everybody else, we too can be wrong at times ✌🏻

HG Copper Futures LONGHG - copper demand is higher this year as the economy expands globally. On the 60 minute chart
price hit a high pivot on May 15th and pulled back in a standard Fib 0.5 fhsion. Price
has touched the upper boundary of that support three times and has now printed a wide range
green HA candle. I believe that this is a reversal pattern and will take a long trade here
targeting the pivot high mentioned. This is a 5% expectant profit amplified by the leverage
of a futures trade.I see this as a safe trade of a commodity that has a bullish bias overall.
I am also looking for some increased volume at this juncture to assure that some buying
momentum is coming into the market.

COPPER Commodity or Junior Miner trade LONGCopper prices rise when the economy is thought to be growing and needing more electrical
infrastructure while they fall when bearish indicators might project a recession. I am
at the aluminum and finished steel subsectors as well. FCX is under consideration but as a
large cap it does not have the volatility of the junior miners. In the meanwhile COPJ, CPER and
COPX look like they are worth considering given the trend up since mid-February. The chosen
strength and trend indicators confirm the trend. This is a long trade and sector rotation play for
those to consider that are tired of tech stocks and earnings plays.

Crude Oil Review and Forecast
API Actual: 9.047M
API Consensus: 1.467M
EIA Crude Import Actual 0.259M
EIA Crude Import Previous: -0.385M
EIA Crude stock Actual: 8.701M
EIA Crude stock consensus: 1.160M
As Saudi Oil production had shrunk to nine million barrels per day in July since its last OPEC meeting with Russia to restrict supply amid signs of weakening global demand in slowing economy, Saudi, the largest oil supplier in the world had expressed its opinion on keeping the production to remain low until the end of this year. As foreseen through such decisions from the major suppliers, the most recent Crude inventory within the states has turned out to be way larger than expected.
Since September of 2023, the Crude oil future TVC:USOIL plunged by $-22.35 (-23.62%) to $72.28 per barrel during the last week trading session. Slower than expected recovery in economic activities(PPI Nov 2023) adding fear of the constant weakening of the oil demand, forecasting a skeptical view towards a short term recovery of the oil demand and its price as well.
The key major resistances are as follow:
Top: $77.8
Mid: $75.5
Low: $72.12
The weekly upside trend is still the last hope for the Bullish traders.
Once both the Four-hours and the daily candles closes below the $64-60 zone, we will then be able to finalize on such ambiguous consensus.
With OPEC+ meeting pushed back to this weekends, every commodity investors focus is on the meeting report, hoping for the decision to give them the better foresight of the future of the market.
The Best Futures Trading Hours in Crude:
CL opens for trading on the floor, called the pit session at 9AM EST
European trading closes at 11:30 AM EST
The best hours for trading are the most liquid, between 9:00AM and 11:30AM
Pit session closes at 2:30PM EST, when floor trading stops for the day
Therefore, the best trading in the afternoon is the last hour between 1:30PM to 2:30PM EST

WTI OIL Excellent buy opportunity.WTI OIL (USOIL) has been trading within a long-term Rectangle since the August 30 High. This is most accurately displayed by the use of the Fibonacci retracement levels where we can see that the majority of the price action has been within the 0.236 - 0.618 Fibonacci range. We call that the "High Volatility Zone". On November 16 the price almost hit the bottom of that Zone and since the 1W MA200 (red trend-line) is just below and has been the long-term Support (hasn't closed a 1D candle below it since January 29 2021!), we consider the commodity to have significant upside potential.
On top of that, the 1D RSI has Double Bottomed on the oversold barrier of 30.00 (where it always gave strong rallies on May 04 2023, March 17 2023, December 09 2022 and September 26 2022) while the 1D MACD formed a Bullish Cross (with all such crosses below the 0.00 mark being a buy signal).
We are bullish at least for the short-term, targeting the 0.5 Fibonacci level at 80.50, expecting also a potential contact with the 1D MA50 (blue trend-line).
-------------------------------------------------------------------------------
** Please LIKE 👍, FOLLOW ✅, SHARE 🙌 and COMMENT ✍ if you enjoy this idea! Also share your ideas and charts in the comments section below! This is best way to keep it relevant, support us, keep the content here free and allow the idea to reach as many people as possible. **
-------------------------------------------------------------------------------
💸💸💸💸💸💸
👇 👇 👇 👇 👇 👇

Gold climbs on global uncertaintyOvernight Gold approached the 3-month high of $1985, since June & July 2023.
This was likely due to the
- Fed chair Jerome Powell's comments which indicated that the rise in yields might lessen the need for additional rate increases. With the increasing probability of the US Federal Reserve keeping rates on hold at the November meeting, the DXY saw brief moves to the downside.
- Continued escalation in geopolitical uncertainty, as troops are reportedly gathering at the Gaza border, suggesting an expected ground invasion, financial markets are seeing a strong move toward the reserve commodity.
Do you think Gold will continue its climb higher to the key resistance of $2066?

Heating Oil CommodityHeating Oil Commodity. Time see as winter is coming how heating oil goes up or down due to demand.
#debadipb #profitsolutions

SUGARUSD Bearish ShortTrading AnalysisSUGAR RAWUSD
Bearish trend forming for Sugar Commodity
We are seeing a Elliot 5 pattern way theory occurring as well on the 2-3 hour charts.
But most importantly sugar is spiraling down towards a major support level. Clearly the uptrend has broken it's trend line with a fake cat bounce/retest making it definite the reversal has occurred.
FIB LEVELS also mention that the support is a crucial zone of interest. As it could reverse or keeping it's bearishness due to it's heavy many spikes of volume.
A parallel channel has formed. I would place a sell limit in it's latest order block as seen in the picture, also to mention that there are many inside bar candles in this order block which can be used efficiently for the right trade, in this scenario shorting.
A nice 650+ pip move if all goes as speculated.
- David van Delden

USOil | New perspective for the week | Follow-up detailThe much-expected bullish pressure following the OPEC+ decision to cut oil production appears to be losing steam as bears are defying OPEC+ again. The majority of market participants are of the opinion that the selling pressure witnessed in the previous week is a result of persistent US rate hikes and recession fears but if we take a look at this bearish move from a technical standpoint, it could be a retracement phase which most of the time is a consequence of profit-taking activities. This video illustrated the technical side of the current market structure and highlighted a key level at the 78.00 level which will be serving as our yardstick for trading activities in the coming week.
Disclaimer:
Margin trading in the foreign exchange market (including commodity trading, CFDs, stocks etc.) has a high risk and is not suitable for all investors. The content of this speculation (including all data) is organized and published by me for the sole purpose of education and assistance in making independent investment decisions. All information herein is for your reference only and I take no responsibility.
You are hereby advised to carefully consider your investment experience, financial situation, investment objective, risk tolerance level, and consult your independent financial adviser as to the suitability of your situation prior to making any investment.
I do not guarantee its accuracy and is not liable for any loss or damage which may result directly or indirectly from such content or the receipt of any instruction or notification therewith.
Past performance is not necessarily indicative of future results.

Gold Outlook 21 March 2023During the trading session yesterday, Gold broke above the round number level of 2000 to reach a high of 2009.55.
However, the move higher was brief as Gold quickly retraced to consolidate along the 1982 price level.
Further upside is anticipated for Gold if the price stays above the support level of 1960 which coincides with the 38.20% Fibonacci retracement level and the bullish trendline.
However, before the price trades higher, Gold price could consolidate/retrace first. In addition, an upward move in Gold could require either further downside on the DXY or increasing market uncertainty, driving investors toward the safe haven commodity.
If the price breaks above the recent high, the next key resistance level is at 2070.

Natural Gas - Bigger correction in this area?Hello traders,
Today we will do an analysis for NATGAS. This commodity is in a big downtrend on the daily and weekly timeframe that started in August 2022. For now the higher probability move is a bigger correction in this area. On the 4h timeframe we expect the price to move to the upside and break the previous local high that it made on the 3rd of March. Once it reaches the area of the magenta rectangle marked on the chart we must see if we will have a continuation to the downside or it will continue making a bigger correction (upside).
Another possible scenario is a move to the downside that coincides with the 70,5% Fibonacci retracement and then a move to the upside to break the local high.
Please don't jump in, wait for your setups, no matter what, and don't risk more than 1% of your capital.
