Dynamic support of the channel's bottomUntil the dynamic support of the bottom of the channel is completely broken and confirmed, the price growth can continue ($20 resistance). But if the bottom of the channel is broken, a correction can be made to the support areas of $12.91 and $14.11.
Search in ideas for "Dynamic"

Dynamic Trading: Static TurnsThis methodology provides dynamic levels for turns (swings). The Highs suggest time frames, and the cyclic time tool fits well. There should be a directional move soon, and will leverage aggressively.


Dynamic resistance is brokenIt has a strong foundation. Prices can rise up to $ 115.
Dynamic resistance has just been broken.

BTC/USD - Static/Dynamic SR LevelsDynamic & Static support/resistance. This is what BTC is reacting to now. No predictions here... just analysis.


Dynamic Support broken on Bitcoin Price Chart | ShortHello Traders, Support & Resistance is most important in technical analysis. On the price chart of Bitcoin dynamic trade line break. Weakness on crypto leader chart.
Strategy:
Sell below 35250 (closing basis)
SL:37850
Target:33400/31100
Consult your financial advisor before taking any action.
Educational purpose only.

Bitcoin Dynamic Tred line break | Upside possibleDynamic Tred line break on Bitcoin chart. Upside possible from here.
Buy Above- 55450
SL-54500
Target 1-56300
Target 2-57100
Educational purpose only.
Consult your financial advisor before taking any action.

Dynamic CGLD/USD Potential 73% Profits Channel Swing!Tonight I am looking at Celo (CGLD/USD) and a dynamic opportunity to make a HUGE 73% profit in the wake of BTC entering its 5th Elliott Wave. I anticipate CGLD to run with the bulls and make tremendous gains, beginning within the confines of this ascending channel. All eyes on Bitcoin. Get in below $4.00 for a big 45% gain, and be prepared to let it ride up in the sell zone and possibly beyond into ultra sell territory! Then...you're on your own ;)
Not financial advice; trade at your own risk. Use a stop loss to mitigate that risk.
If you have patience and you like big wins and big money, follow me. I track all 37 USD-paired cryptos on Coinbase and seek out the potentially most lucrative swings. Safe trading to all!
Jalapablo

Dynamic resistance BTCUSD.Hello traders,
As I told you in H1 timeframe bitcoin has broken its triangle from bottom. It has came down and touched the channel line then channel has rejected the price.
Price has gone up and it has 2 important area to face with them. First one is supply zone and another one is dynamic resistance.
RSI is also going to hit the last high. So price may reverse and if it doesn't it will go up.
**This is not an investment advice. Your capital might be at risk.**
Good Luck...

Dynamic Support - DOW JONES INDUSTRIAL AVERAGE INDEXA simple view of dynamic support (10 years) and divergence.

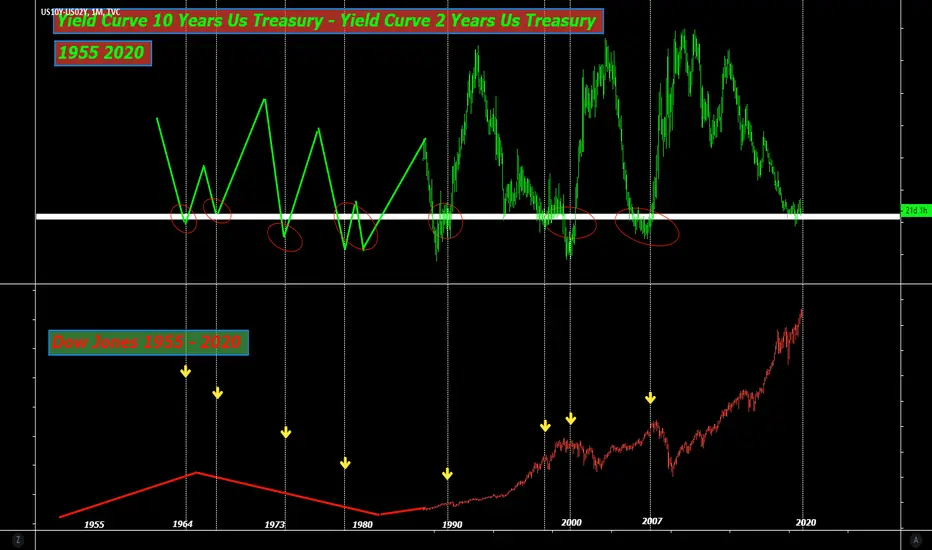
Leading Indicator for change trend Dynamic Yield Curve Dynamic Yield curve of interest rates Us treasury 10 Years - Yield curve of Us Treasury 2 Years , that's it a leading indicator for recession , anticipates change trend of Index Stocks Market
dynamic crosscaught a triple intersection cross on last post. it dropped with a gap down, then shot up.
this post is even more dynamic, it reached a demand zone of strong sellers. also it had hit a 61 level simultaneously with the 61 level of another fork while in a sell zone. more reasons to buy eurusd in the supply zone its in, plus its in a focal point anyway-draw a trend line on the daily across the highest two highs coming down in that downtrend. yep price is sitting right on top of that there.

Dynamic (DYNBTC) Breakouts on Bittrex (50%+ Gains)Take a look at the chart above, huge volume and breakout for DYNBTC on Bittrex, but this isn't the only altcoin that is moving up strong, we have many more and some such as HOTBTC, MDABTC, ERCBTC, SEQBTC, etc.
Why all this bullish action? Please share in the comment section.
As for DYNBTC, this is only the beginning, if you take a look at the chart above, you can see that its price bounced just two days ago from an all time low. This type of bounce are good signals of an upcoming change of trend or an up wave.
Here is weekly chart:
- Still plenty of room available for growth for this coin.
Keep an eye out, DYNBTC will be generating additional profits in the weeks and months ahead.
Thanks a lot for reading once more...
Namaste.

Dynamic Trading on BitcoinWelcome to dynamic trading !
Chart which defines direction - long or short and targets with new price points .
I will be adding new targets everyday to the same chart .
All previous trades are marked on the same chart .
Yes we are timing the market !
Right now a small scalp of 60 $ for today on charts in long direction . Close all positions on reaching targets as market may sharply reverse direction after that.

Dynamic TradingWelcome to dynamic trading
New targets -8050 after I got 2 new pivot points on my chart ! It has broken trend line and is headed towards that target

Dynamic Support Level $BBD.BBombardier appears to have found a base in its current channel and is potentially setting up to retest recent highs. Reasons listed below:
Reasons:
- Price has held above the $3.00 level which has acted as a major level for many years
- Price is now sitting on the 100MA, which has acted as a significant dynamic support level in the past
- MACD has gone positive
- RSI turning over above moving average
- Bullish Divergence on the MACD
Waiting for a breakout above the other shown moving averages, then going long.

DYN / BTC CryptoLeaks Signals, BuyDynamic / Bitcoin
According to 3 indicator signals, which are:
1- Simple Moving Average. "price up the indicator"
2- CCI, "Indicator crossed +100 line
3- Uptrend volume oscillator."
4- MACD "blue line crossed red line, and up trend formation"
Buy Signal
Daily frame
Target: 0.00063

DYNAMIC STRADDLE: USDJPY & GBPJPY - TP FROM BOJ & FOMC EVENT VOLThe best Idea to play BOJ and FOMC from a risk-averse perspective is to own both in a Long Straddle
Strategy
Dynamic Straddle: Long USDJPY & Short GBPJPY - TP from volatility & Event likely hoods
TP levels = cannot be greedy else you may miss one trades exit point so <25 pips when it goes in your direction for each - total TP = 50pips as 2*25pips
Reasoning
- Traditional Straddle involves would be long and short the SAME cross..
- However i suggest we long USDJPY as UJ has proportionately MORE upside possibility:
1. FOMC is likely to be neutral-Hawkish, this will help UJ trade flat/ higher = Supports long -
- *FOMC PARADOX* important to note that in this sensitive risk-off market if the FED is too hawkish/ hikes it can cause a UJ sell off, as higher rates means greater economic/ market uncertainty as liquidity and financing becomes tighter (despite rate hiking usually making USD trade higher through increased $ deposit demand for higher rates)
2. BOJ is likely to be dovish, this will help UJ to trade higher (especially in this risk averse market - easing helps calm mrkts) = supports long
3. USDJPY ISNT directly impacted by BREXIT fears as GBPJPY as USD and JPY can be considered safety assets, this helps USDJPY trade higher = supports long
So we have 3/3 for long USDJPY.
- Now to hedge this trade AND benefit from possible downside,
we SHORT GBPJPY as GJ has proportionately MORE downside possibility.
1. FOMC neutral-hawkish, drives risk-off momentum (higher rates reduces market liquidity and undermines economic growth thus increasing uncertainty) which drives demand for Yen/JPY, increased demand for JPY supports short GBPJPY
2. BOJ being dovish/ easing potentially helps JPY sell off - however, GBPJPY will be the least sensitive of JPY seller of the JPY crosses, as GBPJPY is the perfect play for Brexit and risk-off, hence in the long run JPY selling wont last long in GBPJPY as once JPY is cheap, buyers will enter to continue hedging/ speculating on brexit with the favourite pair, poor potential/ long run JPY sell side = supports gbpjpy short
3. GBPJPY is directly impacted by Brexit uncertainty in two ways. 1) as investors wish to sell GBP as the uncertainty is only negative for GBP (especially when polls are at 55%). 2) as Investors wish to buy JPY for their "safe haven" asset play. UJ only has the JPY buying to push it lower, which is limited/ offset further as USD buying can also be considered a "safe haven asset) = Supports short GBPJPY
We have 3/3 for short GBPJPY
Evaluation.
- We have 3 points supporting both LONG UJ and SHORT GJ - AND by playing this trade we are able to gain from ALL eventualities, we dont have to guess the BOJ or FOMC outcomes since we have a LONG and a SHORT we have covered ALL eventualities.
- Also from a vol perspective, GBPJPY risk reversals continue to become negative by a significant amount 1wks lost 0.6 to -2.1 (from -1.5), so investors continue to demand GBPJPY downside puts for speculation/ hedging - supporting the short.
- USDJPY ATM volatility, sold off significantly with 1wks losing 3.55 to 12.45 - lower vol in UJ supports buying.
*Any questions on why i think FOMC will be neutral-Hawkish or why BOJ will be dovish-easing please ask in the comments*

Dynamic support testJust checking if this level holds based on daily dynamic support from back in April 2015

BITCOIN, Wyckoff Dynamics to Setup HUGE ALTERATION!Hello Community,
the year 2022 has finished and the start of 2023 has been initiated. The year 2022 was a year of extremely volatile market conditions showing the results of a longer series of economic events like fallouts in supply chains and partial sectors on the verge of a completely new way of overthinking their place in the economy causing the financial markets to reiterate the positions of assets and showing massive disruptions within the financial markets and so also in the cryptocurrency market, huge chain-reaction events triggered massive volatility within the markets and caused the central banks to intervene against inflationary pressures spreading with the roots in several factors which fuel the heavy inflation like energy shortage, monetary expansion, and supply chain disruptions. And in all of this market turmoil remain Bitcoin and the Cryptocurrency market while the price action was highly volatile with many peaks and valleys continuously through the year 2022 the technological adoption and preparedness of Bitcoin and Cryptocurrency to be adopted on a mass scale have not declined to pre-levels seen before 2022. Now with these given factors established in 2022 the question of how the dynamics will develop through the next times moving forward into 2023. With this lineup, it is preeminent to consider the technical analysis components as I have done it in my Wyckoff analysis put together the puzzle pieces of fundamentals and market behavior in the visual element of technical price action.
In my chart, you can watch the underlying Wyckoff dynamics within the Bitcoin price action and I am going to discuss them in the following, where Bitcoin is standing now out of the Wyckoff perspective and what movements are likely to be expected when applying the Wyckoff projections during the current market phase.
Completed Phases
Phase A:
Within the first phase of the Wyckoff accumulation dynamics to be watched with Bitcoin massive selling pressure hit the market and Bitcoin moved into important support zones to first establish the PS- Preliminary Support point where Bitcoin moved into previous supports and an initial inner price action bounce has showed up indicating that the area between $19,500 and $20,500 can be a good point of support for a potential reversal. Once Bitcoin completed the PS Bitcoin moved into the final SC- Selling Climax point where the most selling pressure in the whole structure unloaded in the price action and Bitcoin reached the initial low of $17,700 from where the first bounce emerged. Now the AR- Automatic Rally was driven by investor's and trader's silver lining to see a fast and strong recovery in the whole cryptocurrency market and a relief rally because of faster Web3, Metaverse, and NFT adoption and developments, this rally has been partially fulfilled with some solid volume coming in to establish new highs that preceded the PS lows.
Phase B:
The second phase B has been the phase in which the market literally prepared on the FTX collapse that caused Bitcoin and Cryptocurrencies to dump sharply. The significant factor here is the 40- Moving Average of Bitcoin because the price action the whole time stayed below the 40-MA marked in blue in my chart this was the first important indication for Bitcoin to dump more sharply as Bitcoin did not managed to form new highs and indeed this was also a difficult time as the market also struggled because of the Luna, Celsius, and Voyager Digital crashes aftereffects. And then the final trigger for the massive dump and sharp decline to the downside has been the final FTX collapse with the information of misuse of customer funds in the FTX exchange the market reacted immediately on this news and Bitcoin as well as the whole Cryptocurrency price plummeted heavily to initiate the phase C in the Wyckoff accumulation dynamic.
Phase C:
This is the most determining phase in the whole Wyckoff accumulation dynamic to watch in my Bitcoin price chart because after the heavy FTX collapse the market managed to hold crucial support below the previous support level at the $15,500 zone and do not break below this level which was an important sign of strength within the market and Bitcoin showing that there is still potential for a reversal after the market crashes. while data showed that Bitcoin holders accumulate further Bitcoin and smart money market operator's open interest also increases in Bitcoin this caused the main stabilization in this area and Bitcoin initially rallied to test the previous support which is now still resistance at the $18,000 level. what is important in this phase C is also that right after the market crashed major volume moved into the market and caused the initial price rally, higher volume at such lower prices is always an central indicator of price stabilization.
Upcoming Phases
Phase D1:
Now as Bitcoin initiated the final test of the spring which is the most determining part of the whole Wyckoff accumulation dynamic this is a phase where Bitcoin is finally in the end-stage of the decision phase and when Bitcoin managed to bounce in this test area again and show a solid support dynamic from where Bitcoin breaks out above the $18,200 level this will be the sign that Bitcoin has the abilities to continue further and finish the whole Wyckoff accumulation dynamic as it is appropriate. Also a really paramount factor, in this case, will be the fact that when Bitcoin bounces above the $18,200 level this will be a setup from where Bitcoin also bounced above the 40-MA marking a final reversal of the 40-MA as the resistance and confirming it as support. With this setup, Bitcoin will provide the final cornerstone of a further completion of the whole Wyckoff accumulation dynamic.
Phase D2 and Phase E:
As phase D is the phase in which Bitcoin shows the final completion of the whole accumulation the second stage of phase D is where the initiation process into a new volatility area is going to emerge. Once Bitcoin has finalized the test and the breakout above the $18,200 zone together with the 40-MA this will be the point where Bitcoin is likely to bounce above the $21,400 resistance and above this area forming an LPS- Last Point of Supply in which Bitcoin will have good chances to stay above the previous resistance and confirm it as support, also a goos factor, in this case, will be when Bitcoin increases the volume moving forward to offer a final bounce into the upper areas and showing an SOS- Sign of Strength in which the volatility, price action, and volume should bounce massively to complete the whole Wyckoff accumulation with the final breakout into the phase E and continuation of the established positive trend dynamics.
Now as I described the underlying factors of the Bitcoin Wyckoff accumulation dynamics going on here we can already see that Bitcoin is moving into a really interesting and amazing decision phase in which Bitcoin will decide if the ability to convert into a massive expansion potential despite seemingly negative macroeconomic developments will unfold again as it happened several times in the past. What has to be mentioned is that this is not the first time Bitcoin is in such a market phase and it always turned out to be a silver lining as Bitcoin and the Cryptocurrency market always managed to come back stronger as established before and return to new heights. Especially as inflation is on a way to lower levels than established during 2022 and the FED looking to slow down more aggressive rate hikes this has good potential to be an additional positive factor contributing to the fact that Bitcoin completes the Wyckoff accumulation dynamic as it is projected. I am going to monitor the dynamic and see how the developments move in the further trading sessions.
In this manner, thank you everybody for watching. Hopefully, everybody of you had a good start to the New Year of 2023 and in this manner let us move into the New Year together and celebrate a New Year also for Bitcoin and Cryptocurrency.
The information provided is only educational and should not be used to take action in the markets.

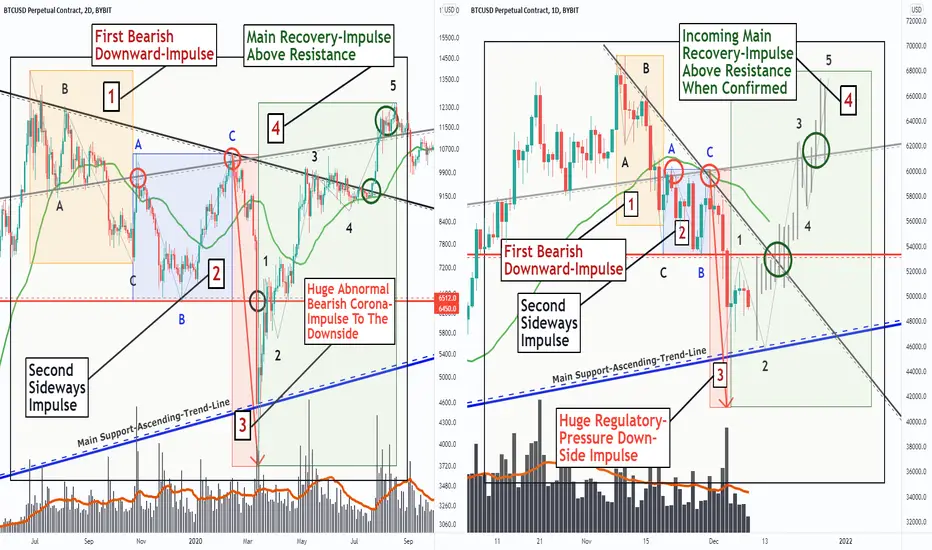
How BITCOIN Now Repeats The 2020 Corona-Crash-Dynamics!Hi Cryptocurrency Community,
in the recent Bitcoin-Crash we have seen Bitcoin almost crashing down over 30% and losing nearly 20K in price-value, this was a heavy dump which we have seen on the daily chart with Bitcoin and it nearly send shock-waves out through the crypto community, this dump was not only technical also fundamental developments were pivotal for the traction in this dump as we have seen the regulatory pressure increasing and several countries launch more restrictions against Bitcoin. Although this dump was heavy on the daily chart Bitcoin had similar such dumps in the past already, one historical highly devastating dump was the 2020 Corona-Crash-Sell-Out in which the Corona-Pandemic shocks through all financial asset-classes caused a chain-effect and was the origin of the heavy bearish downside price-pressure we have seen catapulting Bitcoin from 10.000 USD to almost 4.000 USD. Prior to this crash, we have seen some very similar developments as we can see now with Bitcoin actually setting up the whole heavy dump before with the wave-count-structure, it is likely that insiders always had their hands in this development and therefore I am looking at the current dynamic and as I discovered Bitcoin is forming some very similar movements that can indicate the further developments.
Bitcoin Corona-Crash-Dynamic-Repetition:
Looking at my chart we can watch there on the left side the actual chain-effect Bitcoin set-up before the heavy corona-crash-dynamics showed up and pulled Bitcoin to the downside. This was all set up by a first downside-impulse marked in my chart in orange with the number (1), after that Bitcoin moved into a sideways-consolidation marked in blue with the number (2), and once this sideways-consolidation ended Bitcoin showed up with the heavy-dumping-phase on the corona-crash-pressure marked with the number (3) in red. Once the corona-crash-dumpings finished Bitcoin managed to recover above previously established resistance-trend-lines marked with the number (4) in green. Looking at the right side of the chart now we can watch these very similar developments already established with the phases (1) to (3) already completed and as Bitcoin now initially bounced in the main support-ascending-trend-line marked in blue this has a high likelihood to be the origin of the phase (4) the same way as we have seen it back in May 2020 with the corona-crash-dynamics. In this case, when Bitcoin bounces above the descending-trend-line in grey we can expect phase (4) to fully develop, after that it has to be shown how Bitcoin moves on and if Bitcoin manages to recover and move on similarly as we have seen it after the corona-crash-dynamics.
Upcoming Determinations:
Taking all these factors into the consideration nowhere it will be necessary to keep patient and to keep calm to await on how Bitcoin potentially continues with the recovery that should be expected in phase (4) of this whole dynamic. This is always a central philosophy which we also managed to execute in the Elite VIP Crypto Channels as we executed great trades on the short-side with BTC, ETH as well as in the Altcoin Section, therefore from a trading perspective when such volatilities come up in the market we need to be not panicky, in such situations we should see the opportunities within the market and do not hesitate to overspeculate the market. For now, Bitcoin has some high possibilities given to actually complete this whole fractal similarly as it was seen in 2020 however therefore it is important that Bitcoin actually continues with the right confirmations that are necessary as already suggested otherwise when this does not happen such a formation can also invalidate. From a fundamental perspective it is essential that governments not overregulate the cryptocurrency space and on the other side better embrace this newly innovational technology and actually lie the right grounds for a further technological development of Bitcoin and cryptocurrency, it will be an important journey ahead.
In this manner, thank you for watching the analysis, it will be great when you support it with a like, follow and comment for more upcoming market analysis, all the best!
"The high destiny of the market is to explicate, rather than to speculate."
Information provided is only educational and should not be used to take action in the markets.