If u knew about Neo you know what is going on but if you dont?!Neo try crosses up its dynamic resistance trend line and keep pushin, if we wanna setup eliot waves probably we are in 3th wave ABC correction, and the target may will be the fibo 0.618 retarcement. Also we are right on support zone at 4h time which is already confirmed at this level.
Trade Safe ,Stay focus !!!
Search in ideas for "Dynamic"

BTC/USDT - LongBINANCE:BTCUSDT
I can see a real good movement on BTC, even though there might be some pullbacks along the movement...
(Using Fibonacci retracement) We can see a strong support (@ $29,700 - $30,000), since the very beginning of this year... and a near support/resistance (@ $40,500).... retracing the movement with fibonacci level, we can see the market projecting towards the 50% level ($44,120)... and with a big momentum move, it can make a way through the 50% level and project higher and then have a breathing space at the near support/resistance.. before completing its full movement
Also, for dynamic resistance and support, we can see both the EMA 12-period and 10-period acting as support now.. this proof the bullish direction of the market
Don't forget, there will be some pullbacks during the bullish movement
Trade carefully, and make sure you give the market enough time to play out any ways it want to
Like and share your thoughts as comment, if you agree with me or otherwise... lets trade and win together
Don't forget to follow me to have quick update of my further analysis, i will follow back as well.

Close to a breakWe can see a nice candle in the top of the dynamic channel (I show it with No.2) It`s very close to break the channel and if it happen, the next target would be 10000 USDT. With this trade vol, I think it will happen.

LTCUSD | Support Resistance Level For LitecoinLTCUSD Support and Resistance Level
LTCUSD Dynamic Support and Resistance Level

DASHUSD Pin Bar Exponential Moving Average | TargetPrice 335.800DASHUSD | Exponential Moving Average | Dynamic Support and Resistance

Clover Health Will Show A Technical Growth In Channel To $9.92After a false breakout due to a correction in the broader market, $CLOV has re-entered the falling channel it has broken out of and closed within it.
From this area, I expect growth towards the resistance zone around $9.92 to $10.00.
However, do note that this zone of resistance that we are heading for is a very strong area of resistance.
In this area, we see an intersection of:
1. Dynamic resistance created by the upper parallel line of the falling channel
2. Fibonacci resistance and Horizontal resistance
3. Former $10 SPAC price floor which acts as a very strong psychological resistance
Regardless, I expect a move towards it first. Would have to see how the market reacts to this level first before deciding on our next course of action.
This is not an investment or trading advice so please do your own due diligence!
Support this idea with likes and share your thoughts below.

Clover Health Continues To Track The Broader Market Very CloselySince the market started selling-off late February due to disturbance in the bond market, the movements of $CLOV has since been mirroring the direction of the overall market relatively tightly. With the closing of the market earlier today after a considerably sideway and mixed trading day, S&P 500 rose by 0.60%, NASDAQ fell by 0.04%, while Dow Jones Industrial Average rose by 1.46%. Similarly, $CLOV also had a relatively mixed trading day, showing green for the first half of the trading session, and later closing slightly red on the second half. These movements can be attributed to the general market condition as well, where during the first half of the trading session, the release of bullish CPI data edged the market higher, while a relatively average and within expectations $38 billion 10-year notes auction brought the action back down to trade relatively sideway.
I expect $CLOV to continue tracking the overall direction of the market closely, at least for tomorrow, where we await for the result of a $24 billion sale of 30-year bond that can potentially move the market significantly in either direction, should anything unexpected occur.
Regardless, it is good to note that on a technical perspective, $CLOV is approaching some key trading area that we need to take note of.
We are currently resting just below the dynamic resistance formed by the bottom of the previous bearish channel that were trading in before this bond-induced market correction. While we may have already rejected this area once (likely due to the broader market movement as mentioned above), if we are able to break back into the bearish channel, our next target would be the next Fibonacci resistance and the top of the aforementioned bearish channel at around $9.92. However, if we fail to break back into it, we could be looking at a re-test of $7.78 or even $6.67. As such, tomorrow's trading session will likely be a very important one as it will give us an indication of where we are headed short-term.
Invest safe.
This is not investment advice so please do your own due diligence!
Support this idea with likes and share your thoughts below.

ZECUSD ZCASH Entry On Retest at 96.56Break out candle on horizontal support resistance and dynamic support resistance at price area 96.56. Entry on retest at 96.56 price area.

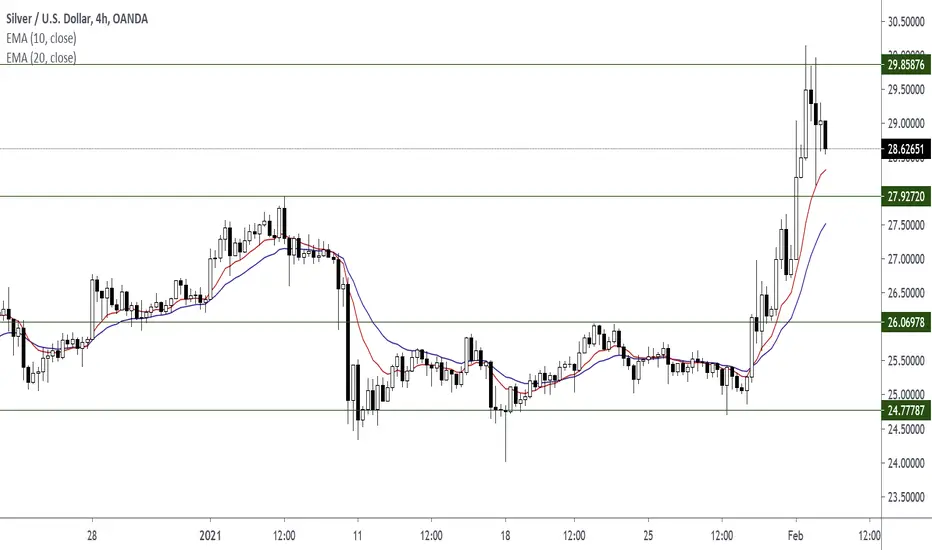
Wait for a price action signal at price level 27.92720 (XAGUSD)Silver XAGUSD. Wait for a pull back to dynamic support resistance and horizontal support and resistance.
EUR/USD - We got the break of structure!Good morning traders!
Check back to last week where we predicted a break of structure on the pair. Well, we've seen that.
Look at price now respecting and finding support at our already marked key level in the market. With bears looking pretty strong will we see a break of this level and further movement to the downside this week?
Look closely, and you can see our ascending trendline has been used as dynamic resistance. Price broke the line to the downside, came back to retest the line before falling. This is a great bearish confirmation to enter a long term short position.
Happy Trading!

PAXG/USDT 4h is still bearish so still not profitable to investPAX gold is bearish as the overall trend obviously shows it and it crossed dynamic support plotted in the chart so its going to be either neutral for next days or bearish, no signs of bullish for now so still not profitable as we expect

"BAC"k and Forth in Bank of AmericaAgainst a backdrop of the broader stock indices that don't seem to want to spend ANY time, at ANY level (w/ the possible exception of the Russell 2000), today we forayed BACk into Bank of America using a dynamic support level that printed at 25.5. When breakouts or fades get tricky, we like to fall BACk (okay, stop me) to names that are staying inside a well defined channel.
We have additional confluence, or strength of signal (SOS), at the 233 EMA (T-Line) on the 1H timeframe.
Expressed trade as Oct 25/28 Bull Call for $1.15db A $1.15 debit sounds familiar - maybe check out our SPY Put idea while you're here. See Related Idea.
Risk is the usual 50%-ish of premium paid.

🐞 BTCUSD, Fifth attempt to break the DR🐞The fifth attempt to break the dynamic resistance is underway. I think it might be the last time to test it. Bitcoin will leave the descending triangle in the next 3 days.
4 days ago the forth attempt has failed.
🐞if you found my ideas helpful, don't forget to like or leaving a comment 🐞🍻 🥂 CHEERS!🍻 🥂🐞

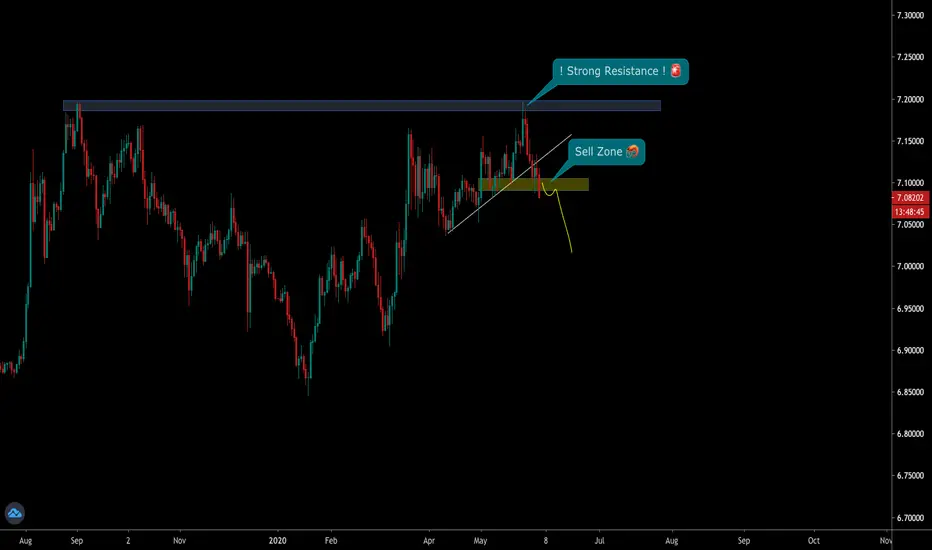
USDCNH Broke the support 🦐Hello traders, After a nice bullrun, the price hit on huge resistance (see our previous idea) . The price retested even the dynamic resistance and broke the recent support. We will wait another retest and according to
According to Plancton strategy, we can set a nice order
–––––
Here is the Plancton0618 technical analysis, please comment below if you have any question.
The ENTRY in the market will be taken only if the condition of Plancton0618 strategy will trigger.
LIVIDITIUM [BTC] {PREMIUM}Optimised dynamic fib channels for BTC on the 1D chart.
Major "BUY!" signal triggered.
SCRIPT URL:

Crude Analysis: BTC to 8.6k USD to complete the bull-flag?BTC might come down to as low as the 61.8% level @ ~8.6k USD to complete the bull-flag -- continuing with the current downward parallel channel movement in the short (~2-3 weeks), before breaking up to continue with the bull market pump?
This level is a good confluence with my previous macro-view of the current BTC market cycle/phase using LIVIDITIUM dynamic fib-levels, see:
Where comparing with previous market cycle, price is expected to revisit the thick grey level (which may continue to shift higher/lower as the price action develops).
But right now, it is at ~8.6k USD.
See also my less speculative TA of BTCUSD here:

Trading TOKENS #1Current tokens prices may be attractive:
1. lower trading fees on the next generation platform (Bitstamp founder) or high ROI
2. one year bullish setup with higher high and higher low
3. last wave 61.8% fib retracement, RSI close to oversold territory, 50MA is above 100MA
For a higher liquidity you may use tokens.net and trade with DTR (Dynamic trading tokens).
tradingtokens.net

EUR/USD Short Setup Bearish momentum to continue even further, 20 EMA on H4 acting as a dynamic resistance for this pair. We can see it bounce off both the trend line and EMA with a pinbar rejection candlestick.

Buy $DYN #Dynamice @bittrexTarget 1
31000
Target 2
33000
Target 3
3600+
Grab it fast , RSI in oversold areaa perfect time to buy

TSLA UptrendDaily chart for TSLA shows an uptrend with a dynamic support (red line).
Long-term Moving Averages (20,50) and short-term MA (12,26) shows a bull trend too.

GAS token Long OpportunityTime to fuel up those Lambo with GAS!!
GAS is like the little brother of NEO that everyone neglected, but 2018 will be different. As big brother, NEO, gets more exposure and its price goes up, so will GAS. With NEO having strong connections with Chinese authorities and its participation in evolving technologies, 2018 will be a great year for both NEO and GAS.
Technicals:
Ichimoku cloud breakout
Entry:
0.002302 - 0.002509 (Based on above the cloud and dynamic pivot)
Stop Loss:
0.001984
Targets:
1. 0.003842
2. 0.004742
3. 0.007742
4. 0.0142
5. 0.021842

Bitcoin: BTCUSD Update and stops for longsLatest Update 21.30 GMT
We can by on a break of the dynamic holding back price off
the highs - stop below the line...hope for a good clean break
with enough powwer to break above the highs...if you go long
just be careful at the highs....great if we see green candles
beat it there...if it stutters and halts close down for small win
and go again if and when the line is beaten
Hope you were not put off by the messing all over the line
after it was broken...look at the pin bar of desire/greed off
the line? You could SEE this was beinning to look good here
after 20 minutes of thrashing around ABOVE the line...a really
good thorough test and it survived, no problem. You KNOW
that price is irrelevant now, but it's still there in the back of
your mind making you hesitiate. Forget everything you
thought you knew about price. This is Bitcoin. It does not
apply. Everywhere else in the investment universe price
matters. Just not here. Only patterns matter here. Follow
your chart or follow your heart. You must decide.
It stays good whilst within the parallels. so stops just
under lower line rising dynamically as the parallels rise above it.

Short position with 90% probability of at least 3:1 ratioFX:EURJPY
EURJPY is my favorite pair. It pair draws beauty structures that only the trained eye can see.
Price is broken a dynamic rank strongly.
I propose two posibles stages. I am inclined by short position but keep your mind flexible. Just read the momentum of the market.
Jesse Livermore Old style trading, no indicators required.
