₿ BTC ChartArt - 27/FEB/2019Hello frend, this is just a small chartart meme art chart with some gann & FIB resistance lines with such indicators.
You can find the indicators in left top of this chart.
Stay patient and breakout ready, always take care for BTC taking either direction! ;3
#doggonacci
Search in ideas for "INDICATORS"

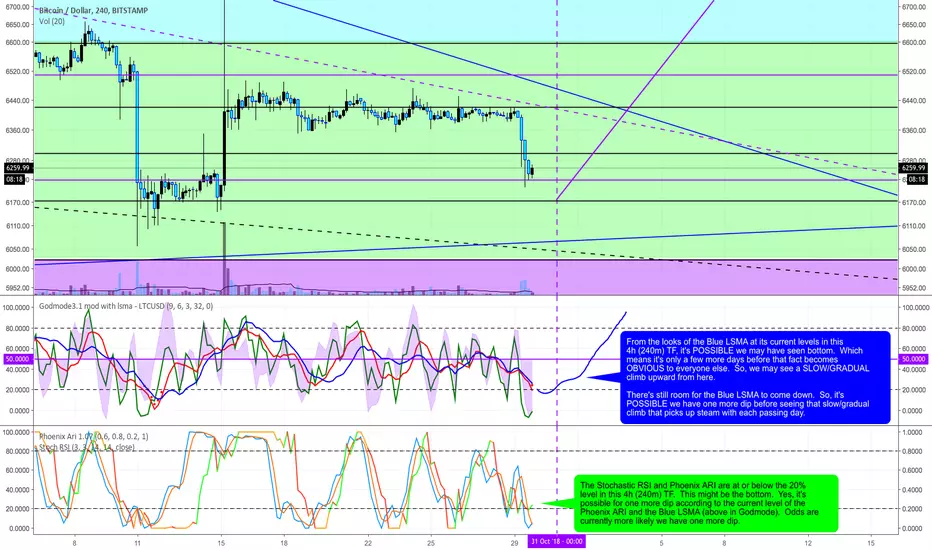
I Don't "Guess." I Simply Post What I See in My Indicators.240m (4h) Chart posted again for easier reading and viewing the way it was intended:
It's my opinion upside reversal is close at hand. Not just from what I'm seeing with the indicators in BTCUSD in time frames ranging from the Daily to the 14-Day TF's. Simply have a look at indicators in all of the publications I've posted on other crypto currency pairs. It's hard for me to believe the other MAJOR alt coins will continue down "significantly" even further from current price levels. I just don't see this bear market lasting much longer for the alt-coin/usd pairs.
I suppose it's POSSIBLE we have a bull run in the Alt coins and a continued bear market in BTCUSD. However, I have a hard time getting in line with that narrative. Either all legitimate coins and BTC go up together or they go down together from current location. It's my opinion they're all about to go up while the stock markets go down.
If my analysis' for the US markets and crypto markets are correct, it's quite possible many (who have yet to get into crypto) begin to see crypto currencies may very well be a safe haven from our corrupt FIAT system in a similar way physical gold and silver in your hands is a safe haven. This realization may provide more liquidity into the crypto markets than we have seen before. However, if these new adopters of crypto don't act soon, they may not have a chance to transfer FIAT to exchanges like Coinbase and Gemini to convert their FIAT into crypto. In other words, Time is of the essence if they are to move capital into crypto exchanges.
Citizen's of Greece is a prime example. It was too late for them to transfer their capital into crypto exchanges AFTER their banks began limiting the amount of capital they can have access to in their own accounts. Spread the word around... Try to encourage others who have not adopted crypto to invest at least 5% of their capital into quality decentralized cryptos to hedge against the failing FIAT monetary system.
I'm about to go to Lowe's. More charts of different time frames will follow later this evening.
As a reminder (Disclaimer): My thoughts (ideas) are my own and are by no means "advising" others what to do with THEIR OWN CAPITAL. The decisions you make with your own money are rest solely on your own shoulders. My publications are simply OPINION.
Enjoy your evening and I'll update with more charts soon.
BTC Correction to Complete Near 7.8k$ (Confluence of Indicators)It seems that everyone is still worried about BTC these days, and reasonably so. However, I believe that a confluence of indicators suggest that we are very close to the end of this long hard bear market. By my count, this correction conforms fairly well to a WXYXZ style correction (though there are valid alternate counts). Currently, I believe that we are completing the last wave downward on our final zigzag leg (labeled X-Z). Remember that zigzags always have a 5-3-5 rule. Each of these is labeled on the chart.
The end of the Bear: A Confluence of Indicators.
Last week, (during wave 3), we experienced a very hard bounce off the long term historical support level of 7.8k$. I think that this range may be tested again on this final leg down. By my count, I would expect that prices may continue to decline to touch these levels before moving back up again. However, I do not think that 7.8k$ will be breached due to this being a historical support level. This notion is supported by the strong surge in volume when the price attempted to breech this support.
MACD Shows Bullish Divergence
Note the MACD shows two crossover points which correspond to the (Y) point as well as the (3) wave of this current (X-Z) on the larger degree of trend. What stands out to me is that these crossover points on the MACD show a **higher low**. This property, known as bullish divergence, indicates that the sellers are running out of steam and that demand will potentially pick back up.
RSI Shows Support Levels
Now for the RSI. With moving up of wave (4) on our current zigzag, we saw a swing into the *neutral zone* of 30-60. The RSI shows also a series of higher lows suggesting again that the bears are running out of steam. I see two RSI support zones, first at 35, and again at 30. As we make our attempt to push downward to test 7.8k$, I expect that this support will be tested and held (in confluence with the MACD).
The bears are getting tired ...
I also want to make a note of the fact that the ratio BTCUSDLONG/BTCUSDSHORT has snapped back from its low, and the corresponding RSI has moved back into the neutral zone. Currently, for every 1.0 BTC in a short position, there are 2.267BTC in a long position. Compare this to the deepest part of this last leg down, where the the ratio was about 1.0BTCLONG/1.0BTCSHORT. In other words there are much fewer people shorting the market - leading me to believe that BTC will soon begin to rise once again.
To break below the historical 7.8k$ support would require another huge surge in sell volume (panic selling). Additionally, the MACD bullish divergence would have to break along with both RSI support levels. My intuition is that the price may test this level, and bounce back perhaps forming a *leading first wave diagonal* to initiate a new bull cycle. Undeniably, this market has been a difficult learning experience for us all, and I hope that everyone has developed a healthy respect for such powerful market tides.
*Take care during the end of this correction!*
*Confidence 4.0/5.0*
@mxcrypt
Standard Legal Note
These are solely my own ideas! This is by no means professional financial advice and I cannot be held accountable for any investment decisions undertaken by reading this article!

To know where TRON is going you need to look at indicatorsIt is blantly obvious that TRON is highly bearish. It is also no secret that this coin is being manipulated by bots. Whatever the reasons may be for price suppression, could be considered highly bullish in the future. It is also highly probable that whales are trying to flush out as many weak hands out of the market as possible, for accumulation...
Triangles and and pennants will not predict anything for TRON. For TRON, you must look at indicators. Buy volume is LOW, MACD is bearish, and heavy resistence on ichimoku cloud.
Buy target: 430 sats ----> This is where we saw strong support, and a good demand zone
I have no doubt it will rise many times more as all cryptos will eventually, but anyone telling you to buy TRON at 700,600, and even 500 satoshis is simply trying to believe in their triangle/breakout patterns which will most likely not happen. You need to see where strong support is, and what indicators are telling you. And for now, TRX is highly bearish, and you will lose money buying at these levels. Bots will continue to slowly bleed out the price.

Yen Major Move Up Coming! Custom COT Indicators!Overview.
-This is the Beginning of a Educational Series from Jake Bernstein to the TradingView Community.
-Many Traders use the COT Data Incorrectly.
-Jake Discovered if You Look at the Net Commercials and Take Note When Commercials net Buying is Either At All Time Highs, Or Net Buying = Longest Period of Buying Look for an Extreme Move To the Upside.
-In The Future We Will Show Precise Entry Signals…But a Basic Entry Signal Is When Commercials Go From Net Long to Net Short.
-Full Credit in Methodology goes to Jake Bernstein at www.Trade-Futures.com and www.2Chimps.net
Thought Process:
-Commercials Represent Large (Typically Billion Dollar) Companies.
-Take Note - When Commercials Are Buying at Record High
-Take Note - When Commercials Are Buying For Record Long Periods of Time
***Note…Commercials Can Buy For Extended Periods Dollar Cost Averaging…
***Basic Entry Listed In Overview.
***More Precise Entries Will Be Introduced Soon.
Take Note When Commercials STOP Buying and START Selling
Indicator Shows Net Commercials
-Full Credit goes to Greeny for Creating Original Code. I only made slight modifications.
Lower Indicator Modifications include
-Took Off Net Long and Short Individual Plots
-Added Optional Background Highlighting when Commercials Switch from Long to Short
-Added Optional Alert Capability If Commercials Go From Net Long to Short
-Ability to Show INVERSE - This makes it Easier for some Traders to See…Since the Signals look similar to MacD/RSI Type Indicators.
Upper Indicator Modifications include:
-Added Ability to Plot Text Entries when Commercials Switch From Net Long To Short
-Added Optional Background Highlighting when Commercials Switch from Long to Short
-Added Optional Alert Capability If Commercials Go From Net Long to Short
***Additional Indicators and Updates Coming Soon
***Link To Lower Indicator & Upper Indicator Below Under Related Ideas:

Bullish on AEZS . Stock crosses key indicators!We have been monitoring $AEZS for sometime. The stock has crossed key technical indicators. We are bullish.
We are are confident the stock will remain relatively stable now that the base of support is forming above the 200EMA. We will also look to buy the stock on weakness. Given that this is a BIOTECH that is dependant on clinical trials and FDA approval, huge swings could occur based on those outcomes.
Should the stock fall below the 200EMA and develops negative indicators, we will re-evaluate our position.
Our target price for this stock is $5.00 (fair value)

DAX in transition zones, indicators in conflictSo we have conflicting indicators. MA's indicate we go lower soon, and change of uptrend to down. MACD AND RSI indicate we bounce here. So head fake becomes bear flag, or trend stays up for a while? MMMMMM? Can you say geo political trumps the indicators, or Ukraine settles and goes away? Not likely.

USD/JPY Long Trade Setup – Key Support Rebound Targeting 148.674Entry Point:
Price: 143.373
The chart suggests initiating a long (buy) position at this level, which is just slightly below the current market price.
Stop Loss:
Price: 141.707
Positioned below a strong support zone. This level protects the trade from excessive downside risk if the price breaks down.
Target Point:
Price: 148.674
The target is clearly defined, indicating a potential gain of approximately 5.991 points, or 4.20% from the entry.
🟪 Support/Resistance Zones
The purple boxes indicate demand (support) and supply (resistance) zones.
The lower zone (entry/stop area) shows a historically significant support range that has been tested multiple times (indicated with orange circles).
The upper purple zone marks the take-profit area, which coincides with previous resistance.
📊 Moving Averages
Blue Line: 200 EMA (Exponential Moving Average) – acting as dynamic resistance.
Red Line: 50 EMA – price is currently trading below it, indicating bearish short-term pressure but potential for reversal.
🧠 Trade Idea Summary
Bias: Bullish (long position)
Risk-Reward Ratio: Favorable
Risk: ~1.67 points (from 143.373 to 141.707)
Reward: ~5.3 points (from 143.373 to 148.674)
Approx. R:R = 1:3.17
Validation: The setup relies on the price holding the key support zone and bouncing higher, targeting the next major resistance.
⚠️ Considerations
Monitor for bullish candlestick patterns near the entry zone.
Keep an eye on macroeconomic news (like BoJ or Fed updates) that could cause volatility in USD/JPY.
Confirm momentum shift with RSI or MACD if using indicators.

BTC/USD: Key Levels and Breakout Watch!!Market Overview:
The BTC/USD pair is currently in a consolidation phase, with price action contained between two key levels. This analysis aims to evaluate the market structure, potential breakout points, and the most likely directional move based on technical indicators. 📈
Price Structure & Key Zones:
Resistance Levels:
97,900 USD: This key resistance level has been tested multiple times. The market has recently interacted with it, showing signs of rejection. 🚧 Breaking above this zone would be a bullish sign. A sustained break would confirm a potential uptrend. 🚀
100,258 USD: The next critical resistance lies just above the previous level. A breakthrough here could confirm the market is ready to rally higher! 🎯
109,546 USD: The ultimate target zone, with further resistance likely. 🌌 A break through this area would confirm a significant bullish move.
Support Levels:
94,000-95,000 USD: Strong support in this range, where price has bounced higher before. 📉 A failure to hold this level could signal a bearish reversal. ⚠️
Trend Analysis:
200 EMA: The price is above the 200 EMA, showing a bullish short-term trend. 📊 A positive sign of upward momentum, confirming the current market sentiment is more inclined toward the upside. 🚀
Rising Wedge Formation: This is a continuation pattern, suggesting that the market could break higher if resistance is overcome. 🔼 The potential move toward 100,258 USD could be the next phase if the breakout occurs.
Volume & Momentum:
Volume has been relatively low, indicating consolidation. 💡 A breakout with higher volume would confirm the strength of any directional move. 💥
Potential Scenarios:
Bullish Scenario:
If the price breaks above 97,900 USD, we can expect a bullish move toward 100,258 USD, with the 109,546 USD zone as the next target. 🚀📈
Bearish Scenario:
A failure to break resistance could lead to a pullback to 94,000-95,000 USD, or even lower if support breaks down. ⚠️ A downside move may signal a deeper correction.
Conclusion:
The market is at a crucial point. If Bitcoin can break through 97,900 USD, we may see a bullish rally toward 100,258 USD and 109,546 USD. 🚀 If resistance holds, expect a possible move toward lower support levels. 🛑 Keep an eye on volume and key levels! 🎯
Let’s stay alert and react accordingly! 📊📈

CROSSING death cross on numerous indicators 340s in sightThe stochastics show a death cross formulating on the daily and numerous other indicators. It jumped with volatility and more than usual volume; I did declare that it may come down for a correction at some point before I expected it to break through 400, like a cannon. Still a firm supporter of bearish mode and stance.

LuxAlgo Premium Indicatorsjust recorded a first video scalping 1 hour timeframe with luxalgo's premium indicators. price action and signals and overlays. been testing this over the last day only and this is what ive noticed.
it does line up with the rendline breaks, my own custom trigger called the cru trigger- which just lines up the EMA 20/50 cross and VWMA. Keeping an eye on macd and RSI too.
the smart trail helps with stop loss and signal shift for buy sell. the reversal zones help for sure and order blocks and FVG on top of it all makes this have so many confluences that help when they all line up.
with BTC it doesnt have the up and down wicks like forex will. so you really can take tighter stop losses which i always do for max RR gains. feel free to be more flexible on SL as you feel comfortable too.

Why is the Canadian Dollar Outperforming Expectations?A Deep Dive into the Unexpected Resilience of the CAD
In a landscape marked by economic uncertainty, the Canadian dollar has defied the odds, exhibiting remarkable resilience. This unexpected strength is a result of a complex interplay of factors, including the Federal Reserve's monetary policy, market dynamics, and global commodity trends.
The Federal Reserve's Pivotal Role
The Federal Reserve's shift towards a more accommodative monetary policy has been a key driver of the CAD's rally. The Fed's hints at potential rate cuts, especially in response to a weakening labor market, have weakened the U.S. dollar, boosting the appeal of other G10 currencies, including the CAD. This has created a favorable environment for the Canadian dollar, as investors seek higher-yielding alternatives to the U.S. dollar.
Short Covering and Positioning Dynamics
Another significant factor contributing to the CAD's strength is a wave of short covering. Traders had previously bet against the CAD, anticipating a divergence between the easing cycles of the Federal Reserve and the Bank of Canada. However, as the U.S. dollar weakened and the CAD began to rise, these short positions became increasingly unsustainable. Traders were forced to unwind their bets, adding momentum to the CAD's rally.
The Impact of Rising Oil Prices
Canada's significant oil exports make it particularly sensitive to fluctuations in oil prices. The recent increase in crude oil prices, driven by geopolitical tensions and potential supply disruptions, has provided a further boost to the CAD. As a major oil producer, Canada benefits from higher oil prices, which can lead to increased exports and a stronger currency.
Assessing the Risks and Challenges
While the CAD's rally has been impressive, it is important to acknowledge the potential risks and challenges that could undermine its momentum. The Bank of Canada's rate cuts, although expected, could narrow yield differentials and put pressure on the CAD. Additionally, ongoing global uncertainties and subdued risk appetite could limit the loonie's upside potential.
Key Data to Watch
Several key data releases will be closely monitored in the coming weeks. Canada's GDP data will provide insights into the health of the Canadian economy and could influence the Bank of Canada's policy trajectory. Meanwhile, U.S. economic reports, such as PCE, will be watched for potential shifts that could affect the USD/CAD exchange rate.
Conclusion
The Canadian dollar's unexpected resilience is a testament to its strength in a challenging economic environment. While the current momentum is positive, investors should remain cautious and closely monitor key economic indicators. By understanding the underlying factors driving the CAD's rally and assessing the potential risks, investors can make informed decisions about their currency exposure.

Watch List Rundown - Incorporating Time Frames and indicatorsThis exercise incorporates your watchlist with you indicators. How many stocks in my watchlist are telling me the story I want to verify to enter into a trade. Goal, find a indicator that correlates with the move you are attempting to trade. In this scenario we are looking for Green Volume Sticks for long entry. Using the 12M Time Frame give us the 50,000 foot view of whether or not the overall volume is buys or sells.

Monetary Policies and Economic Indicators.In the recent trading session, the EUR/USD currency pair experienced an uptick, largely attributed to a pervasive weakness in the U.S. dollar. However, this increment does not signal a substantial relief for investors with long positions, as the anticipated monetary policies of the Federal Reserve (Fed) and the European Central Bank (ECB) seem to present adversarial conditions.
A significant confirmation of the disinflationary trend within the Eurozone was evidenced on Tuesday, following the announcement that inflation rates had declined to near three-year lows. This observation was substantiated by the marked decrease in the Consumer Price Index (CPI) and the Harmonised Index of Consumer Prices (HICP) in Germany for March, which receded considerably from the figures reported in February.
This fresh data on pricing lends robust support to the argument favoring the initiation of interest rate cuts by the ECB, potentially preceding similar actions by the Fed and possibly at a more accelerated pace. The rationale behind this is to counteract the effects of diminishing inflation, thereby stimulating economic activity within the Eurozone.
In contrast, in the United States, the yields on Treasury securities, specifically the 2-year (US2YT=RR) and 10-year (US10Y) notes, have continued their upward trajectory. This trend underscores a growing sentiment among investors, reducing the likelihood of substantial rate cuts by the Fed, contrary to prior expectations. The shift in investor sentiment is further illustrated by the adjustments in the CME's FedWatch tool, which currently suggests a slightly above 60% probability of a rate cut in June, a significant reduction from the nearly 75% probability indicated a month ago.
This recalibration of expectations regarding the Fed's rate cuts has markedly enhanced the yield advantage of the U.S. dollar relative to the euro. The differential in yields between German and U.S. government bonds (US2DE2=RR) has expanded to its widest margin since the early days of January. Should this trend persist, it might increasingly rarefy instances of EUR/USD rallies.
The focus now shifts to forthcoming U.S. economic data releases, including weekly claims, the March ADP employment report, and payroll figures. Investors maintaining bullish outlooks on the EUR/USD pair are keenly awaiting these reports, hoping for indications of a softening labor market. Such developments could potentially elevate the likelihood of Fed rate reductions. Conversely, robust employment data may exert downward pressure on the EUR/USD pair, potentially driving it towards the 1.0500 threshold.
In summation, the interplay of monetary policies between the Fed and the ECB, coupled with the dissemination of key economic indicators, remains pivotal in shaping the trajectory of the EUR/USD exchange rate. Investors and analysts alike are advised to closely monitor these developments, as they hold significant implications for currency markets and broader financial stability.

Combining FX Direction and FX Speed indicators.FX Direction helps you see which way the trend is going, making it easier to decide when to enter or exit a trade. FX Speed adds to this by showing how fast the trend is going and if it might change soon. These indicators simplify the process of knowing when to buy or sell, giving you more confidence in your trading decisions. With FX Direction and FX Speed, you can better understand market movements and make smarter choices

USDJPY's Breakout and Economic IndicatorsGreetings Traders,
In today's trading session, our focus shifts to USDJPY, where we are actively monitoring a potential selling opportunity around the 144.600 zone. After trading in an uptrend, USDJPY has experienced a significant breakout to the downside. The currency pair is currently navigating a correction phase, steadily approaching the critical retrace area at the 144.600 support and resistance zone.
A deeper analysis involves considering recent economic indicators. The Federal Open Market Committee (FOMC) and Consumer Price Index (CPI) data play pivotal roles in understanding the broader economic landscape. The most recent FOMC meeting revealed a dovish stance, with an emphasis on supporting economic recovery. Additionally, the CPI figures highlight inflation easing, contributing to the cautious approach of the central bank.
Moreover, the latest Institute for Supply Management (ISM) figures underscore the challenges faced by the U.S. manufacturing sector, with the index slipping to 50.6, below both the forecasted 52.5 and the previous 52.7. This unexpected downturn in manufacturing adds a layer of complexity to USDJPY's correction phase, potentially furthering the weakening of the U.S. dollar.
As USDJPY hovers around the 144.600 level, traders should exercise vigilance and consider the broader economic context when making trading decisions. The confluence of technical and fundamental factors enhances the significance of this monitoring session, urging traders to remain adaptable to evolving market conditions.
Trade safe,
Joe.

Short-Term EUR/USD Position: Technical Indicators Signal BearishI've initiated a short position on EUR/USD in the short term, guided by a confluence of technical indicators. Firstly, the currency pair is trading below the crucial 200-period Simple Moving Average (SMA) on the hourly chart (H1), indicating a potential shift in momentum favoring the downside.
Furthermore, the Relative Strength Index (RSI) has dipped below the 50 mark, underscoring a bearish sentiment and suggesting a potential continuation of the downward trend. Adding to this, there is a notable barrier at the 1.1000 level, acting as a strong resistance point. The convergence of these technical factors strengthens my conviction in the likelihood of a downward movement in the EUR/USD pair in the short term.

ADA: Further Clarification of Upward Pressure Using IndicatorsHi Everyone! I wanted to provide more clarification on "why" I believe the price action will continue to trend up for the Near to Mid Term by using my indicators. I also pointed out the importance of allowing a candle to "close" before confirming bullish or bearish divergence.
EXAMPLE: If we determine we have bullish divergence and we are prepared to open a long position, it is important to ask yourself, "What level is my red line?" Why? Because the level of the Red Line provides clues of WHERE your price action could go up to in that case. Same thing if you see bearish divergence. Once the Energy goes below level 50, you should ask yourself, "What level is my Red Line?" Because identifying the level of the Red Line helps determine where the price could go down to.
Yes, in some cases, we will see over extension up after bullish divergence and we will see over extension down at times when we see bearish divergence. In that case, you should identify the level of the Red Line to determine where the price action could go and for how long the price action may or may not continue in that particular direction.
I hope this video publication was helpful.
Happy Trading and Stay Awesome!
David
NOTE: Labeled "LONG" for the Near to Mid Term for an anticipated Sign of Strength event.

EUR/GBP Primed for Movement Amidst Key Economic IndicatorsThe sentiment from central banks, coupled with softer UK inflation data, suggests a bullish move for EUR/GBP. The technical analysis aligns with this perspective, indicating a potential move towards the 0.8700 handle, especially with the currency pair managing to stay above the 0.8650 level.
TRADE IDEA DETAILS
CURRENCY PAIR: EUR/GBP
CURRENT TREND: Bullish
TRADE SIGNAL: Buy
👉ENTRY PRICE: 0.8655
✅TAKE PROFIT: 0.8700
❌STOP LOSS: 0.8630
TRADE PLAN:
Enter a buy position around the current level of 0.8655. Given the potential upside, a take profit can be set near the technical resistance of 0.8700. To protect the downside, considering the inherent market volatility and any unexpected shifts in sentiment or data, a stop loss at 0.8630 is prudent.
FINAL THOUGHTS:
This trading idea is predicated on both fundamental factors (central bank sentiments and economic data) and technical indicators. Traders should monitor the position closely, especially around the time of the BoE's rate decision and subsequent economic releases, as these could serve as catalysts for significant price movement.

Bitcoin's Next Move: Possible Targets if 25K Support is Broken!Get ready for an exciting Bitcoin adventure! Today, I'll delve into potential targets in case the critical 25K support level is breached.
🎯 Target 1: Closing the Gap - $23,500
When analyzing Bitcoin's price movements, gaps in the Bitcoin Futures market can be significant indicators. My investigation reveals a notable gap around $23,500. Typically, price retraces to fill these gaps. If the 25K support breaks, this becomes a plausible target as traders aim to close the gap.
🎯 Target 2: Retesting Key Support - $21,000
If selling pressure increases after breaching the 25K support, Bitcoin may retest a critical support level near $21,000. Historically, this level has been psychologically and historically important. A drop to this level is likely to attract attention from traders and investors as it presents a significant buying opportunity and tests Bitcoin's overall market sentiment.
🎯 Target 3: Bearish Momentum - $18,000
While it may sound concerning, it's essential to consider all scenarios. If bearish momentum strengthens and selling pressure persists, Bitcoin could potentially drop to around $18,000. Although this target may seem drastic, it aligns with historical price patterns and Bitcoin's volatility in the past.
Remember, these targets indicate potential price levels in the event of the 25K support breaking. Factors such as market dynamics, sentiment, and other influences can affect Bitcoin's trajectory. It's vital to analyze a range of scenarios and make informed trading decisions.

DXY Outlook: Hawkish Fed and Key Indicators Point to StrengthTVC:DXY
Fed Chair Jerome Powell's cautiously hawkish stance, indicating a willingness to raise interest rates and maintain a restrictive policy, aligns with several key economic indicators. The Interest Rate at 5.5% and Inflation Rate at 3.2% suggest that the Fed is indeed in a tightening cycle, which is generally bullish for the U.S. Dollar Index (DXY). The GDP Growth Rate of 2.4% further supports this hawkish outlook, as a growing economy often strengthens the currency.
However, there are dovish elements to consider. The high Government Debt to GDP ratio of 129% and a negative Balance of Trade could exert downward pressure on the DXY. Consumer Confidence at 69.5 and Money Supply at 5,517,200 USD Million also warrant attention, as they could influence consumer spending and liquidity, respectively.
Short Target: 103
Long-Term Target: 106-109

My most used indicators Title.
RIOT is outperforming the entire market. Mostly it’s for showing the best community made scripts in pine as beautiful indicators.

GBP/NZD Technical Indicators Say BUY!
I see a perfect bullish convergence of 3 technical indicators.
The technical outlooks is supported by a current fundamental sentiment
and the fact that the pair is trading in a long-term bullish trend.
I assume that the pair will keep growing.
Target level - 2.0866
Please, support my work with like!
