XAUUSD 100% CONFIRM ANALYSISDiscover an enticing selling opportunity in GOLD as it undergoes a critical retest of a key support area. With market analysis, technical indicators, and price action as your allies, evaluate the potential downside move. Stay vigilant and informed to capitalize on this precious metal's market dynamics.
Search in ideas for "INDICATORS"

XAUUSD 100% CONFIRM ANALYSISDiscover an enticing Selling opportunity in GOLD as it undergoes a critical retest of a key resistance area. With market analysis, technical indicators, and price action as your allies, evaluate the potential downside move. Stay vigilant and informed to capitalize on this precious metal's market dynamics.

XRPUSDT - Long Couple of things to note here:
USDT pair:
Support on 1D and 2D GRM
Triangle breakout
BTC pair:
Oversold on 1W (also 3D,4D,5D,6D...)
Massive bullish divergence + multiple indicators flashing green
Check charts below and verify for yourself

XAUUSD 90% CONFIRM ANALYSISDiscover an enticing Selling opportunity in GOLD as it undergoes a critical retest of a key resistance area. With market analysis, technical indicators, and price action as your allies, evaluate the potential downside move. Stay vigilant and informed to capitalize on this precious metal's market dynamics.

Chart indicators heating up, signaling strong bullish sentiment $OM/USDT | TA 📊
Chart indicators heating up, signaling strong bullish sentiment for altcoins. Immediate targets:
T1: 0.3200
T2: 0.3600
A potential correction around 0.2997, but the RSI (52) bullish stance suggests prevailing upward momentum. Trade cautiously!
#MANTRA #RWA

$GME: 🚨 $21 next target 🎯Hello everyone,
Hope everyone is excited as I am for this next move up. If NYSE:GME is able to break above $15.81 and hold it there with a 4hr or daily close, then price should move up towards $21. Conversely, if NYSE:GME fails to break above and hold above those levels, then NYSE:GME will fall down to the $12.40 area with a hopeful bounce at $13.50.
Overall, I'm still bullish on NYSE:GME because the indicators suggest it is still in a bullish configuration. Since my last post where I forecasted a pop to $15.76, NYSE:GME may retest $15.05 before bulls take over and break above $15.81 to make the move to $21.
Good luck, everyone! As always, not financial or sexual advice. 🚀 I will try my best to update this post once we see some action on either side.

MSTR Long Momentum Seen: New High Possible?
Title:
MSTR Long Momentum Seen: New High Possible?
Overview:
Hello Traders,
MSTR is showing strong long momentum with high volume, fueling speculation of a potential push towards new highs.
NASDAQ:MSTR
Key Points:
- MSTR is exhibiting robust long momentum, supported by high trading volume, suggesting significant buying interest in the stock.
- The combination of strong momentum and high volume often indicates a continuation of the current uptrend, potentially leading MSTR to achieve new highs.
- Traders are closely monitoring MSTR's price action for confirmation of the bullish trend continuation and potential entry points for long positions.
Technical Analysis:
MSTR's price chart displays clear signs of bullish momentum, with price consistently making higher highs and higher lows. Volume indicators confirm strong buying pressure, reinforcing the bullish bias and suggesting further upside potential.
Conclusion:
With MSTR demonstrating strong long momentum and high volume, traders may anticipate a push towards new highs. However, it's essential to remain vigilant and monitor price action closely for confirmation of the uptrend continuation before entering into new positions.
Don't Forget to Engage:
Please LIKE 👍
FOLLOW ✅
SHARE 🙌
COMMENT ✍
If you found this idea insightful! Your engagement contributes to the community's knowledge and helps broaden the reach of valuable insights.
Leave your feedback in the comment section below or by boosting /Liking this.
See you in the next idea post.
Happy trading!

Despite Bullish Indicators, Significant Risks Loom for WLD BINANCE:WLDUSDT is attempting to overcome the resistance level at $9.241.This is after it printed a second higher low on its 4-hour chart.
The Exponential Moving Averages (EMAs) provide a deeper insight into the market's momentum. The 9 EMA values, starting from 8.6536 and moving up to 8.8183, alongside the 20 EMA values, which have increased from 8.2712 to 8.4845, both suggest a bullish trend. This upward movement in the EMAs is a positive sign for traders, indicating that the market might be gaining strength.
The Moving Average Convergence Divergence (MACD) further supports this bullish sentiment. The MACD values have shown slight fluctuations, with the most recent figures indicating a narrowing gap between the MACD line and the signal line. Although there was a brief period where the histogram values were negative, suggesting a potential bearish reversal, the overall trend remains positive. This is evidenced by the latest histogram value moving closer to the zero line, indicating diminishing bearish momentum.
The Relative Strength Index (RSI) has remained above 50 throughout the observed period, peaking at 62.9383. This indicates a strong market with potential for continued growth, as values above 50 generally suggest a bullish market.
Volume analysis further supports the bullish sentiment, with a noticeable increase in trading volumes. This increase in volume alongside price appreciation is a positive sign, indicating strong buyer interest and potential for sustained upward movement.
Potential Movements and Trading Strategies
Given the current technical indicators, the Worldcoin price is showing signs of a bullish trend. However, traders should keep an eye on key resistance and support levels for potential entry and exit points. The immediate resistance level to watch is at $9.241. A break above this level could signal continued bullish momentum, potentially opening up opportunities for long positions towards the next resistance levels.
On the downside, support levels are found at $8.04 and $6.414. A break below these levels, especially the $8.04 mark, could indicate a shift in market sentiment, potentially leading to a bearish trend. Traders might consider these levels for setting up stop-loss orders or for potential short positions if the market shows signs of reversal.
Although technicals are flagging bullish for WLD. The altcoin has already failed to break above the $9.241 resistance level twice in the past couple of days. Another rejection in the next 24 hours may lead to a strong correction in the Worldcoin price.

XAUUSD 100% CONFIRM ANALYSISDiscover an enticing Selling opportunity in GOLD as it undergoes a critical retest of a key resistance area. With market analysis, technical indicators, and price action as your allies, evaluate the potential downside move. Stay vigilant and informed to capitalize on this precious metal's market dynamics.

Exscientia's Bold Leap Forward in AI-Driven PharmaIntroduction: A Turbulent Turnaround
Exscientia plc (NASDAQ: EXAI), a pioneering force in AI-driven pharmaceuticals, recently faced a storm that tested its core. Amidst leadership controversies, the company has not just weathered the storm but is poised for a transformative leap, signaling a potent mix of resilience and innovation.
Recent Financial Performance and Market Dynamics
As of the latest update, Exscientia's shares experienced a modest uptick, closing at $6.92, marking a 2.67% increase. This movement reflects a dynamic response to both internal shifts and the broader market's reception. Notably, the company's market cap stands at approximately $864.585 million, with a trading volume that underscores robust investor interest. The EPS (TTM) is currently at -1.47, indicating the investment-heavy phase typical of pioneering tech-driven entities. The anticipation builds as the earnings date approaches, scheduled between March 18, 2024, and March 22, 2024, promising insights into the company's trajectory.
A Leadership Shakeup with a Silver Lining
Exscientia's recent headlines have been dominated by the dismissal of its CEO, Andrew Hopkins, following an investigation into "inappropriate" relationships with employees. This leadership crisis, however, has not dampened the company's spirit or its commitment to groundbreaking work in AI and pharmaceuticals. Instead, it has catalyzed a reflective reevaluation of its corporate culture and governance, setting the stage for a renewed focus on innovation and ethical leadership.
Growth Drivers and Innovation at the Helm
Despite the challenges, Exscientia remains at the forefront of integrating AI with pharmaceutical development. The initiation of EXCYTE-2, an observational clinical study in acute myeloid leukemia (AML), exemplifies its commitment to leveraging deep learning and single-cell precision medicine platforms. This study aims to investigate the relationship between ex vivo drug response and actual patient clinical responses, heralding a new era in personalized medicine.
Technical and Market Outlook: A Resilient Trajectory
The stock's technical indicators reveal a bullish pattern, with a day's range showing a high of $7.20, suggesting volatility and investor interest. The broader outlook remains positive, with analysts eyeing a potential upside, reflecting confidence in Exscientia's technological edge and market position.
Conclusion: Navigating the Future with Precision and Purpose
Exscientia's journey through recent turmoil to a place of potential and promise is a testament to the resilience and transformative power of innovation. As it embarks on a new chapter, free from the shadows of the past and driven by a commitment to revolutionizing healthcare through AI, Exscientia stands as a beacon of progress in the ever-evolving pharmaceutical landscape.
---------------
NOT TRADING ADVICE. ALWAYS DO YOUR OWN RESEARCH.

How GLBS is Setting Sail for Success?!Introduction:
Globus Maritime Limited, a key player in the dry bulk shipping industry, has recently been in the spotlight for its financial performance and strategic moves in the shipping sector. With a fleet that transports a variety of dry bulk cargoes globally, GLBS's activities are a bellwether for the maritime shipping industry's health and prospects.
Recent Financial Performance:
For the third quarter ending September 30, 2023, Globus Maritime reported revenue of $7.7 million, with a noteworthy net income of $3.5 million for the quarter. This performance is part of a larger trend for the nine-month period ending in September, during which the company generated $24.1 million in revenue and net income of $4.9 million. These figures represent a significant operational achievement, underscoring GLBS's ability to navigate the complex market dynamics of the shipping industry.
Revenue and Profit Forecasts:
Looking ahead, Globus Maritime is positioned for growth. With the addition of the M/V "Glbs Hero," a new build Ultramax dry bulk carrier, to its fleet, the company is expanding its cargo-carrying capacity. This expansion, coupled with a favorable market outlook for dry bulk shipping, sets the stage for potential increases in revenue and profitability in the coming years.
Growth Drivers:
Several factors are propelling GLBS's growth. The acquisition of fuel-efficient vessels like the M/V "Glbs Hero" not only increases the company's operational efficiency but also enhances its competitive edge in a market increasingly focused on sustainability. Additionally, the recovery in global trade post-pandemic is likely to boost demand for dry bulk shipping, further fueling GLBS's growth.
Technical and Market Outlook:
The technical indicators for GLBS are showing promising signs, with a bullish pattern detected in its trading activity. The stock has fluctuated between $0.68 and $3.15 over the past 52 weeks, showcasing significant volatility but also opportunity for gains. With a current price around $2.21, the company's stock reflects a complex interplay of market dynamics and investor sentiment.
Conclusion:
Globus Maritime Limited stands at a pivotal point, with strategic fleet expansions and a favorable industry outlook paving the way for future success. Investors and industry watchers will be keenly observing how GLBS navigates the evolving market conditions, with an eye on its ability to capitalize on the burgeoning opportunities in the global shipping sector. As GLBS sets its course towards uncharted waters, its journey will undoubtedly be one to watch for those interested in the maritime trade and investment landscape.
---------------
NOT TRADING ADVICE. ALWAYS DO YOUR OWN RESEARCH.

Pioneering Cancer Treatment with QINLOCK and VimseltinibIntroduction
Deciphera Pharmaceuticals, Inc. (NASDAQ: DCPH) is at the forefront of developing innovative cancer treatments, with a keen focus on leveraging their proprietary switch-control kinase inhibitor platform. The company has made significant strides, particularly with its flagship product, QINLOCK, and the promising pipeline candidate vimseltinib, aiming for a transformative year in 2024.
Revenue and Profit Forecasts
Deciphera has projected an optimistic financial trajectory for 2023, with preliminary unaudited revenue for the fourth quarter estimated at approximately $47 million and full-year revenue expected to be around $162 million. This growth is largely attributed to the robust sales of QINLOCK, which alone contributed roughly $46 million in net product revenue in Q4 2023. The company's financial health is further underscored by its substantial cash reserves, amounting to approximately $352 million as of the end of 2023, ensuring operational and capital expenditure funding well into the second half of 2026.
Growth Drivers
The continued expansion and commercial success of QINLOCK in treating gastrointestinal stromal tumor (GIST) patients, along with the strategic rollout of vimseltinib for the treatment of Tenosynovial Giant Cell Tumor (TGCT) and potential applications in chronic graft versus host disease (cGVHD), underscore Deciphera's growth trajectory. The company's strategic partnerships, such as the distribution agreement with GENESIS Pharma for QINLOCK in Central and Eastern Europe, are pivotal to its international market expansion.
Recent Financial Performance
Deciphera's earnings in Q4 2023 beat analyst expectations, reporting an EPS of -$0.54 against the anticipated -$0.58. This performance reflects a 32.9% increase in quarterly revenue year-over-year, indicating strong commercial execution and market acceptance of its products. Analysts remain optimistic about the company's future earnings, projecting gradual EPS improvement through 2025.
Technical and Market Outlook
Deciphera's technical indicators and market sentiment appear positive, buoyed by recent financial results and the potential for its pipeline candidates. The company's strategic focus on developing first-in-class and best-in-class treatments for cancer positions it well within the biopharmaceutical sector for sustained growth and innovation.
Conclusion
Deciphera Pharmaceuticals is poised for significant growth in 2024 and beyond, driven by its innovative product portfolio, strategic market expansions, and strong financial position. With QINLOCK's continued success and the anticipated commercial launch of vimseltinib, Deciphera is on the cusp of evolving into a self-sustaining, multi-product company. As it advances its mission to improve the lives of people with cancer, the biopharmaceutical firm remains a compelling entity within the oncology space, promising exciting developments for investors and patients alike.
----------------
NOT TRADING ADVICE. ALWAYS DO YOUR OWN RESEARCH.

XAUUSD 100% CONFIRM ANALYSISDiscover an enticing Selling opportunity in GOLD as it undergoes a critical retest of a key resistance area. With market analysis, technical indicators, and price action as your allies, evaluate the potential downside move. Stay vigilant and informed to capitalize on this precious metal's market dynamics.

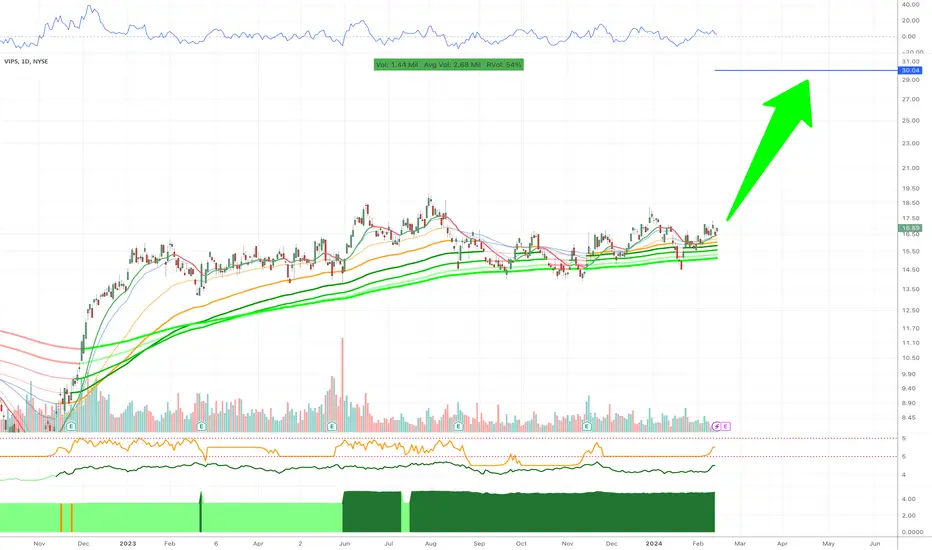
Vipshop Holdings LimitedVipshop Holdings Limited (NYSE:VIPS) has shown significant performance in the stock market with an impressive 11% increase over the past month. This growth prompts a deeper look into the company's key performance indicators, especially considering the high return on equity (ROE) of 23%, indicating the company's efficiency in generating profits from its shareholder investments. This high ROE, coupled with a net income growth of 21% over the past five years, surpasses the industry average and highlights Vipshop's strong market position and operational efficiency.
Despite facing challenges in the market, Vipshop has managed to exceed expectations with its latest quarterly earnings, reporting $3.33 earnings per share, a significant leap from the consensus estimate of $0.40. This performance reflects not only the company's ability to navigate market volatility but also its strategic focus on growth and profitability.
Vipshop's commitment to sustainable development is further demonstrated by its upgraded MSCI ESG Rating to AA, showcasing its capabilities in environmental, social, and governance aspects. Additionally, partnerships aimed at ecological conservation and the release of its Environmental, Social, and Governance (ESG) Report, set to achieve carbon neutrality in its operations by 2030, underscore Vipshop's dedication to sustainable business practices.
For investors, Vipshop's consistent financial performance, strategic growth initiatives, and commitment to sustainability make it a compelling option in the online retail sector. The company's focus on leveraging its strong market position, along with its effective use of retained earnings for business expansion, presents a solid case for investment consideration.
NOT TRADING ADVICE. ALWAYS DO YOUR OWN RESEARCH.
SLVM: Sustainable Growth and Renewable Investments Sylvamo Corporation (NYSE:SLVM) , a leading global paper manufacturer, demonstrates strong financial results and an active strategy for returning capital to shareholders. In the third quarter of 2023, the company reported net income from continuing operations of $58 million or $1.37 per diluted share, significantly above the previous quarter ($49 million or $1.14 per diluted share). These results highlight the efficiency of management and Sylvamo's strategic direction towards increasing free cash flow and optimizing operational activities.
The company has also initiated the "Project Horizon" cost reduction program, aimed at achieving expense savings of at least $110 million by the end of 2024. This includes optimizing operations and reducing the global workforce by approximately 150 positions. For the fourth quarter, Sylvamo forecasts adjusted EBITDA in the range of $90 million to $110 million, reflecting expected volume improvements despite anticipated increases in operational and other expenses.
In addition, Sylvamo announced the payment of quarterly dividends of $0.30 per share and special dividends, as well as a $150 million share repurchase program. These measures underscore the company's commitment to returning value to shareholders and confidence in its financial stability and growth.
Sylvamo, with a focus on producing paper from renewable resources and operations in Europe, Latin America, and North America, strengthens its position as the preferred choice for investors interested in sustainable development and innovations in the paper industry. Considering strong financial indicators, strategic cost-cutting initiatives, and an active policy regarding shareholders, Sylvamo represents an attractive investment opportunity.
NOT TRADING ADVICE. ALWAYS DO YOUR OWN RESEARCH.

XEMPopped on my breakout finder
📈 *Symbol*: `XEM/USDT`
✅ *Qualification*: All MAs within 1% of MA7.
💰 *Market Cap*: `$314,594,092.89`
I'm noticing on the day the adx crossed below a level it never has and when it did the MACD signaled a Buy
With ADX When it's going upward that means trend following indicators work best
when its going down we use things like oscilators
MACD being an ocsilator pinged a buy and we're starting to uptrend. We also had a nice bounce of the .318 fib along with another breakout and swing low back tot the .5 fib showing a health upward trend as you see how volatility has completely dropped thats what the breakout/breakdown finder looks for tokens like that

AMPH: Expanding Horizons in the Pharmaceutical IndustryAmphastar Pharmaceuticals, Inc. (NASDAQ:AMPH) , an emerging pharmaceutical company specializing in the development, manufacturing, and marketing of complex generic and proprietary drugs, represents an attractive investment opportunity against the backdrop of current trends in healthcare and pharmaceuticals.
Amphastar stands out with its focus on complex generics, including products that require sophisticated manufacturing processes, creating barriers to entry for new competitors and giving the company a competitive edge. The company boasts a robust research base and infrastructure for new drug development, key to sustainable long-term growth.
In recent years, Amphastar has actively expanded its product portfolio through both internal developments and strategic acquisitions, allowing the company to strengthen its market position and broaden its presence across various therapeutic areas. This diversification reduces risks and enhances revenue growth potential.
The company's financial indicators show steady revenue and profit growth, making AMPH shares attractive to investors seeking stability and growth potential in the healthcare sector. Additionally, the company exhibits a strong financial position with a healthy balance of cash and short-term investments, providing flexibility for further research, development, and potential acquisitions.
The regulatory environment also plays a significant role in the success of pharmaceutical companies. Amphastar continues to actively engage with regulatory bodies to gain approval for new drugs and expand indications for existing products, which could be a catalyst for future stock price growth.
In conclusion, AMPH shares offer investors the opportunity to participate in the growth of an innovative pharmaceutical company with a strong product portfolio and stable financial standing. Given the current trends and needs in healthcare, Amphastar Pharmaceuticals has all the prerequisites for market success.

OKTA: Confident Growth Amid Decreasing Short InterestOkta, Inc. (NASDAQ:OKTA) , a leading provider of cloud identity and access management services, attracts investors' attention with its potential for sustainable growth and a noticeable decrease in short interest volume. The reduction in short interest is a positive signal, indicating a decrease in pessimism among investors regarding the company's future prospects, which could be a harbinger of an increase in stock value.
Okta continues to demonstrate strong results, thanks to its innovative platform that provides secure and convenient access to applications and services for organizations of various sizes. In a context of growing demand for cybersecurity and identity management solutions, Okta strengthens its market position by expanding its product portfolio and entering new segments.
The decrease in short interest volume may indicate that investors are becoming more confident in the company's ability to overcome current challenges and realize its growth potential. It may also suggest anticipation of positive news or improvement in financial results, which could push the stock price up.
Additionally, Okta invests in expanding its global infrastructure and developing technological innovations, allowing the company to maintain a high level of competitiveness and meet changing market demands. These strategic initiatives, combined with improved market perception as reflected in the decrease in short interest, create a solid foundation for long-term growth in stock value.
For investors looking for opportunities in the technology sector with sustainable growth potential, OKTA shares represent an attractive option. The decrease in short interest, coupled with strong operational indicators and a strategic focus on innovations and expansion, offers positive prospects for long-term investors.

XAUUSD 100% CONFIRM ANALYSISDiscover an enticing Selling opportunity in GOLD as it undergoes a critical retest of a key resistance area. With market analysis, technical indicators, and price action as your allies, evaluate the potential downside move. Stay vigilant and informed to capitalize on this precious metal's market dynamics.

XAUUSD 100% CONFIRM ANALYSISDiscover an enticing Selling opportunity in GOLD as it undergoes a critical retest of a key resistance area. With market analysis, technical indicators, and price action as your allies, evaluate the potential downside move. Stay vigilant and informed to capitalize on this precious metal's market dynamics.

XAUUSD CONFIRM ANALYSISDiscover an enticing selling opportunity in GOLD as it undergoes a critical retest of a key resistance area. With market analysis, tecnical indicators, and price action as your allies, evaluate the potential downside move. Stay vigilant and informed to capitalize on this precious metal's market dynamics

Unveiling MSUMI: Charting Paths to ProsperityEmbark on an insightful journey through the stock landscape of Motherson Sumi Wiring India Ltd (NSE: MSUMI). Our analysis at NEOALGO delves into the intricacies, spotlighting growth opportunities backed by compelling factors.
As we navigate MSUMI's trajectory, notable signals emerge, suggesting a potential upswing. From robust order blocks to strong upward signals and a discernible EMA crossing, the technical indicators align for an optimistic outlook.
However, a prudent approach is essential. NEOALGO is not SEBI registered, and while our analysis provides valuable insights, investors should conduct thorough research. Your profit or loss is your responsibility.
Stay informed, explore the growth potential of MSUMI, and trade strategically with our detailed analysis. 🚀📊 #MSUMI #StockAnalysis #GrowthOpportunities #TradeSmartly

Gold rejected but technical indicators point to higher levelsSummary: Gold was rejected once again at key resistance of 2,064. However, all indicators are suggesting higher Gold prices ahead. A close above this level will pave the road towards previous all-time high
Gold XAUUSD was yesterday rejected once again at the 2,064 resistance, and fell back below this 0.618 retracement.
However, the RSI still shows positive sentiment - if Gold can close above 2,064 and the RSI close back above the 60 threshold, there is short-term upside potential for Gold to 2,121 and previous all-time highs.
Further adding to the underlying bullish sentiment is that Gold trades above the Cloud, and above the 55, 100 and 200 DMA’s, which are all rising. Also, the 55 DMA has performed a Gold Cross on both the 100 and the 200 moving averages, underlining the underlying bullish trend
A close below 2K would confirm trend has turned bearish
Author: Kim Cramer Larsson, Technical Analyst, Saxo Bank
Disclaimer
The Saxo Bank Group entities each provide execution-only service and access to Analysis permitting a person to view and/or use content available on or via the website. This content is not intended to and does not change or expand on the execution-only service. Such access and use are at all times subject to (i) The Terms of Use; (ii) Full Disclaimer; (iii) The Risk Warning; (iv) the Rules of Engagement and (v) Notices applying to Saxo News & Research and/or its content in addition (where relevant) to the terms governing the use of hyperlinks on the website of a member of the Saxo Bank Group by which access to Saxo News & Research is gained. Such content is therefore provided as no more than information. In particular no advice is intended to be provided or to be relied on as provided nor endorsed by any Saxo Bank Group entity; nor is it to be construed as solicitation or an incentive provided to subscribe for or sell or purchase any financial instrument. All trading or investments you make must be pursuant to your own unprompted and informed self-directed decision. As such no Saxo Bank Group entity will have or be liable for any losses that you may sustain as a result of any investment decision made in reliance on information which is available on Saxo News & Research or as a result of the use of the Saxo News & Research. Orders given and trades effected are deemed intended to be given or effected for the account of the customer with the Saxo Bank Group entity operating in the jurisdiction in which the customer resides and/or with whom the customer opened and maintains his/her trading account. Saxo News & Research does not contain (and should not be construed as containing) financial, investment, tax or trading advice or advice of any sort offered, recommended or endorsed by Saxo Bank Group and should not be construed as a record of our trading prices, or as an offer, incentive or solicitation for the subscription, sale or purchase in any financial instrument. To the extent that any content is construed as investment research, you must note and accept that the content was not intended to and has not been prepared in accordance with legal requirements designed to promote the independence of investment research and as such, would be considered as a marketing communication under relevant laws.
