Search in ideas for "PLOT"
BTC Long ideaPlotted the channel last night before the breakout
Publishing this idea for my personal use only

TOTAL2 - Developing the Bottom Structure Plotting a bottom along the 4.618 of a strong downtrend Fib Circle
As you can see the price is moving along this thicker green line
I expect the second bottom to occur and consequently a double bottom occurring
Following this double bottom a rise is in order
This is a complementary post to the one below

ETHUSD Hourly AnalysisPlotting an Uptrend on ETHUSD between its two bottom points on this hourly timeframe
A small falling wedge can also be drawn on the current structure that is forming
This leads me to a short term bullish conclusion
I want to see it back to ~1600

SPX bearishPlotted 3EMA on a weekly chart. SPX might bottom between 2600 and 3000. Extreme volatile market ahead. Be careful with your investment decisions.
See my previous post..

plotting the fibonacci on Bittydivergence in hourly chart price is changing trend. the 1 hour chart target around 21.2k

Significant BITFINEXSHORTS tops and bottoms Plotted significant bitfinex shorts tops and bottoms, very ugly chart thus I hid it. I think the correlation is nicer with longs?

BTCUSDPlotted all the possible reversal points for BTC. All the horizontal lines represent the historically valid support zones in which price has been supported.
Historically, BTC has bounced off the 200 MA. Will we finally see the bottom of this bear market? That depends on the weekly candle close. But given that the 3rd MA touch coincides with the 21k support area, I do think we may see a relief rally or a consolidation in this area.

ETHUSD Middle Band TestPlotting an up channel using the middle trend as a top point for similar areas on ETHUSD chart
Similar points are in white rectangles
We are still going to the moon

LTCUSD - Litecoin Halving's Plotted on the chart in orange are LTCUSD's three and most relevant halving dates, with the third being yet to come until July 25 2023
The first halving and the third show similarities, in that they both are experiencing a bull move that will lead to a bull market before the halving
The first one took a long time to materialize however with a long period of low price volatility. I'm going to assume that a phase like this will be skipped on the third halving and bull action will come as the halving comes
This is purely due to the age of the coin
Right now is a great entry into LTCUSD

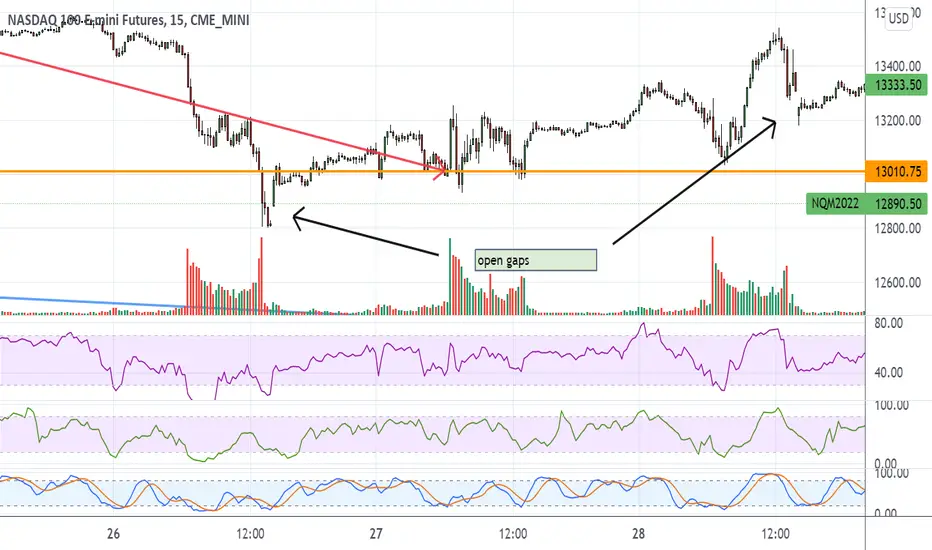
NQ 15 minute chart by requestPlotting 15 minute chart by request for someone who didn't see the gap.
I told you guys all futures gaps fill, it's not like daily indices, futures gap HAVE to fill. Notice both of the gaps pointed here filled already.
APD at breakout level: old industrial with dividends, 2022 hodlPlotted are three different fib series of 3 different waves.
It is the confluence zones that are of most interest to us.
Currently well below pre-Covid highs, so LOT of room up.
$ 232.22-233.28 is the KEY resistance to break and hold.
$ 246.02-247.32 is the next Minor resistance for first stop.
$ 266.64-271.73 is the MAJOR resistance for taking profit.

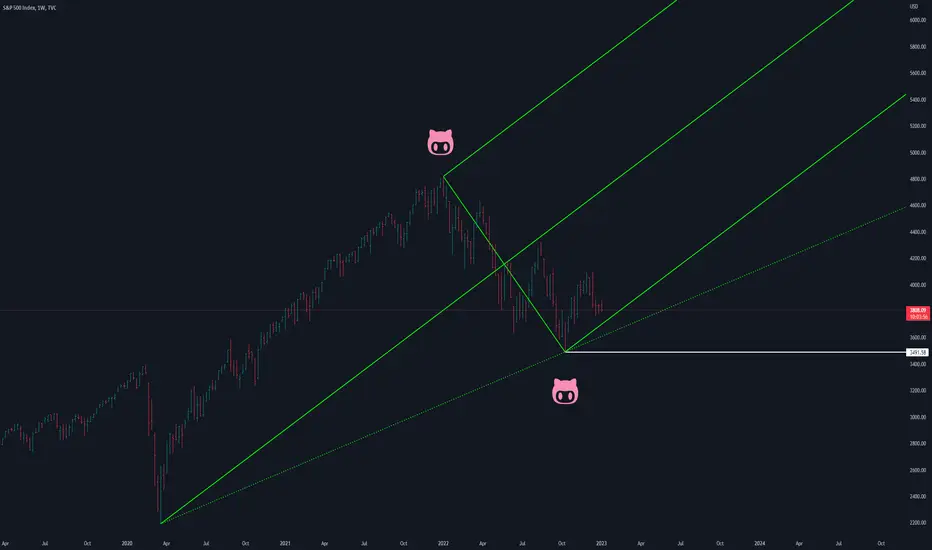
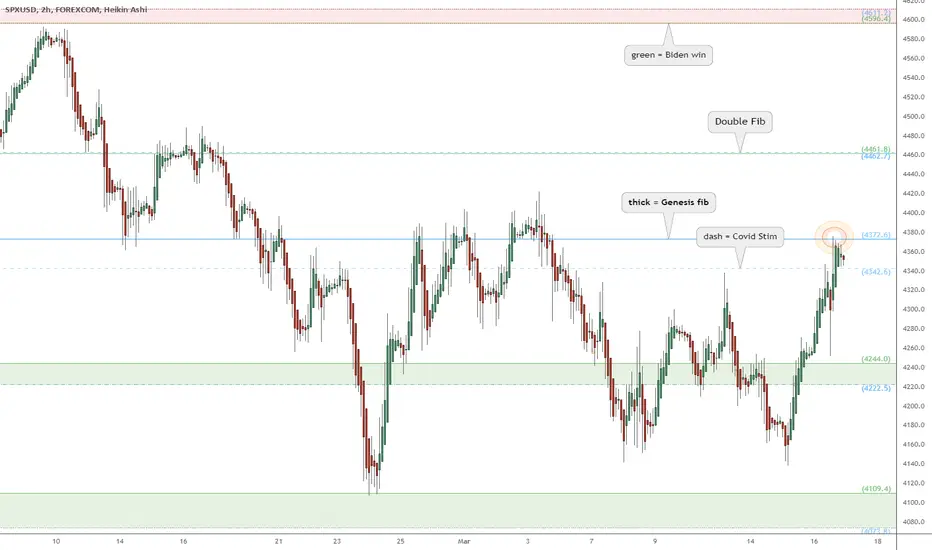
SP500 bottom in? Key levels defined by 3 waves: HOURLY viewPlotted are 3 different sets of Fibonacci Extensions.
Each fib is like a "ruler" calibrated to a specific wave.
Every level is relevant, especially the confluence zones.
4372.6 is the key level to break and hold as bottom marker.
4343.6 is immediate support that strong bull would hold.
4222-4224 is key support for bulls to defend as a higher low.
4073-4019 should have been the bottom and NOT be retested.
The origin of the above fibs are shown in this DAILY View (click) .
.
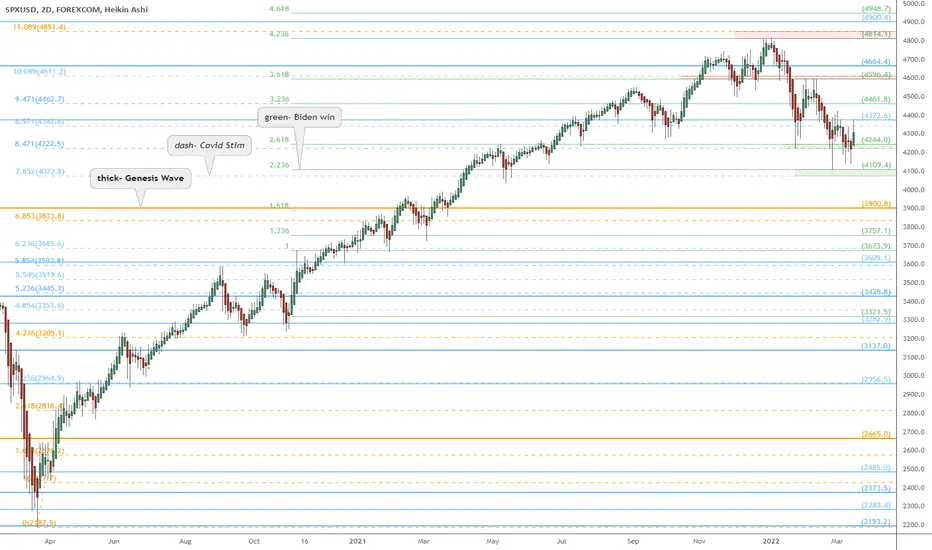
SP500 bottom in? Key levels defined by 3 waves: DAILY viewPlotted are 3 different sets of Fibonacci Extensions.
Each fib is like a "ruler" calibrated to a specific wave.
Every level is relevant, especially the confluence zones.
4372.6 is the key level to break and hold as bottom marker.
4343.6 is immediate support that strong bull would hold.
4222-4224 is key support for bulls to defend as a higher low.
4073-4019 should have been the bottom and NOT be retested.
For a closer look, check out this HOURLY view (click) .
.
CAD currency collapse timeline.Plotting a potential timeline for the CAD to collapse with a DXY going to 125. Looks like it may peak in the summer of next year. They may be forced to jack interest rates significantly at that stage, and makes the argument for a universal basic income, tied to a digital ID.
Short term ascending triangle would be the next structure to watch, with a measured move to 1.3657.

NET paints higher low into resistance: Clouds to Flare again ?Plotted here are 3 different fib series.
Confluence zones are of primary interest.
Possible higher low, now at early resistance.
$ 108.74-111.62 above is moderate resistance.
$ 116.50-117.97 is stronger and KEY resistance.
$ 98.24 - 102.29 below is strong DUAL support.
The primary (thick) fibs are from its Genesis Sequence:

DJI Short Term FibsPlotting short term fibs off of Dows $1000 day/leg of money, to get back to 27k/the 3.618 fibonacci line.

NVDA bounce at a KEY level: Golden Fib of its Genesis SequencePlotted here are two different Fibonacci extension sets.
Genesis fibs are from its inception, at first wave of buying.
Covid Stimulus fibs are from the bottom of the virus fear crash.
Golden Genesis fib at 263.81 is the CRITICAL threshold for the bounce.
If we hold that fib, we have a good shot at next Genesis fib at 302.18.
If we fall back below that fib, we will be at serious risk of lower lows.
Snapshot of today's price action on the 30 SECOND chart:
Even after such a long journey,
and violent retreat from up high,
all of humanity stops on a PENNY.
.
Here is a separate Idea with full view of the Genesis Sequence:
Use the "Make it Mine" option under SHARING to make your own copy.

Plotting Bitcoin PathBINANCE:BTCUSD idea for expected BTC path from Jan into Feb. Expecting the following:
Yellow path = Bounces soon then retraces once more to 39k
OR
Purple path = Sweep lows sooner with move up in late Jan

BTC ACTION REACTIONPlotted this in log using Babson method
Then switched to linear
This is going to waterfall
NOT TRADING ADVICE

Plotting the Future for the Altcoin MarketA continuation pattern of parabolas can be drawn
Leading to continual diminishing volatility
The first run was obvious the most bullish
The second (current) parabola will soon collapse into the next one, which I believe will reach an angle of 17° at peak
This is different to my other altcoin market analyses, it does seem more logical than the other, more bullish perspectives I have been throwing out..
For example below

Plotting How ETHUSD May EvolveTrying to find another parallel channel that conforms to a bear market
The current trend that has formed, (lighter grey with middle dotted) Is going to be major parallel channel in the future I suspect
However if we do see a fall it will fall into the darker grey channel, which is slightly more horizontal
There are multiple support lines along this trendline if it were to form

Plotting a SQ ShortSQ has started to downtrend and recently gave up a crucial level of support at 226. After breaking support, stop losses were triggered and shorts piled on creating a nice sell off to the low 200s. Since then we have seen a doji followed by a continuation candle (at the time of writing). I expect sq to retest the 226 level and to continue moving lower to the pink zone identified. That would mean a target between 195-200 with a stop loss above 226.
