MEWN?Plotting the future if this meme cycle plays out - targets could be way higher but meh - we might go down/sideways for a while before the fractal plays out though but not sure - end result should be quite good if things stay bull 2025.
Search in ideas for "PLOT"

BTCUSD - Endless BullrunPlotting a trend channel shift that allows BTC to continue a legendary run
This curve is something I have seen online and thought it hodls merit
Vertical lines are tops along the channel with some speculative bars patterns showing how price may continue up
This chart removes my doubt that BTC may crash as it allows continuation
Weekly timeframe


Plotting the decline in ratesplease approximate the next number in the following number sequence: 1187, 850, 455, 266
...
Therefore, the next number in the sequence might be approximately 163
falls in rates are happening faster and faster. forecasts.org predicting 2% rates by april in the 30Y with the drop starting in oct/nov


Bear Case...Plotting what I think may be the corrective bear targets - Structure wise it's difficult to say a bottom is currently in after retracing so much of our previous leg - hence why my bias has shifted thinking we have not finished correcting.

Is it difficult to make money in STI ?Plotting a line graph over this random 10 years period, we can see that if one invest money into the STI, he made a loss of around 26% (if he sells out but breaks even at best if he holds till now).
Conversely, in the same time frame of 10 years, if he would diversify into US and invest in the SPX index (as often encouraged by legendary investor, Warren Buffett), he would make a good profits of 171% profits or roughly 17% per year.
However, it is not really fair to compare this two index since the composition of companies are very different plus the market cap of each index is also worlds apart. Not forgetting the liquidity component.
As such, the devils is in the details and that is where investors spend time researching individual company and look for hidden gem. Companies such as DBS ,dividends rich companies like REITS such as AIMS ,etc.
Each market is unique on its own and being a local here in SG offers benefits of researching into banks like DBS, OCBC where one can go on site and see and feel for himself. Same things for REITS where one can visits the malls, office buildings , industrial parks, etc to have a feel of the business and footfall.
Investing in US on the other hand is totally different since most research is done online and whatever is published has to be taken on its own merits.
In a world of uncertainty, one cannot put all his eggs into one basket and thus diversification is crucial to one's investment portfolio from geographical regions to sectors to asset classes. Of course, your investment capital plays a huge part since it is futile to spread too thin just for diversification purposes.
That brings the question of having multiple sources of income and adhere to savings components (not lottery or casino wins) to assure recurring income that you can use to reinvest into the market when opportunity avails itself.

ETH to $2750 Plotted on this chart is same as BTC chart. some alts ha already seen this retracement, another previos high not tested, 2750 intersects trend and the retest, may just be a one quick wic,k place limit orders with stop loss, may be a last chance dip

Log Plot...Plotting this under the assumption that we've just started wave 3 and are correcting the first leg - I know the targets look crazy but they're not as unrealistic as some may think...Remember Doge had 100bil~ in it last cycle and that was on ETH where gas fees cost heaps - the barrier to entry has been removed with Solana meme coins as fees are so low allowing everyone to be able to participate.

ICPUSDT - Complete Reversal IdeaPlotting theoretical movements out of the long degen bear run and using the current bull structure to its full advantage
A full recovery
AI coins are promising in this environment

thrust wave ideaplotting the weekly chart using closing prices for sp500.
the thrust wave requires a triangle... where would that locate?

Plotting out NNDM Time Line With Abbot Cooper InvestigationI charted out the dates (vertical blue lines) with what was mentioned in the article announcing Abbot Cooper investigation. I have NNDM and SSYS stock price included in the chart with notes. Hope everyone can read.
NNDM price is the candles. SSYS price is the bars.
I want to point out, if you follow NNDM forum on reddit, Stern purchased a month before I called out a possible markup phase incoming. He sold right around the time I called for a pullback cause NNDM was in an ascending wedge and bulls looked to be getting exhausted.

ETH Trend Line CRAZYPlotted a trend line with a possible low for Ethereum. Just CRAZY, as Carl from the Moon says... EXAAAACTLY...LOL

Plotting potential movements with APFs and EWTWatch closely as the price is developing our wave 4 now, with a very thin price gap to validate a potential bearish Gartley pattern at the same time invalidating our wave 4 of the 5-3 pattern.
Take note that the Wave 5 (as long it is still valid) could potentially complete our bearish APFs such Bat and Gartley/Modified Gartley patterns.
Note: See reference (related ideas) for the previous bearish deep crab pattern setup.
Trade with care. Plan your trade and trade your plan


BTCUSD - Three UpPlotting a strong trend line with the fib speed resistance fan.
I expect another wave up in green oval to take BTCUSD to 700K

ETHUSD - Top Cap Indicator ParabolicPlotting a parabolic rally that BTCUSD undertook in 2017 on ETHUSD
I feel that ETH will rally very hard next bull run due to the presence of NFT's and the expanding ecosystem
20K+ is possible

HDFCBANK 4h SMC HomeworkPlotting SMC Structure in HDFCBANK 4h
few confusions to be cleared in next discussion

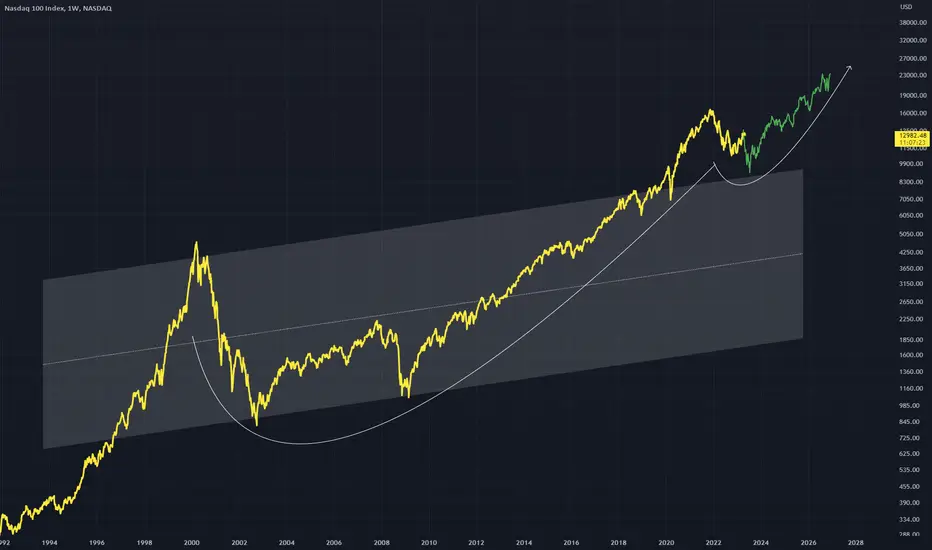
NDX - Cup and Handle Recovery Plotted and Up Channel on NDX that i think the top of will act as support for price.
A curved trend and handle can be drawn on chart, the components of a cup and handle structure.
Ill link some of my other analyses for NDX below
USD Liquidity vs S&P vs BTC - Liquidity Leads AssetsPlotting USD Liquidity for the past 5 years versus the S&P and Bitcoin. Made twitter-famous by Raoul Pal and Arthur Hayes. As we can see in the chart, liquidity is tightly correlated with the S&P and also drives Bitcoin cycles.
Liquidity looks to lead price movements in both assets classes.
Question for the community: How can we best forecast moves in USD liquidity?

Short Front Test: BTCPlotted support and resistance in 4h and 1h. Saw a pattern in 15 m time frame, waiting for candles to close in 15m. Used also Fib extension to check key levels for entry, tp, and sl. Could target the .3 percent movement basing from the pattern and the support. Rsi also showing weakness in price.

Short Front Test: BTCPlotted support, and pattern for the price action. Still follows the major descending channel, and created a descending triangle. Looking at the RSI 1 HR it is creating higher high, but in the price action its creating lower highs which is a bearish divergence. Charted the Fib tool in 4 HR TF, and checked OB 15 MIN for entry and targeted the price level in Fib.
