EURJPY |DECRYPTERS |FORECASTHi people welcome to team Decrypters
we are Expecting a short term push toward Upside in EURJPY
Search in ideas for "TRADINGVIEWS"

What the Future Holds for the S&P 500 in 2023 ES1!I have been trading the E-mini S&P 500 since 1998 so I have traded through several Bear Markets and there is a theme to them and how they end. In this video I go over the bear markets in the Dot Com Bubble and the Global Financial Crisis and compare them to this recent Bear Market. I share how I use a weekly chart with a 52 week moving average and an RSI to determine how a bear market will end. I explain why the first trading day and first trading week of the year are the most important days of the year and why traders should use TradingViews auto anchored vwap on the first day of the year to guide you for market direction throughout the rest of the trading year.
This is not Financial Advice. Past Performance is not indicative of future results. Derivatives trading is not suitable for all investors.

Global SPY at Major Battle ZoneTons of fundamentals will be pouring in for the next few days. Feel free to review them at dailyfx calender.
4H chart showing there is bullish divergence building on some of tradingviews free to use indicators.
But there is now bear divergence building as well. This pinches the price into symmetrical wedge.
Fundamentals will most likely dictate the move. Sad part is that there are literally 4-5 days of back to back high rated fundamentals to decide. I'm neutral here. And will patiently wait for a confirmation.
Good luck and hope you find the right side as early as possible!

Coffee Bear flags. Reversals.11.21.22. First: Tradingviews discount offer is a fabulous offer. My advice is get the premium version and you're paying less than a dollar a day. And you really want the premium version! I used to Gift To one of my students since she's been my friend for over 40 years, and it's the reason why I started to show my charts on tradingview. The tradingview wouldn't let me do that last year, so I send money to my friend and tell her the check is on the way. But if they allow me to do this, I would have subscribed for two young men that are going to follow trading with me for a month or so, and I would have bought it for them. It's a great deal, even if tradingview doesn't want to do business with Santa Claus. This video is on coffee I was looking for a long trade to be triggered. It might have happened today, I'm not sure. I need to clarify something that I said in the video: I never short barre class. What I should have said: If I get long on a buying till add support, and the market goes higher, but then starts to go lower, and looks like it's going to turn into a bear flag, I might get out of my long trait before it hits my stop. That's what I should have said. What I did say and believe: I don't look at a fair flag so much as a bearish market, I look at it as a manifestation of buyers looking for the reversal, but they're just a little too early and they did have the right idea because markets that have bear flags are an early signal that the market may very well find a support and then give you a great Long trade In the near future.
In other Buyers who get caught in a bear flag, had the right idea, but are just a little too early.

ES weekly forecast - Beginning of TST journey Hello everyone! This October I begin my TopStepTrader Micro combine! TradingView is my documentation system so Like and Follow my journey!
ES has maintained its down trending posture and lending way to lower prices but currently exists in a somewhat balanced state between technical levels 3700 and 3500. This area could prove to be difficult, so I’m not particularly excited about the week ahead -
SHORT TRADES ONLY given the context of the downtrend!
1 - Breakdown of 3600 with a pullback to retest before moving lower to 3500
2 - Straight down - If ES moves below 3500 with conviction, we could see lower prices in a hurry. I’ll be looking for sharp bounces to short in this scenario/.
3 - Bullish move to 3700 and consolidation to begin accepting higher price
Last week gave us a decent short opportunity Wednesday. Be on the lookout for others in the middle of this week, although it’s unlikely they are as technically ‘juicy’.
Waiting on TradingViews BlackFriday deals to optimize charting. Stay tuned!
KingCharlesTrader - 10 years as ES swing trader by night. Web Developer by day.

xauusd,m15trendlines , best trade mthode
but we cant But we cannot predict the future
That's why we use stop loss

Bolinger Bands + EMA added to SSL = !!!So I've been using a few Bolinger + EMA indicators and SSL Hybrid/Non for a while now. No specific one, as there are quite a few versions available from TradingViews list of resources. Today I just happened to decide to see what would happen if I combined these indicators and do some strategy testing and play around with a few settings... well, here's the outcome. So far I've noticed better results on 1hour charts but this is just with LTCUSD (just happened to be on this chart when I started doing this so theres no specific reason I chose LTC)
From what I can see though, if you select the SSL Baseline as the strategies main resource for it's calculations from the strategies settings, it's pretty difficult to get a negative result... making this a rather easily profitable blend of indicators combined into 1 neat strategy with few settings have to mess with.
Let me know what you think and if this has been done in another strategy or indicator set that I don't know of yet?

$19,065 on September 18th? VIX Cheat sheetHello my dear trader friends,
The VIX Cheat sheet indicator on tradingviews works when the bollinger bands indicator for "VIX" are at the very top. When this happens the VIX Cheat sheet indicator works at its finest. Now is the time that the bollinger bands are at the very top on the VIX chart. So when we use the VIX cheat sheet indicator on bitcoin we can see what percentage numbers of gain or loses will occur. As of right now it says the greatest loss that will happen over the next five days would be a 5.95% loss over the next five candles. This means that the greatest loss that could happen ending on September 18th would be Bitcoin going down to $19,065. The VIX cheat sheet indicator does say that over the next ten candles there will be a 1.34% increase in price. So if you take the price of what Bitcoin is right now ($20,265) and add 1.34% to it that would be $20,535. So this might possibly mean that we go down to $19,065 within five days and up to $20,535 within ten days.
Please have a look for yourself and let me know what you think. Does anyone else use the VIX cheat sheet indicator? I am a student of trading and for a decade I have been learning old and new indicators. It is my passion.

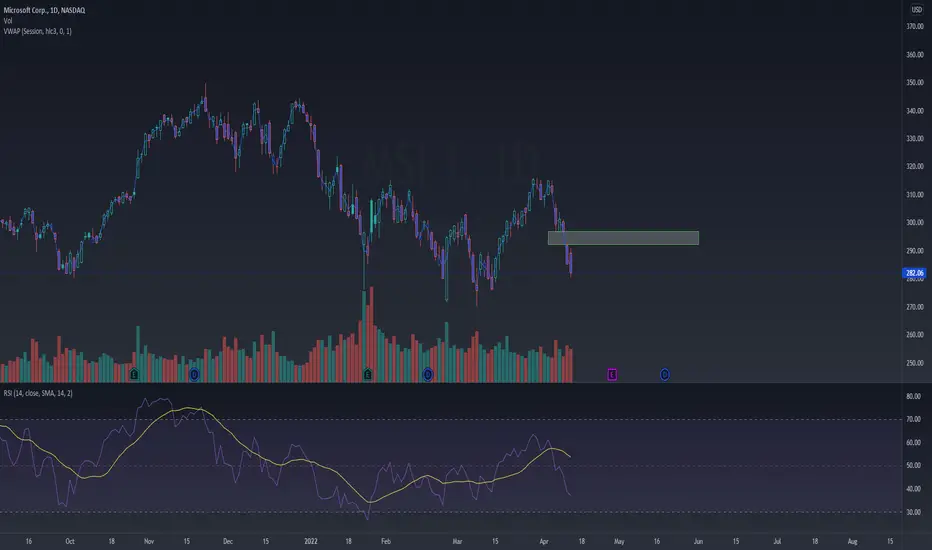
MSFT: Quant Analysis and Targets MSFT currently rests almost 20% off from its ATH that it reached in November of last year. It has generally been falling with the market in this larger market wide sell-off. There is also an overhead gap starting at around the 293 range. There is also some potential descending support from a trendline that MSFT may come in contact with, resting around the 270s range. (See chart below).
Is now the time to buy/long MSFT?
Maybe, actually! Let's look at the quant details. Advance notice, this analysis is done 100% based on math and statistics and thus, the most pivotal charts will be the linear graphs I will display below.
First, let us take a look at how MSFT has traded since its nascence in the 80s (chart below):
MSFT started with some great growth at its nasence, followed by a period of pull-back and negative growth spanning roughly from 2000 till 2002, AKA tech bubble burst.
It then began regaining momentum only to be met with some more catastrophe. The 2008 recession. We see this circled in red and it spanned roughly from day 3,000 till day 5000 (December 2007 through till end of 2008).
At about trading day 6,000, which was exactly December 23rd, 2009, SPY had sustainable and fairly regular growth. In fact, between December 2009 and December 2019, MSFT's annualized return rate was just over 17%, with a percent return of 417%. Not abnormal for a growth stock, but definitely outperforming the market.
We see true exponential growth on MSFT around day 8,000, which is December 4th, 2017, where this growth continues until recently when we have had this pull back. SO let us look at MSFT using TradingViews regression tool on the monthly time frame:
It looks overly extended, right?
Well, no! Actually, no. So this is where it gets interesting/tricky. There is generally no argument that stocks underwent massive inflation during QE. However, MSFT was already growing exponentially since 2017, WAY before QE. Furthermore, MSFT has consistently outperformed the market POST 2010. So, we have to be very careful in setting bearish targets here and in assessing what exactly constitutes sizeable pullback.
If we filter out the noise of the tech bubble crash and the 2008 recession, and include all data on MSFT from 2017 until today, this is what the chart looks like:
Have you ever seen anything more beautiful? As a statistician, this is a piece of art right here. LOL!
You can see, MSFT was already in a healthy uptrend WAY before QE. QE exacerbated it but during this years bear run, we saw pull back, back to the linear mean followed by a return to its normal range.
The reality is, the correction on MSFT is over. It is corrected. It is now trading within its predicted behaviour based on 2017 to current day data.
The range that this chart predicted for this week was 275 - 295. We have been trading in this range.
Now I say MSFT has corrected and I actually truly mean this. MSFT has mathematically corrected. It has. You may be bearish on this, you may think this is going to sell off more, and yes, its all extremely possible. But as far as math is concerned, MSFT has officially corrected and regressed back to its normal trading range.
Now, you may say "WOOP WOOP YOLO LONG BABY!", but the million dollar question is this:
Are we actually going into a bear market?
Because you see, MSFT is not immune to catastrophe. We saw sustained selling during the tech bubble pop and we saw sustained selling during the 2008 crises. Now, unfortunately MSFT wasn't a thing in the 70s and neither were tech stocks, so I cannot compare how those fared during inflationary periods. However, we need to really think whether or not its over and we can resume our way.
Based on my analysis (which I did as a previous post), inflation DOES NOT halt growth of stocks. It doesn't. I will link this post below. I have run the numbers, so I am skeptical if someone argues "inflation will cause this to decline", because I just didn't see that in running the numbers in my little study. But we need to think about how the global and economic circumstances may affect this stock.
My opinion? Inflation and war are the only things that are concerning right now. And based on my own analyses of inflation and war (which, again, I did a post about for your information), they just don't hurt the market like people think. So I am actually kind of bullish here.
So, ideal entry?
Ideal entry would be 275 because that is the minimum value this model predicts MSFT to be trading in for this week. I think fair entry would be 275 to 280. It predicts MSFT to see the 300s again in just over a month. Could be sooner depending on the conviction from the bulls. But I anticipate SPY to continue to sell off down to at least the 400s again, and you can bet that MSFT is not going to be overly immune to this. This is my only reservation here.
Otherwise, QQQ has also regressed back to its normal trading range and I think tech in general is looking fairly neutral right now. We could also just see a period of consolidation and bouncing around in these lower end ranges for a while, while SPY does its thing. I don't know. Either way, I am actually bullish on this stock and I am inclined to take a long swing position around 280 - 275 if I see it.
I also want to cavet that even if we are entering a bear market, this isn't going to go straight down. There is a time and place for going long and going short, even within bullish markets and bearish markets. So I am still inclined to be long biased at this particular point in time, regardless.
NOT FINANCIAL ADVICE!
Trade your own plan and plan your own trades.
This is strictly informational!
I am not a Technical analyst, economist or finance person. I am just a statistics guy that likes to run numbers.
Use this information at your own risk and at the risk of your wallet either overflowing with money or declaring bankruptcy.
Let me know your comments, questions and criticisms below!
QQQ: Outlook I have been neglecting QQQ lately in favour of SPY and DIA. I just am getting sick of the huge volatility in both SPY and QQQ and leaning more towards DIA as my go to stock, but I thought I would look to see how QQQ is coming along and see if we can plot out its outlook.
So currently, QQQ is in a downtrend, obviously. The one hour chart is really messy. To some it may show that QQQ is undecided. To me, it seems like a war between the bears and the bulls. QQQ wants to go up, but it doesn't have sizeable long biased backing. And ultimately, QQQ will likely be heading down.
But let's take a look at why this is, because QQQ is at a very interesting stage in its trading life that is kind of exciting IMO. But before we get into that, let's take a brief look at the technicals.
QQQ Technicals:
The technicals are summarized in that chart, but just to go over it, here is the summary in detail:
Below critical MAs: on the 1 hour, it is below the 50, 100 and 200 MA. I don't believe in MA fishing and comparing multiple MAs or EMAs, because eventually you will find what you are looking for and succumb to confirmation bias. Thus, on the rare occurrences I will look at MAs, it is always ONLY the 50, 100 and 200 as those are widely used and accepted.
RSI Neutral: RSI is currently neutral. There is room for movement in either direction. No conclusions can be drawn off of this.
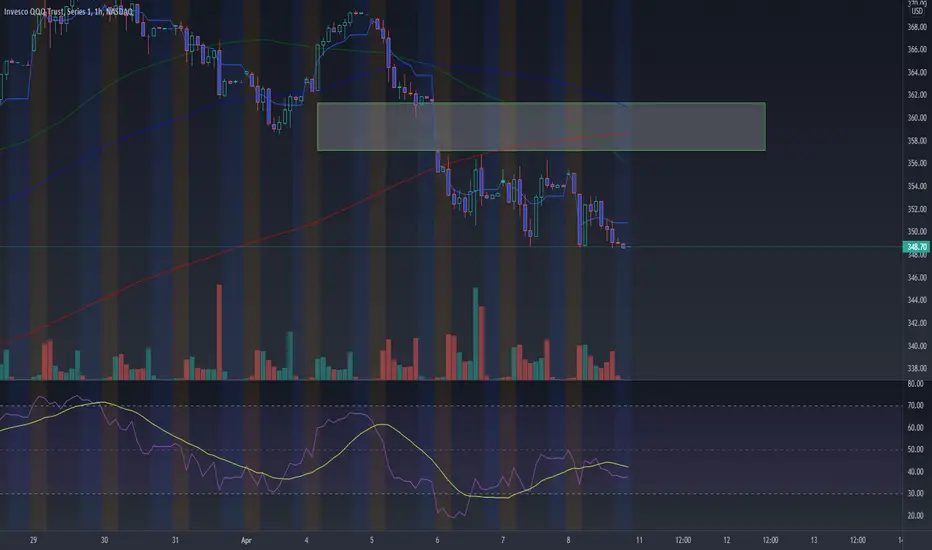
Finding support at 348.70: QQQ is finding support at this level. This is interesting as this has been the bottom out range that my projections have calculated over the past week. So I find this very curious that it is respecting this bottom out range! I am consistently shocked at the results of these calculations when I see how they play out in real life lol.
QQQ's chart pattern is telling on the daily. The 1 hour chart is kind of messy. I have plotted the following. Please note, that I am not sure if this is a charting technique applied by many. I have used it in the past. However, I trade 95% math and 5% chart patterns so at the end of the end of the day, the patterns are generally irrelevant to me:
However, here is the telling tale, IMO:
We see here that QQQ is repeating the same pattern it has previously. This pattern is, I don't know, I call it the bird pattern but I am not sure what this is really, I just know its bearish. We see it lead to a sustained sell off previously, and now that we are repeating it, we can anticipate more to come.
The Math:
So QQQ has been making mad progress towards its reversion to the mean. To the point where its almost there!
As it stands now, we can expect to test around 341 next week. Once we hit this level, QQQ will be back within its normal trading parameters.
Now I know what you may be thinking. If you apply the linear regression tool on tradingview it still looks quite overdone. (See below an example, QQQ charted over the monthly time frame):
But the reason for that is because QQQ and most stocks are not linear in nature. They are actually more quadratic. And quadratic lines are curved and not straight. You can actually see this very clearly on QQQ's chart just by looking at the monthly:
So, what does this all mean in terms of math predictions? Well, what it means is:
1) QQQ will likely test 341 this week. Probably lower, but 341 is in the forecast.
2) Once QQQ tests the 341 range, QQQ will be trading within the parameters of a reversion to the mean. That means, we may see some consolidation and some bouncing around a bit more.
3) Generally, when stocks revert to the mean, they overshoot it a bit. So we can expect further selling off below this range. This may not happen aggressively and judging by the current market sentiment, it may slowly bleed out over the next couple of months, but it could happen aggressively. Its up in the air. But in general, I do expect this to fall below its mean by at least 5 to 10%.
I can show you an example of another stock that is quadratic and how it looks on the regression tool. That stock is SPX!
Now, as pull back happens and then stock continues, you will now that tradingviews regression tool expands in size to accommodate the fact that the stock did not retest a "linear mean". So it can be very misleading using that regression tool if you don't have a sold understanding of what exactly you are looking at. So be careful!
Anyway, that is my deep dive analysis into QQQ.
I will give you your ranges for Monday:
Trading Range: 344 - 353
Bullish Break: Over 352
Bearish Break: Under 346
That's it! Let me know your comments, questions and criticisms below!
Enjoy the rest of your weekend!!
QQQ & SPY High & Low Predictions Hey everyone!
As I do with trading, I do with life. I am violating my rules (I told myself no stock market this weekend) and posting.
I just wanted to gauge interest in anyone who is interested in beta testing indicators I have developed.
I have applied some simple calculations in my models as indicators on tradingviews pinescript. I just want to share the results with you and will be offering its use to people interested to beta test.
If the results go well, then I would be open to making it public.
The issue with this type of indicator is it requires constant maintenance by the publisher (me) as it is contingent on broader data that I analyze and disseminate myself. Thus, I am not sure how this will look going forward, but if there is a lot of interest I would be open to keeping this project very much alive!
I just want to share with you some of the results thus far and how to properly use the indicator.
At the end, if you are interested in beta testing, I will leave some information on what to do :-)!
Results and How to Use:
The indicator presents a moving target for high and lows. However, the point is to not look at the moving target, but to look at specific points in QQQ's trading day. These points are the Peaks of the highs and lows.
So to gauge the high of QQQ, you will look the the most recent lowest peak (see imagine below):
And vice versa for gauging the low of QQQ (see below)
And because stocks aren't static, you constantly adjust to the newest lows and peaks (see below):
And some results from SPY:
And to really make this helpful, overlay it (this was a suggestion by a user) and you can quickly chart your targets by drawing a straight line from the dip and peak points (see below):
So if you are interested in trying this out, please let me know!
I have posted one script already and just reviewing and finalizing the SPY one.
Please understand that this would be beta testing to see if this is even helpful for people. As such, I would like to limit access to roughly 10 people because I also would like feedback on how it is working for you, if it is helpful, etc. etc. etc. so that I may make some improvements with the eventual goal to make this available to others.
As always, trade safe and enjoy the rest of your weekend!

ADA possibly good buy. I think this is good advice.ADA, buy it? I am going to nibble. It is relatively low. I am typing more words to reach tradingviews desired character amount, not to confuse you.

Using 3-day 21-period EMA, TEMA interaction with ETHEThis is another example of how I am using an interaction between a 21-period EMA and TradingViews' Triple EMA (TEMA) to identify trending direction. I have my chart set at 3-day as that is about how long it takes to settle those investments.
Unless we have a reversal soon and subsequent move to the downside as with last year, we are headed towards a crossover going up TradingView (built-in) Triple EMA (blue line) over the 3-day 21-period EMA (red line). I am using daily pull-backs to DCA when the trend is going up.
Also shown on this chart is volume and CCI for context.

H&S BTCHello to tradingviews
If Bitcoin can break the neckline of the head and shoulders pattern , and according to the previous analysis, it is more likely to fall .
Up to about 30k price
Thanks


Long position dogeHello tradingviews
If the daily candle is closed above 0.33
It is very likely that the price will move up to $ 1.3
Because the price closes above MAs9 and the channel midlin e
what do you think? Please comment

GOLD SELL IDEA On my MT4 chart, price has gone back into my channel on the 4H timeframe. But not on tradingviews channel. So I'm going to take a risk and go with MT4.

Footlocker Put Long FL has a D/E of 0.00 (macrotrends) and a C/R of 1.73 (macrotrends). My analysis shows a long term down trend in a solid looking channel. Down trends of same or very close lengths -49-50 on tradingviews ruler function. Equally, the uptrend show the same at around +39. Now unless FL breaks out of this long down trend imo its set to continue as normal back down to around $17 possibly abit lower. Covid19 seems to have not harmed FL much with Free Cash Flow up 76% on the previous year and an intrinsic value per share of $48 per share (in my opinion).


BTCUSD CorrectionMajor correction needed on BTCUSD. It can't just keep going up like a vertical line. Lol. I will expect BTCUSD to sell back to area E for form the Lower Low, retest on the Support Zone and the trendline before buying up again.

MONEY SUPPLY AND VELOCITY NEED TO WORK TOGETHER TO GET INFLATION
Inflation rate timeline because TradingViews does not have this data. Feel free to verify on your end and let me know what you think.
------
Inflation Rate: 1972, 3.27% increases to 1981, 13.55%
Inflation Rate: 1986, 1.90% increases to 1990, 5.40%
Inflation Rate Peaks in 2008 at 3.84%
M1 and M2V both rise in 2009 - 2011, Inflation Rate increases from -0.36% to 3.16%.
--------
Inflation is still very possible but we need to see M1 and M2V work in unison. We see in 2009 to 2011 M1 and M2V both go up and Inflation follows.
The theory behind this is: Inflation cannot occur if Money does not get transferred from M1 to the real economy to affect prices of production and consumption. Part of the problem is that the 1% are taking in a very large majority of that M1 money supply. The 99% of people who actually spend money are never given access to the money that is created. It is being hodled by banks who, think it is too risky to lend. In Venezuela, the velocity is very high because people need to spend their money before it gets devalued, in the US we see people saving...
NO INFLATION UNTIL DEMAND RETURNS, ONCE DEMAND RETURNS , INFLATION WILL COME BACK WITH A VENGENCE.
if you believe the cpi, m2v, m1 and other data provided by the US government is false then, what data is correct? and whats the difference.

IROBOT CORP OpportunityHey tradingviews community, IROBOT CORP is in a bullish composition with low past purchase volume and a kind of hammer candle. The TIMEFRAME M1 shows a marubozu with a low buy traded it goes on the base of the bollinger to test it. Then go to its highest in order to go to the top of the range to test it again. It is very plausible to breakout the price at the same time with the momentum ranges it to reach in the next and to reach the high which follows (See the TIMEFRAME H4). Before filling a bearish breakout gap then (the TIMEFRAME H1) before the adjustment (of the TIMEFRAME H1) with the next high point on breakout after a range. No craze at the sight of carriers to test half of the middle median of the ANDREWS PITCHFORK range.
Please LIKE & FOLLOW, thank you!

Bitcoin Crashing?! Not so fast bears..Greetings fellow chartists, bulls and yes even bears too. Today I present to you what i believe to be the path that bitcoin will follow in the coming weeks.
If we look back to the start of november this is when a new uptrend started as indicated by the green line from Tradingviews "Supertrend indicator" I've mapped out the Elliot impulse waves into 5 waves the 5th ending at the start of Decemeber right around the 199xx level.
The resolution of the the elliot impulse waves has left us with the formation of a Bullish Pennant (some identify this as a symmetrical triangle but I do not). Typically in technical analysis a Bullish Pennant when resolved leads to further upside in regards to price action and this is my expection in the coming days, if correct this will lead Bitcoin into new All Time Highs.
couple of bullish situations.
1. Supertrend uptrend is still maintened as long as bitcoin hold the pennant as support.
2. Hash ribbons indicator flashed a buy signal just days ago
your friend
-Mystic
