ADA bearish flag in short-term#ADA/USDT
$ADA shaped ascending channel and price is between the middle line and lower line.
🐻 this channel can act as a bearish flag pattern and possible drop price toward long-term support zone around $0.41 which is the same with the broken line of the falling wedge.
🐻🐮 if price holds the support zone then possible to head up again to shape an inverted head and shoulders.
Search in ideas for "ada"

ADA going up ADA has had a strong retrace into a doji,
Price is levelling off at key fib level and price may bounce from here.
Oversold stochastic confirms bullish signals.


ADA games startedAda put herself in a difficult process. Region 5156 is in strong support for the island because 2 support points were in joint protection. However, the island broke the support and now entered the key area. Area 5156 is currently the barrier to the island. Btc reaction may take the island to the 5156 region, but as long as spx does not close above 4300 and btc closes above 23500, the island will continue to be stuck between 5156-4904. It has turned into a risky position that requires maximum attention in closings under 4904.

ADA(W) ElliottADA(W) Elliott
Cardano made his main wave 1 in the weekly time frame with 5 micro-waves and is now completing his main wave 2.
Wave 2 also has a micro-wave movement of 5 waves, which can be seen more accurately in the lower time frames.

Ada trying to break down the $0.56 support lineAda's correcting. its potential bearish targets have been shown on the chart.:
a zone ranged from $0.53 to $0.54 and
in case of losing this zone, the strong support line of $0.52 is one view
I appreciate your support in any form such as sharing my ideas with others on social medias, leaving kind and heartwarming comments, donation, and etc.
If you showed your support from me by donating, please feel free to get in touch with me so I can get to appreciate you personally ❤️️

ADA bullish signal. Potential gain of 114% !! 🚀🚀ADA Bullish case:
1. Bull Supertrend Ninja - Clean signals (green vertical line on the background).
2. Ascending Triangle (pink lines)
3. Breakout Ichimoku imminent
4. RSI Bullish zone, at the edge of breaking out of the ranging zone
5. ADX Bullish zone and DI+ upwards pointing
6. RSI Higher high, higher lows
7. Price Higher high, higher lows
8. Price above BB: Basis
9. Price above LSMA
Potential gain (orange price range) of 114% to 1.15 USD forming Leg A of the Elliot Wave. Let the GAINS begin !!
Supports and resistances are highlighted in grey blocks. Remember to always take profits and use proper risk management!
Thank you for reading.
Namasté 🙏
Disclaimer: Ideas are for entertainment purposes only. Not financial advice. Your own due diligence is highly advised before entering trades. Past performance is no guarantee of future returns.
What Indicators Do I Like To Use:
I am using the "Supertrend Ninja - Clean", which is a trend-following indicator (Green and red vertical lines on the background). When the background of the candlestick closes green (vertical line). It indicates a possible bullish (up)trend. And red for possible downtrends.

ADA LONGADA broke out of the trendline. However, we must be mindful with a potential retest if the minor level of the 38% Fib level is broken, we have a high probaility of price heading to the retest level which puts price around the .786 region of the fibs.
Targets is the measurment of the Impulse leg using Fib Extension.
If there is no retest, price can break out of the consolidated area and head to targets.

ada long term buy setup ada long term buy setup for long term break wall area in dialy time frame ...ada long term buy setup

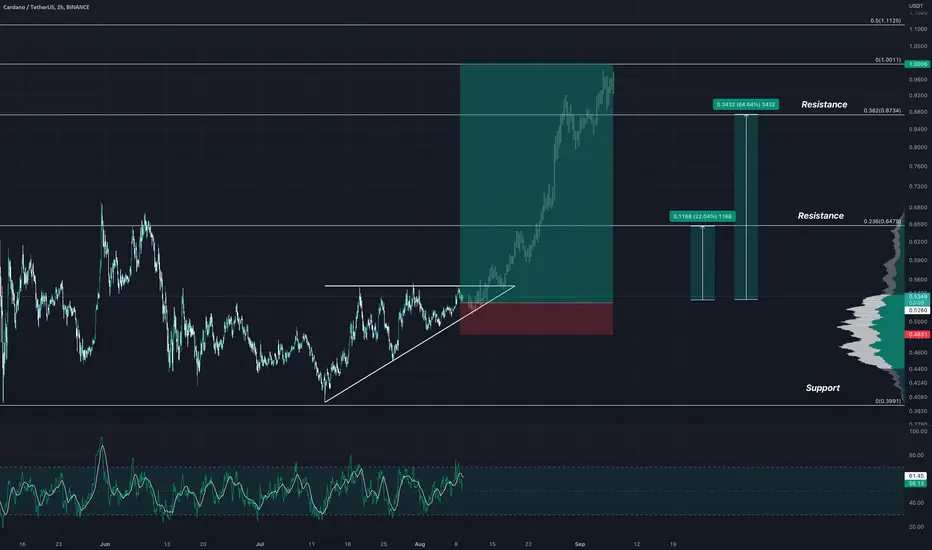
ADA Cardano bullish pattern! Forecast#ADA
▪️Deadline for the deal is 14 days.
▪️Cardano forms a triangle with a flat top - we all already know how this works out
Current price:
0.5317$
Targets:
0.6475$ +22.04%
0.8734$ +64.64%
Subscribe and stay tuned for new ideas. Every day I post 10 profitable ideas a day.
ADA above support#ADA/USDT
$ADA broke out descending trend line, and now in pullback touched the broken line that is the same with support zone and ascending support.
🐮 holding the current support zone can increase the price to break out of the wedge and reach the resistance zone.
🐻 break down from the support zone will drop the price to the lower line of the wedge.

ADA break up patter 3.75M coins as supportADA break up patter 3.75M coins at $0.5220 as support
potential reward in 4 times bigger

ADA / Cardano - Shorting Opportunity coming ?!ADA looks very bearish, if a breakdown happens in the next few hours, I'm gonna take it.
We may have to take 1-2 entries if a fake breakdown happens at first. But do wait for a proper pattern on each and every entry, and market will bless you with reward ✌

ADA Bullish 50% Set-Up!!!ADA is currently still trading close to the bottom of its range. When this coin decides to get bullish , a 50% gain can and I think will follow to the top of the range as long as BTC continues its bullish momentum. ETH seems to be the one leading this current rally. IMO this is a great entry price for ADA.
Every day the charts provide new information. You have to adjust or get REKT.
Love it or hate it, hit that thumbs up and share your thoughts below!
Don't trade with what you're not willing to lose. Safe Trading, Calculate Your Risk/Reward & Collect!
This is not financial advice. This is for educational purposes only.

ADA broke out falling wedge#ADA/USDT
$ADA broke out from falling wedge pattern, and hold above long term support zone.
🐮 so at least it will fly to 0.236 fib level around $1 and possible to touch 0.5 fib level in long term.

ADA trend lines and fib levels#ADA/USDT
$ADA weekly trend line and fibonacci levels.
price is above 1.272 fib level of last weekly swing high, last support will be 1.414 fib level at $0.158.
and you can see the support levels in between.
this will be the last support zone that price should hold it so we are mostly near the bottom.
there is a green descending resistance that break out from this will be the start on new rally but pullback to this line will be around $0.1587 so don't rush to buy yet.


ADA bearish flag inside falling wedge#ADA/USDT
$ADA rejected from upper line of falling wedge and shaped a bearish flag pattern in lower time frame.
🐻 break down from lower line of channel that can act as bearish flag, will drop price to lower line of wedge that is the same with support zone.
🐮 holding the lower line of channel may help bulls attempt another try to breaking the upper line of wedge.

ADA/USDT BUYING SETUP (SWING)ADA Big massive news , Breakout symmetrical triangle at 4h time frame we can entry now or waiting for retesting first at 4H timeframe
Buy zone : 0.635 - 0.59 - 0.55
Target : 0.6894 - 0.7472 - 0.8162 - 0.9 - 1
Stop : 0.525

ADA falling wedge#ADA/USDT
$ADA is below upper line of falling wedge pattern.
🐮 break out from resistance of upper line of this pattern can increase price toward resistance zone between $1.6 and $1.86. in this way price should break out resistance of $0.7 and $1.1.
🐻 rejection from upper line will drop price to lower line once again that is around support zone between $0.4 and $0.27


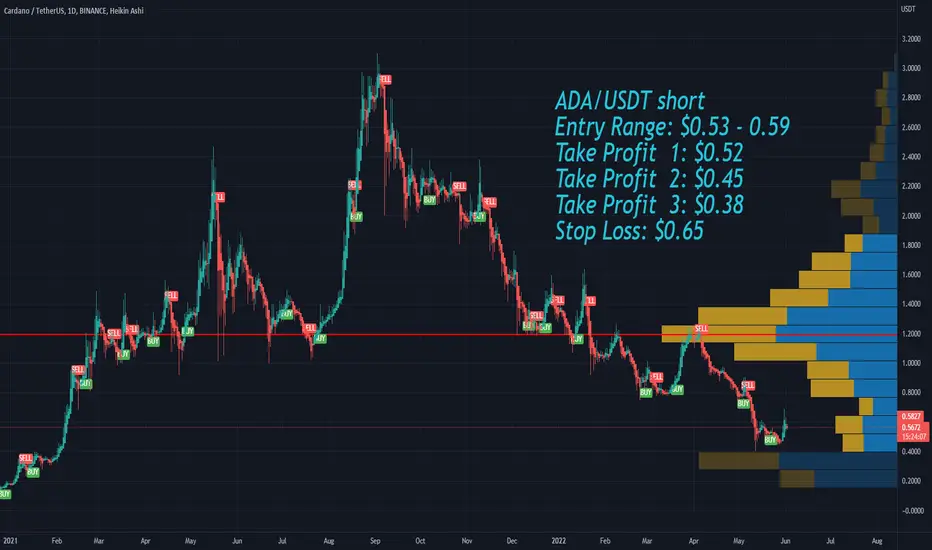
ADA Cardano short Entry Range, Take Profits and Stop LossADA/USDT short
Entry Range: $0.53 - 0.59
Take Profit 1: $0.52
Take Profit 2: $0.45
Take Profit 3: $0.38
Stop Loss: $0.65
ADA - reached all TP book profit. That's to trend line breakout ADA - reached all TP book profit. That's to trend line breakout strategy
