ADA long ADA long
Market cycle in play expecting reversal and rise up.
if pys low is broken trade to be reviewed
Search in ideas for "ada"

ADA to go up to test the resistance levelsADA chart looks good for a breakout and it has multi time frame squeezes and it seems to be on the way to test the $2.20 resistance level. My first price target is $1.80 and my second price target is $2.20.

ADA broke the support to the upside! Cardano ready for DEFI?ADA broke the support to the upside! Watch crucial areas for continuation!

ADA after breaking $ 1.59 another stop at $ 1.7ADA, despite small fluctuations on BTC, is trying to go up, it broke $ 1.48 - 0.786 Fib. It currently remains in the (0.786 - 1) Fib range. Breaking the $ 1.59 level, the next stop should be at $ 1.7.

ADA Cardano price target ADA Cardano bounced from the strong support area after being oversold.
It also formed a bullish divergence.
Price target is the $1.46 resistance.
Looking forward to read your opinion about it.

ADA Exchange Trading Idea 22-1-16ADA is near the top of the 78.6% level but bounced off the 50EMA. We did not get a new low and as the market settles out we may finally be in a slow uptrend. I still want a breakout and retest of the zone before I would look for an entry.

ADA puncture Fib 0.618ADA broke 3 important points of Fib Retracement, watch Fib rebound behavior 0.786 at $ 1.48. Breaking this level may translate into further increases. At the moment, there is a new support line at $ 1.39

ADA (Bull Flag)ADA bull flag pattern on the hourly timeframe. We are above the 200 MA, however we might break lower, or if BTC steps up, bull showed up, we might break out for this bull flag.

ADA/USDT - 1D - Long SignalsADA printed long signals on the daily.
The long setup is in two phases :
1 - The RSI of the last lower low is below 30 (December 30th - RSI 27.31);
2 - The price close below the close of the last lower low (December 30th - 1.211) AND the RSI is above 30.
*If the price close below the lower BBand, it's a bonus and the signal is stronger (not the case here).
**RSI is based on the close price, never use wicks when looking for RSI divergences (you can use line charts to be sure of the divergence).
Entry : The actual buy signals was on January 7th and 8th, but a buy below 1.211 is a good entry and below 1.181 is an excellant entry.
Stop Loss/invalidation point : If a daily candle close below RSI 30.
Take Profit : Use your own strategy, but if the price cross above the BBand basis, this trade should not be a loser (take fractional profit and move your stop loss just above your entry price).
The objective of my posts is to share what I am looking for for long/short entries, but you are fully responsible to press the buy/sell button and you can't blame anyone apart from you.
It's harder to exit the market than entry the market.
Not financial advise. Trade safe.

ADA weekly chart has a great opportunity.ADA weekly chart...this company has been some what
of a disappointment to many investors and traders...
but there are some great opportunities right now on this chart.
there is a bear pennant on the chart and a lower low on the RSI...but
that turns very Bullish once it turns around...so at the moment, its
screaming opportunity lurking at each investor. remember this
Cardano isn't the fastest developer but they do things correctly
and will be around for many years to come.

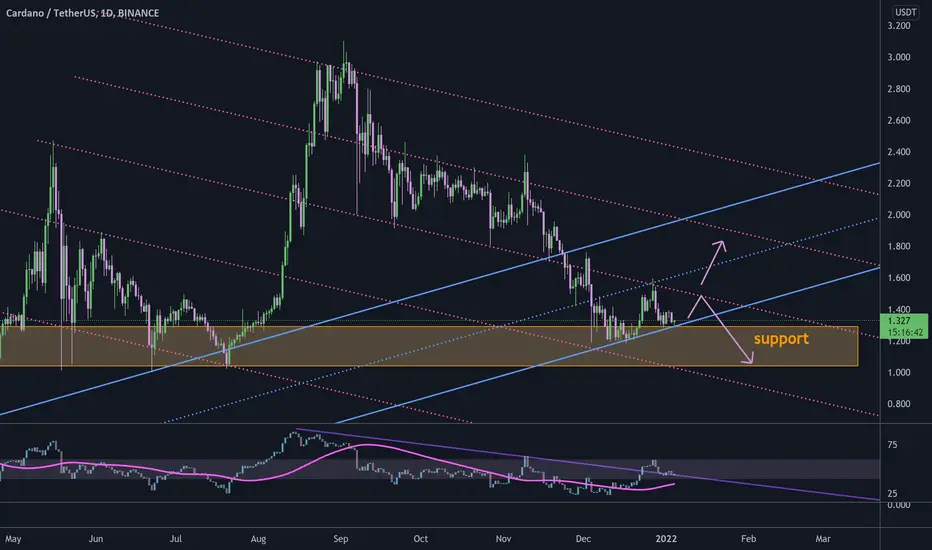
ADA difficult situation ADA will soon test the support line and we will see if there will be another correction (BTC influence) or a strong rebound and a new strong uptrend (when BTC starts to grow)


ADA Inverse Head and Shoulders ! !!!ADA/USDT is making inveerse head and shoulders pattern on 4h timeframe.
This is very likely because it made strong demand area out of head and it did a good reaction to left shoulder.
We also have support of 0.781 Fibbo Retracement level.
You can long this here with tight stop or can wait for it to break neck line and buy with conviction.
Entry: 1.33-1.35
Targets:
1) 1.38
2) 1.44
3) 1.6
Stop: 4k close below 1.28

ADA at long term support zone#ADA/USDT
$ADA broke down from long term ascending support an now is at long term support zone.
also there are descending trend lines that act as support and resistance.
if price hold the support zone, it can head up to broken support to confirm it as resistance.
if price break down from current support zone, it will drop to lower descending trend line.

ADA trend lines#ADA/USDT
$ADA trend lines act correctly.
now price is at ascending support line. holding this support will increase price to descending resistance around $1.48, break out from this resistance can head up price to touch $1.8 and $1.87.
but break down from current support will drop price to $1.
ADA Breakout not yet, coming in the 2022-Q1?ADA breakout not yet but coming nearer, watch out for oscillators.
Ada/usdt 1D analaysis Ada cardano suported from demand zone.
according to my analaysis will reach to specified targets .
pls follow and like or cm my idea's
tnx ( ARAZGROUP)

ADA - will follow BTC if it start bull cycle ADA - will follow BTC if it starts the bull cycle.
I showed you best entry ideas.

ADA to retest the resistance trend lineADA is looking to start an upward move to retest the resistance trendline from a few months ago. Multi time frame squeezes are forming. A volume break above 1.60 will get us quickly get to above $2. Keep tight stops and scale out as we get closer to key fib levels and previous ATH. There will be many whales selling there.
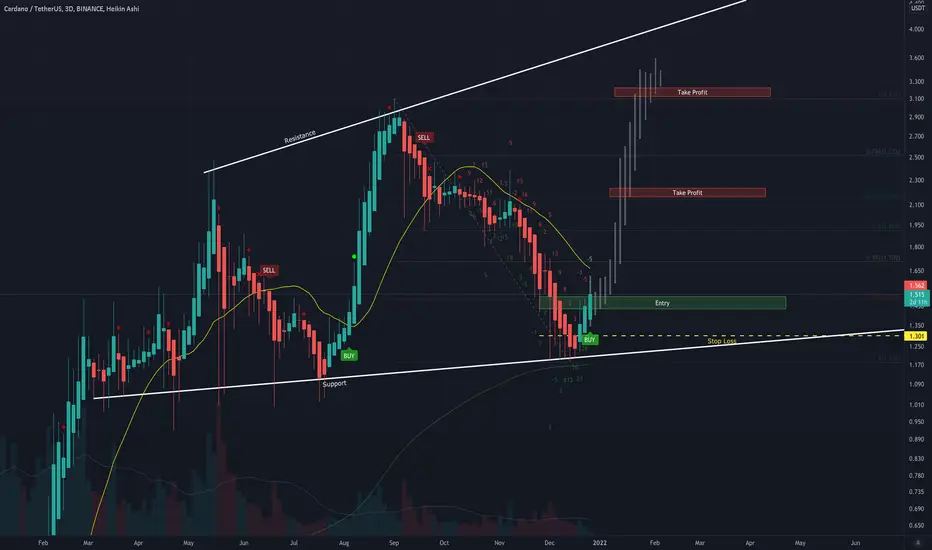
ADA Wyckoff Accumulation Schematic Update #2ADA potentially gearing up for another move to the upside if it keeps following the schematic. The current retest of important levels was predicted from following the accumulation schematic, indicating the next move should be towards the 1.53 - 1.57 area . Wyckoff Accumulation Schematic for reference: forexop.com

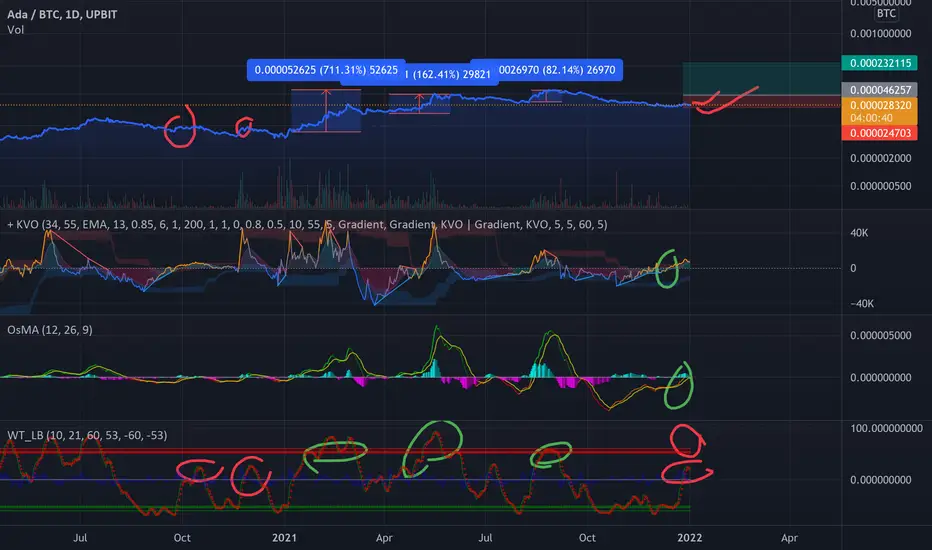
#ADA historical #breakouts against #BTCADA may be close to breakout.
Last breakout
1. May 2021
2. August 2021
Is it now December 2021 or later January 2021?

ADA Breakout inevitable, LONGingADA breakout is inevitable, very close. All major technical indicator shows breakout behaviour for ADA.
Last breakout May 2021 and August 2021!
Is it now December 2021?
ADA getting ready to take off? ADA looking good at these levels again!
Definitely a lot of upside potential from here for the LONG TERM.
** NOT TRADING ADVICE **
