Search in ideas for "nq"


NQ 15 failure?That was quite the impulse move down from the 61% retrace.
Almost climbed back up ; but not quite.
Is that a a failure?


NQ 15 Fell off the Fork but Climbed back onBarely hanging on.
Can you say sideways action?
Can't go down and can't go up.
I am thinking that upward momentum has stalled, so there might be a correction

NQ 15 Stopped walking up and went FlatThis could get interesting if the lower rail is broken downwards.
Target 50 % retrace at 4440 then possibly 61 to 75% retrace which takes us to the previous resistance at 4380.
Will that be support?

NQ 15 Walking up the Modified SchiffThat was quite the explosion up on May 24.
Since then it has been walking up the top rail until today we hit the median.
The SQZ shows a loss of momentum.
A drop through support at 4490 would also break the lower rail and signify a change of trend down


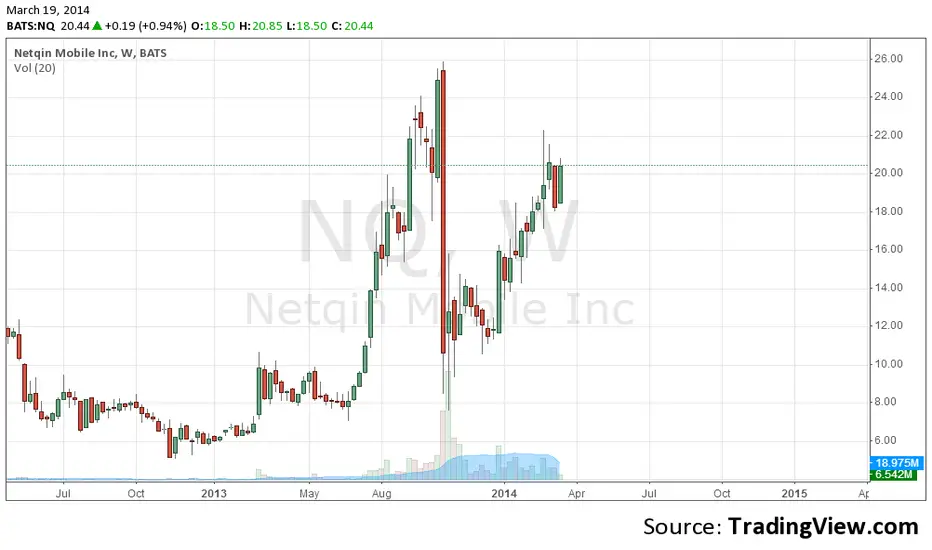
NQ Long IdeaOversold should start rebounding here. Great Institutional support and very high short Interest(>50%?) could lead to short squeeze under right circumstances.

NQ Next Move
NQ next move and beyond the technical analyse ..
NQ next move and beyond the technical analyse ..
NQ next move and beyond the technical analyse ..
NQ next move and beyond the technical analyse ..
NQ next move and beyond the technical analyse ..
NQ next move and beyond the technical analyse ..
NQ next move and beyond the technical analyse ..
NQ next move and beyond the technical analyse ..
NQ next move and beyond the technical analyse ..
NQ next move and beyond the technical analyse ..
NQ next move and beyond the technical analyse ..
NQ next move and beyond the technical analyse ..
NQ next move and beyond the technical analyse ..
NQ next move and beyond the technical analyse ..
NQ next move and beyond the technical analyse ..
NQ next move and beyond the technical analyse ..
NQ next move and beyond the technical analyse ..
NQ next move and beyond the technical analyse ..
NQ next move and beyond the technical analyse ..
NQ next move and beyond the technical analyse ..
NQ next move and beyond the technical analyse ..
NQ next move and beyond the technical analyse ..
NQ next move and beyond the technical analyse ..
NQ next move and beyond the technical analyse ..
NQ next move and beyond the technical analyse ..
NQ next move and beyond the technical analyse ..
NQ next move and beyond the technical analyse ..
NQ next move and beyond the technical analyse ..
NQ next move and beyond the technical analyse ..
NQ next move and beyond the technical analyse ..
NQ next move and beyond the technical analyse ..
NQ next move and beyond the technical analyse ..
NQ next move and beyond the technical analyse ..
NQ next move and beyond the technical analyse ..
NQ next move and beyond the technical analyse ..
NQ next move and beyond the technical analyse ..
NQ next move and beyond the technical analyse ..
NQ next move and beyond the technical analyse ..
NQ next move and beyond the technical analyse ..
NQ next move and beyond the technical analyse ..
NQ next move and beyond the technical analyse ..

NQ Congestion 10/4/2020NQ at the daily view.
The NQ experienced a technical pullback. Despite what news say, the NQ was primed for a pullback. NQ was at a key resistance zone in its current channel. The VXN was at both trend line and RSI support. Furthermore, the NAAD reached a trend line resistance as well. People who rely on the news for the trading either haven't done their due diligence in technical analysis... or were just plainly lazy to do so.
There is a lot going on in the NQ below. The NQ is not even halfway down its current channel. The green lines should be where we find some major support. The yellow dotted line is the old "redemption line" from its old upward channel. The pink line is the top of the NQ's old channel back from 2016. Basically, there are a lot of trend lines below that would make it very hard for the NQ to break below. The bearish case is that we still have some room to go below and it's election season. The VXN has yet to break trend line support. The NAAD has yet to break its trend line resistance. The VXN is projecting a volatility jump around mid-October.
However, the bullish case is getting stronger by the day. The NAAD made a couple of higher lows and might break its trend line resistance this week. Liquidity levels have turned around and started increasing. Corporate credit is definitely stabilizing. I'm seeing increased strength in the market internals. It's possible that the NQ is forming an inverse head and shoulders pattern, but we have to wait to see the right shoulder forming.
All this bullish and bearish evidence is telling me that we have entered into election seasons volatility. The downtrends and uptrends will most likely be short lived. Market internals are not bearish enough to support a crash, but not bullish enough to have a good uptrend... yet. Furthermore, there are several supports below that would prevent it from actually crashing. I'm just going to buy the dips and exit longs when the VXN is about to reach support.
Shorting has always been the riskier side of trading anyways. You're basically going again 100 years of processes that are designed to prevent a crash - unless it's a black swan event. Furthermore, downtrends are shorter lived than uptrends. By the time you realize it's a downtrend, it's already almost over. You can catch near the beginning of uptrends since they take longer to lift off. Trading is already hard. Why make it harder on yourself?

Short-Term Market Fluctuations: Analyzing the NQ CorrectionIn this article, I'll explore the recent decline in the Nasdaq 100 (NQ) index from the 13,200 level, focusing on its corrective nature and potential implications for short-term price action. By examining the 15-minute timeframe chart and considering the impact of tomorrow's scheduled economic release , we can gain insights into possible market moves and make more informed trading decisions.
Identifying the Corrective Nature of the NQ Decline
From 13,200, the NQ has experienced a decline that appears corrective rather than impulsive. If you examine the 15-minute timeframe chart, you'll likely concur with this assessment. The current targets for this correction sit around 13,000 or as low as 12,980.
Considering the Impact of Economic Releases on Short-Term Price Action
What makes me skeptical of further short-term downside is the fact that economic data is set to be released tomorrow morning at 8:30 AM in premarket trading. If the NQ continues its decline to complete the correction, it's probable that we will witness a significant upside move following the release of the data.
Analyzing the Initial Move and Providing Actionable Information
My concern with the initial decline is that it consisted of three waves, rather than a clear five-wave impulse. For now, I'm ruling out the possibility of a major downside move tomorrow. Unlike some traders who provide vague content and only reveal their "conditional" orders after the fact, I aim to offer actionable information beforehand.
If the NQ drops into the 8:30 AM release tomorrow, we are more likely to see an upward move. Conversely, if the index rises overnight, we can expect a downside move following the data release.
Understanding the corrective nature of the NQ's recent decline and factoring in the impact of upcoming economic releases can help us better navigate short-term market fluctuations. By providing actionable information ahead of time and adapting my analysis as needed, we can make more informed decisions and improve our trading outcomes. Keep an eye on the NQ's price action as we approach tomorrow's data release and adjust your trading strategy accordingly.

If I was a QQQ/NQ crystal ball...April Fools Day is right around the corner.
Anyone foolish enough to think NQ, on this date, will close over 15,200? Call me foolish but I have a high conviction this price point will be met by this date. Should this happen momentum or the lagging span (within the rules of Ichimoku) will be above price on the weekly close which could create a squeeze the weeks following to bring QQQ/NQ to new ATH's by May.
From a charting perspective, I have noticed what appears to be an expanding triangle that began the week of Aug 16, 2021. Expanding triangles have a 5 pattern swing to them. My chart above shows us to be on leg 4 of the pattern which typically ends with a violent swing up and ends at 5. From a Fib Sequencing perspective, leg 0-1 lasted 3 weeks, leg 2-3 lasted 5 weeks and I anticipate leg 4-5 lasting 8 weeks.
From a time perspective I'm targeting next week as a possible bottom on NQ as follows:
1. If you use Fib Sequencing, March 16th is Day 55 from the NQ double top reversal candle made on Dec 28th 2021. Days 21 & 34 within this sequencing produced reversals but those reversals have shown to have failed so now I'm looking for day 55 (or around this date) to possibly set up a signal.
2. The Covid crash bottomed out on week 6. Next week is week 12 from the NQ Double Top made the week of Dec 27th. Doubling the "time" of the Covid crash has symmetry.
Because I believe "time" to be the most important factor I am sitting on my hands this week observing price and how we close out weeks end. I do believe price on the NQ could dip a little below 12K but I'm not counting on this happening, my target on NQ low right now is 12,235. IMO I believe price needs to stay "just above" the 50% retracement from the Covid low to make a new ATH in May. In addition, I believe we must "close" price on the weekly ABOVE my non-horizontal dark pink lower line...a closing below this line will negate my thesis. Wicks are okay.
The key for this to play out is that we need to get the lagging span/momentum back above price on the weekly and April Fools just seems like the perfect day to give the bears the middle finger.

NQ/QQQ Weekly Levels & Trade Prep (Jun20-23) NQ made and explosive move thought the 1.13 Fib X closing at the 1.272 Fib X. As earnings season has wrapped up the main catalyst this shortened trading week will be speeched from Fed Head including Powell on Wednesday and Thursday. NQ is solidly trading the bull zone but is extended and due for a pause or pull back. The first major dip should be buyable.
SUMMARY
• Nasdaq posted a 3.78% gain last week after trading in a range of 740 points.
• NQ re-tested the HTF 618 fib again then blew through 1.13 Fib X resistance.
• NQ only 10.70% off its ATH.
• Priced close at the 1.272 Fib extension which is now first resistance.
• Every sector closed green on the week except XLE which closed down 0.58%. Strongest sectors were XLK, XLB & XLY
• Market breadth has improved but Mega caps continued to lead the market higher.
• More than half (52%) of all stocks are now above their 200 SMAs.
• Momentum ETFs and algos are now set to buy.
• Long term bias is now bullish but, market is extended and due for a pull back.
• Still potential for NQ to re-test the Aug 16th breakout point.
• VIX is in the TRIM zone (13.53)
• Buy the Dip has returned as the ATH is now in play.
• US Market is closed Monday
WEEKLY EVENTS
Monday US Markets closed
Tuesday US Housing Starts, Fed’s Bullard, Barr & Williams speak
Wednesday Can Retail Sales, Fed’s Powell, Goolsbee & Mester speak
Thursday US Initial Jobless Claims, US Home sales, EIA Crude & Fed’s Powell, Bowman, Waller & Mester speak
Friday US S&P Manufacturing PMI flash, Fed’s Mester, Bostic & Bullard speak
NOTABLE EARNINGS
Monday US Markets closed
Tuesday FDX
Wednesday KBH
Thursday CAN, DRI
Friday KMX
BULLISH NOTES
NQ above the 1.13 Fib Extension
NQ above the longer term 618 Fib RT
EMAs are stacked
Market breadth is improving
The longer term 886 Fib retracement is now the price magnet
In a technical bull market. (Above LT 618 Fib RT)
Momentum ETFs are now in buy mode
Buy the dip is back in style
BEARISH NOTES
Potential hard reversal at the 1.27 Fib X / 786 Fib Retracement
MEGA cap stocks are extended and near resistance zones
VIX is below 14 (sell zone)
Aug 16th breakout level has not been re-tested yet.
Potential negative reaction to Fed Head talk
Potential shock event (more bank failures)
Earnings momentum is over
Summer trading season is starting soon (lower volumes)
Both RSI & Stoch 5,1 are Overbought

NQ's Bull Flag Played Out 8/18/2020NQ at the daily view.
The NQ's bull flag played out a little earlier than I expected. The measured move for the bull flag would put the NQ right above 11500. What's stopping it now is my last historical resistance (orange line) which I named it the Icarus Line.
I have no idea if the Icarus Line will hold. NQ is among the most overcrowded trades (long side). Lately, market breadth has been decreasing since money is flowing into FATMANG stocks (big tech).
Institutions were distributing the NQ since July 13th. That's why the RTY or Russel got a boost in the last month. Institutions were taking advantage of the tech hype when the Robinhooders got the alert to go long on the XLK.
However, distribution phases usually end by the end of the summer... which is around this time. Meaning, the NQ may be unleashed again. Interestingly, the NQ is also in a giant ascending wedge.
With liquidity being this high, I'm not bother with any shorts (except for the VIX). I'll just wait for a pullback and long from supports. That's the easier trade.

NQ Daily Analysis NQ Daily Analysis - Break and Retest of the 15050-14680 10-Day Range
I usually don't look at NQ as my primary focus is ES, but scrolling through my watchlist I stumbled across the old depiction I made of NQ trading in a range, and now we are here backtesting it. Could we be setting up for a break and retest or will this be a failed breakout and we start trading back inside the range? We are also building a bull flag shown by the purple trend lines so it wouldn't be surprising to see NQ continuing to fill out the flag.
With ES ~4350/SPY ~430 at a core level (imo) that'll need to hold to see more upside, coupled with NQ at a significant break and retest level, this puts more upside in play. Don't be stuck on one direction though. We have to be situationaly aware of world news and the econmic calendar this week as it will continue to bring volatility into play. I always focus on levels and technical analysis, while being mindful of contributing factors.
As always, manage your risk to reward ratios while we trade this upcoming week. Taking a short into NQ being at a break and retest daily level, on a higher time frame aspect, isn't the greatest risk to reward.

NQ Rotation 11/24/2020NQ at the daily.
As suspected, NQ will be lagging since the rotation from growth to cyclical stocks continue. How long will this take? Longer than people expect. Will NQ breakout? Eventually. Market breadth has to increase even more and that will drag the NQ higher.
Until then, I am expecting some sort of decent pullback for the indices. Most likely not this week since it is a holiday week. Normally, holiday weeks are slightly bullish with very low volume.
The only other way the NQ can rise fast (besides post-rotation) is giant nationwide lockdown. Chances of that happening? Almost zero. Why? Different states have different types of economies. Some manufacturing states cannot afford a lockdown and will be adamantly against it. It makes sense really. When faced with the decision between working (catching the virus) or seeing your family starve, most would risk going to work and catch the virus. Besides, the shock and awe of lockdowns lost its luster after the first time.
It makes sense that tech's growth is now muted. The sentiment for tech is still crazy bullish. Most of the shorts were wiped away during the summer uptrend. So, there are not many shorts left to cover and bring the NQ up. That's a very different story with RTY. RTY was loaded with shorts since April and it all blew up at once. Now, RTY is at all-time highs.

NQ Correction 9/12/2020NQ at the daily.
Well, what did anyone expect? My original channel top was that dotted red line. NQ broke the top of that channel. Usually, when the top of the channel breaks, that's not bullish at all. The price usually gets punished by being hammered down.
This shouldn't be a surprise at all. What's annoying is seeing permabears being very, very petty and try to gloat at everyone. It's quite sad actually. I know some of them shorted the NQ since the 9000s. Being petty like that doesn't get your money back. When I see permabulls or permabears do that, it tells me that they lack any control over their emotions. It tells me that they lack any maturity. They should not be trading at all because of that lack of control.
There were multiple signs of a correction. Bearish divergence at the NAAD, bullish divergence at the dollar strength, VXN was making 3-4 higher lows, and liquidity was decreasing. How far will NQ's correction will go? I wouldn't be surprised to see the upper 9000s again. Will the Federal Reserve save it? Why? NQ was already way above its previous all-time high. There really is no need for them to do anything for now. Would institutions buy this dip? Why? I personally wouldn't buy it at these prices if my intent is to hold it for more then 24 hours.
The VXN is preparing another spike. Usually, there is a subsequent spike in the volatility indices. Usually it happens 5-7 trading days after the first spike. So, next week should have another selloff.
That said, if the NQ does sell off again, be careful of short covering rallies. How many bears have trapped shorts below? Well, probably just as many as trapped bulls who bought near the top.
Disclaimer: These charts are for my trading team. I am not doing this for reputation points nor do I really care about them.

NQ Possible Bull Flag 8/15/2020NQ at the daily view.
It seems the NQ is revealing more of its hand. Taking a bigger picture look, the NQ is consolidating and bull flagging.
Usually, the distribution phase ends near the end of summer. We are approaching that soon. There are still Robinhooders and FOMOers who are getting in on the tech hype. Institutions were selling to take advantage of that hype. That's why the Dow and Russell have been gaining ground. However, the market breadth has been getting narrower lately. Weaker market breadth means that breakouts become more unhealthy.
Liquidity is still pretty high. Any pullback from the NQ in the short-term would most likely be part of the bull flag. As long as the NQ doesn't break the upward channel, then it's merely a consolidation. However, at the weekly, view, there's now limited upside potential to the NQ as weekly momentum is slowing down.
Bigger time frames will always trump smaller time frames.
