NQ Scalping Update 5/30NQ Weekly Outlook - As we can see all of my downside levels have been hit and will continue to remain bearish pending any news surprises. 18,600 is the line of the sand for me or it gets ugly. Weekly trend showing multiple bearish divergences also.
Upside Targets:
* 18,929--19,000--19,100
Downside Targets:
*18,826--18,758--18,693
Daily Trend Tracker -
*NQ- *DXY+ *VIX+ *US10Y+
Search in ideas for "nq"

NQ Scalping Zones 5/28NQ Weekly Outlook
Upside Targets:
* 18,929--19,000--19,100
Downside Targets:
*18,826--18,758--18,693
Daily Trend Tracker -
*NQ? *DXY- *VIX- *US10Y-

NQ/QQQ - Trade Setup Ideas for Short TermNQ looks very similar to ES. Ascending channel break + double top at supply. If NQ breaks below 18240, I like shorts, but longs above. Long tsrget is the previous double top. Short target would be the trendline below or potentially 18,000.

NQ Trade OpportunitiesNQ is setting up well for a long or a short opportunity. Looking for NQ to fail at supply and retest the trendline it just broke above for a long or for it to fall back below that trendline and fail on a retest for a short.

$SPX over perform NQ | Shift towards valueBeen tracking this one for weeks now as we've formed a bottom and reclaimed support.
We think across markets, we're seeing a macro shift away from speculative tech and towards value. TVC:SXXP (European SPX) could be forming a bottom vs SPX as well.
What this over performance could look like remains to be seen. Could be more defensive in a downward move or if we catch support, it could be over performance to the upside.
Regardless, the real message here is the shift away from US tech for the foreseeable future.
Finally breaking through to bull side RSI on the weekly and AO flipping bullish.
not touching NQ for a good while.
Something to note is the original support bottom on this chart was the Nov '21 top across markets and Jan '23 was market bottom.

Is NQ Ready for A Markdown?Using the Wyckoff cycle, NQ could be indicating it's ready for a markdown phase.

NQ - PermaBull looking for ShortsNQ - Sat here for a good portion of the London session and observed price without pushing the button. I watched NQ return at the daily open/settlement price. The 580 level on NWOG has remained significant throughout the week. Reflecting on the week, particularly yesterday, it brings to mind ICT weekly profiles. S&D bearish scenario: Thursday breaks the high, with Friday continuing to push lower. Notably, Tuesday marked the low of the week. Conversely, there's a Classic Bullish weekly profile where Thursday sets a new high, followed by Friday pushing lower to close the week. With that said, these bears :bear: signals may not be entirely reliable. The market closed yesterday with the higher timeframes still indicating a bullish sentiment. It's easy to get fixated on the possibility of a major dump on Friday #TGIF, but the recently closed 3-hour candle doesn't scream bearish. We may continue to push UP, way UP.

2-13 NQ Recap2/12 Weekly Plan. NQ Futures March ESH24 Weekly Pivot is 18,007
Targets
18,112
18,270
18,426
Targets
17,864
17,660
17,482

NQ - Neutral - First Week of February NQ has reached its HTF objective of ATH. Anticipating consolidation as NQ & YM wait for ES to run it's high.

NQ - Neutral - 3rd Week of JanuaryNQ also leaves me fairly neutral. I'd like to do business with market makers in the daily fvg & the daily breaker mean threshold. NQ is also in deep premium.
IPDA is currently contradicting Bonds & Yields.


NQ channels confluencesNQ channels confluences: here are many channels all meeting at last printed NQ lows

NQ UpdateNQ selling off as I predicted yesterday. Maybe I should've shorted AAPL, little late now.
Not going long until NQ goes oversold, and only for a day. CPI next Wed before market open.
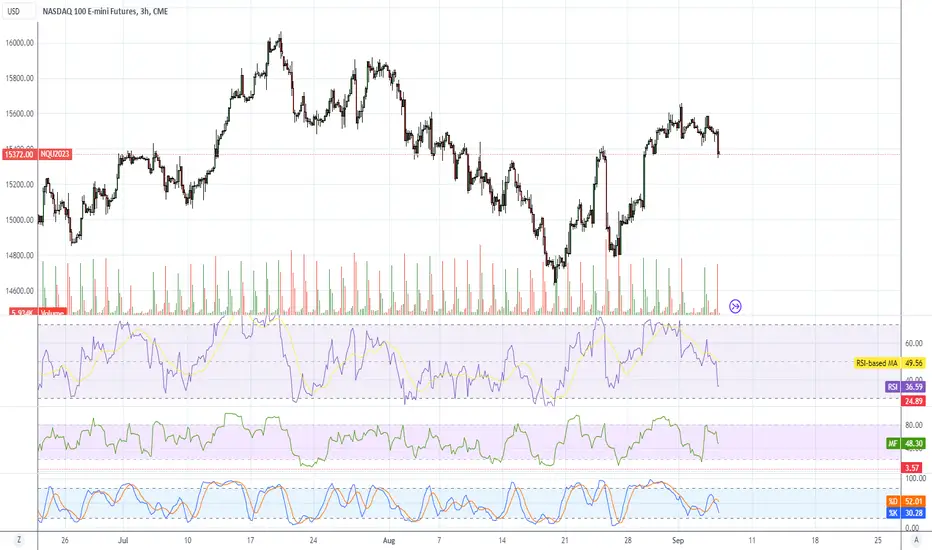
NQ Levels CGG Newsletter (08/06-11/2023)NQ is forming an ascending broadening wedge on the daily. Typically this is a bearish pattern, but I believe a bounce is due as NQ is close to a key daily level at 15333 and a golden pocket 61.8% retrace of at 15315. If we get the bounce, we can target the weekly level at 15709 inside the daily fair value gap above where the short GP lies (61.8% retrace is at 15695) If this bounce does not hold, we can expect the daily FVG to fill below at 15255-152128.
Upside
15444 → 15552 → 15882 → 15695 → 15728
Downside
15333→ 15315 → 15254 → 15218 → 15172

Market Update - BTC, BTC1!, ETH, SP, NQ, DXYQuick market update focusing on Bitcoin and covering BTC CME Futures, ETH, SP, NQ, and DXY.
Effectively Bitcoin is still holding the $30k support and trend does remain to the upside, with major news events starting Wednesday with inflation data, we are expecting an increase in volume/volatility. Overall we did breakdown from the range high but until the $30k support is lost and bearishly retested the overall trend remains to the upside.
TradFi is also holding its ranges continuing the rally, until higher timeframe structure is lost the expectation is that the upside trend will continue until proven otherwise.
Generally we have hedged off BTC longs with some shorts from $31.2k and higher, we are still net long but have taken some profit in the upside of the range last week as a precaution. The play is the range until proven otherwise.

ES/NQ Weekly Analisys Weekly Analysis
June 20 - June 23, 2023
During the previous week, NQ entered the zone of the daily Order Block (OB) and came close to testing the Mean threshold of that OB. It also entered the Monthly BB-.
Therefore, this week, I anticipate a retracement to the 4-hour OB level between 15188.00 and 15094. For an ideal scenario, I would like to see a bounce from the range of 15186.75 to 15142.50, targeting the Mean Threshold of the Daily OB at 15534.00. It's also worth monitoring the Critical Level of the Monthly Break Block at 15722.75, although it may not be reached this week.
To recap the structure: Consolidation, followed by Expansion, and then a Retracement before the Order Block and resumption of movement. Alternatively, it could be Consolidation, Expansion, and then a Reversal.
Hence, my retracement level before the Order Block is set at 15186.75. Inside that zone, there are 15-minute BB+, as well as 15-minute FVG and 1-hour FVG. If the retracement fails to hold at the OB level, we should anticipate a reversal phase where it breaks 15066 and drops further, ideally reaching the Daily SIBI level between 14963 and 14866.75.
The same analysis applies to ES: ES also entered the zone of the Daily OB (4615.00-4486.25), which aligns with the Monthly BB-. Remembering the structure: Consolidation, Expansion, and then a Retracement before the Order Block and resumption of movement. Alternatively, it could be Consolidation, Expansion, and then a Reversal.
For ES, my retracement level is set at 4431.75 to 4423.25. The 4-hour OB is located at 4419 to 4404.50, with 15-minute FVG and BB+ within this range as well. If the 4-hour OB fails to hold, we can expect a Reversal Phase, leading to a test of the SSL at 4393.75. The Daily SIBI is found at 4381.75 to 4369.50.
However, a bounce from the Retracement Area should fill the Weekly SIBI at 4506.25. Additionally, there is a Daily Breakaway Gap to consider. Key levels to watch are 4524.00 and 4531.25, which correspond to the Mean Threshold of the Daily OB.

NQ UpdateNQ has been melting up all month, notice how RSI never hit oversold even when MFI did.
I expect the slow melt up to continue until March CPI release (April 12th), so expecting a gap fill as early as next week. If CPI comes in low, then expect an APril pump for AAPL and FB earnings. That's what they always do in a bull market.
Notice how I haven't said anything about shorting tech even though AAPL is overbought? I think they're gonna keep melting FAANG stocks up, and you never short a melt up, there's no money in it unless you get lucky. Even if you timed AAPL perfectly, it dropped only 2% between yesterday's high and yesterday's low. Didn't even hit yesterday's low despite the morning tank today.
All indications are that NQ will break out of this cup and handle formation and hit 13750

NQ UpdateNQ MFI is almost oversold, so I assume that means a pump tomorrow when it gets there. NQ is the only index that appears to be melting up.
No idea which way the market gaps tomorrow, but I might go long on tech tomorrow. No idea what the market is gonna do this afternoon, so much news related whipsaw....


My today's view on NQHi Traders,
This is my view for today on NQ
The main structure on a middle term perspective remains bearish, anyway12460 could be today's target where this strong bullish impulse could ended.
I'll personally wait for a retest beside yesterday's POC before opening a Long position.
I remind you that this is only a forecast based on what current data are.
I really hope you liked this content and I would like to know what do you think about this analysis, so please use the comment section below to give me your point of view.
Pit, Trading Kitchen
DISCLAIMER:
Trading activity is very dangerous. All the contents, suggestions, strategies, videos, images, trade setups and forecast, everything you see on this website and are the result of my personal evaluations and was created for educational purposes only and not as an incentive to invest. Do not consider them as financial advice.
———————————

Marlo's Going To Hell NQ Swing Strategy I know it's so simple you can't believe it! Is it magic? Is the Devil running the Stock Market!?!
Nope, what you're seeing is the all-pervasive 50% Principle in action!
www.investopedia.com
"It states that if an asset drops after a price increase, it will lose between 50% and 67% of recent price gains before rebounding. "
So over any given range, the retrace will test the thirds for support and resistance. NQ counts in the thousands so xx666.00! You'll see similar across smaller TFs and ranges as well using 33.34% and 66.67% retraces.

Marlo's Going To Hell NQ Strategy I know it's so simple you can't believe it! Is it magic? Is the Devil running the Stock Market!?!
Nope, what you're seeing is the all-pervasive 50% Principle in action!
www.investopedia.com
"It states that if an asset drops after a price increase, it will lose between 50% and 67% of recent price gains before rebounding. "
So over any given range, the retrace will test the thirds for support and resistance. Nq counts in the thousands so xx666.00

Elliott Wave Forecasts rally in Nasdaq (NQ) to fail for Further Short term, Elliott wave view in Nasdaq (NQ) suggests that the decline from 8.16.2022 high is unfolding as a 5 waves impulse Elliott Wave structure. Down from 8.16.2022 high, wave (1) ended at 10890.75 and rally in wave (2) ended at 12339. Internal subdivision of wave (2) unfolded as an expanded Flat structure where wave A ended at 11729.75 and pullback in wave B ended at 10484.75. Final leg wave C ended at 12337.49 which completed wave (2). Index then resumes lower from there in wave (3). Down from wave (2), wave ((i)) ended at 11847 and rally in wave ((ii)) ended at 12069.50. Index resumes lower in wave ((iii)) towards 11275, wave ((iv)) ended at 11411, and final leg lower wave ((v)) ended at 11043.50. This completed wave 1 in higher degree.
Wave 2 corrective rally ended at 11389.75 with internal subdivision as a zigzag structure. Up from wave 1, wave ((a)) ended at 11263.75 and pullback in wave ((b)) ended at 11181. Final leg higher wave ((c)) ended at 11389.75 which completed wave 2. The Index resumes lower in wave 3 with internal subdivision as another impulse. Down from wave 2, wave ((i)) ended at 10870.50. As far as rally fails below wave 2 at 11389.75 and more importantly below wave (2) high at 12337.49, expect the Index to extend lower.
