NQ is in clear bear flagI didnt have much time on research today, busy day.
But I did spend some time on the NQ, as I didnt do NQ update for a while.
I will also add comments to this post after I do my other research and go through few others updates I follow.
So stay tuned, high chance this chart will get updated with extra comments several times.
So as you can see on the chart, we are in a small (compare to the rest of the year) bear flag and we are already in most overbought conditions for this year including TRIN number and volume.
My best extension (if it was not topped yet and they will push it higher before the elections) is at 12110-50NQ, with the top of the channel at 12250-300.
But first it has to close above recent highs - 11750NQ
I do expect a yo-yo style (outlined on the SPX yesterday) going into EOM and then Midterms.
But the ideal target for this year is actually at 8-8.2k zone!
I know it sounds crazy, but hey wasnt today's numbers crazy early this year?
Some are still in denial.
I do not call for a crash any longer, as we are out of that window astrologically and cyclically but I want to see another 25-35% cut from today's levels before this is over and we bounce hard into a bigger B wave
No new highs next several years at min, maybe after 2026 if not 2032. I do expect 1999 and 2009 pattern, check it out.
Again I might be wrong as anyone else out there, but this is my long term view, gotta stick to it till I see clear changes in trend.
My plan for the short term is the same, its short tomorrow (Im already swing short) into EOM or 1-2nd FOMC rate decision) which should spark a rally and ideally mark the temp bottom going into the Midterms.
They might make a big hike and stop for this year. Canada already increased .50 points instead of .75 points today, so FED can surprise.
After the Midterms is where it gets tricky, I think we will have a last move down into week of 21st of Nov low, that should mark the low for the year.
Can we extend into next year, yes we can, I will be updating you with my view going forward into mid of Nov.
If something not clear, just shoot a question below this post.
Here is zoomed in chart
Also please dont forget to press that 🚀 sign under this post to push it up in algos for others to discover.
Search in ideas for "nq"

NQ is looking much lower!Here are the levels of importance for NQ on the downside:
- 11060
- 10656-500
- 10300
- 9990
The last 2 numbers are the main target zone now
I want one more push tomorrow.
Since it's not only weekly, but monthly and (very important) quarterly closing this Fri.
Last 2 quarter ends both resulted in selling last 2 days, something to pay attention to.
So a flush is very possible to start as early as tomorrow or ideally after Oct 3rd high.
I have closed my ES short at 3715.50, 3710.5 from 3727 and waiting to enter with some longs, but will have stops, dont want to wake up with a huge gap down.
Also Im in with some SPY 351 Oct 21st puts and some Fri SPY calls from the close.
If we break down, I will be entering to my swing MNQ position.
For now I want to see a standard 50-61.8% retracement to get long in am.
ES is at 3665 (main target) and 3682
NQ is at 11377 and 11322 (I like 11355 as a target)
Here is 1h chart with support and resistance white lines
Good night

NQ to make another daily engulfing pattern if we make below 790The price rejected the test of the broken trendline - perfect kiss of the death pattern.
My thoughts about a fakeout were too optimistic, I was looking to add to my NQ short at higher levels and it didnt present an opportunity.
Main target for this move is 11175-85 and possibly much lower.
Try not to day trade this, unless you're quick with taking profits and run
NQ same as the SPX, looking for a good size rally after the FOMC and fade completely by Friday
Going to short a bounce, if presented
P.S. Dont forget to like (click star-ship button) my posts, so it gets pushed up on TV for others to see as well.
Thanks in advance!

NQ Zoomed out chartCheck the broken to the downside trend channel re-test NQ is having now.
So far its riding it from the bottom.
I wont count out a fakeout move up to 12150-60 or even 12240-50 and then going back below the bottom of the trend channel.
Support is at 11900 for tomorrow long try. If we see that level during the open time, I will be taking long for a 100+ points ride up.
The most bullish case is - re visit 12700 level.
But the time is really running out and unless we get a huge squeeze tomorrow, I think the upside will be very limited and the price will eventually get to my main target - 11175-200 and maybe much lower.
Oct should mark the low and Im wondering if we even see 9-10k zone tested.
So far Im planning on adding to my swing short tomorrow and just seat on it till after the FOMC decision move.
Im running some ES longs against my main NQ short, ready to cut at 3919ES level.
This is my working chart and I have hided as many indicators as possible, so you all can see the chart more clear then it is:)
P.S. Dont forget to like (click star-ship button) my posts, so it gets pushed up on TV for others to see as well.
Thanks in advance!

NQ testing the bottom of the channel!Markets are testing the most important support levels, NQ here and the ES 3985-3900.
So far if we hold here on the NQ, we should see a strong rally out of this levels, so it's must hold.
Breaking below we should see 10500 imo
P.S. Dont forget to like my posts, so it gets pushed up on TV for others to see as well.
Thanks in advance!

NQ is same as the ES hitting the top of resistanceWhile ES has a different look then the NQ, NQ is hitting the top of the channel, Maj support is at 12610-20 now

NQ cant reclaim the mid of the channelI know there are too many lines for some, but they are important to me. Just pay attention to the green trend channel and the blue doted mid of the channel line
NQ is supporting a view I have on the SPX, looking for some lower (NQ down to the low of the channel line before a fakeout.

NQ - 1 Hour / Attraction Range The 1 Hour helps us determine how this Range will Trade until it finally Breaks.
it has been Consolidated in an extremely large one - 14639 down to 13706.
_____________________________________________________________________
Many traders have given up, having been whipsawed relentlessly.
And understandably so as - be quick or be dead is the Game currently.
it is extremely difficult for most to go from Postion Trading where every
Dip bought is a win - to being subject to extremely Volatility.
______________________________________________________________________
If you are unable to adjust - it is best to be in Cash on the Sideliens waiting for
Resoltiuon.
Optionas, exactly the same underlying issues, If you are not in and out in Profit or
able to hold on - you will Lose. Friday was another example of the Operators wrecking
everyone.
It is not referred to as " F_ck You Friday " for whimsy.
_______________________________________________________________________
We have had success in Sclapoing the NQ with very simple steps.
1. Know the Full Rnage
2. What trades First matters - is. Support or Ressitance
3. Algos increase Velcoity Intra-Day during specific timeframes
4. ES Leads - (Friday's the NQ followed the ES Breaks Higehr)
5. 1 Min Primary Chart with 15 min / 30Min NQ Thumbnails and ES 5 Min Thumbnail
are required.
6. Memorie VX Micro Range
7. Use NYSE TICK for Entry @ Levels - Buy Extreem Lows, Sell Extreme Highs during
High VX and during lower VX there is a lear range for the ALGOs that Trends.
8. Speed EMAs need to be set @ 3 / 5/ 8 / 13 / 21 on all TFs.
_________________________________________________________________________
We had our best week in quite awhile simply Scalping each day, keeping Contract Size
relatively small with Micros for the MNQ, when appropriate we sell far more into
Resistance ( up to 50 Micros) and when Support confirms we will use and Inverse
Ladder to Postion up to 20 to 25.
We do not use Limit Orders ever for this, never.
It is a simple script for Buy abd Sell, 2 Keys in a 1/10th of a second to Buy or Sell @ Market.
Not fans of hanging out in the Book or ORder Floww ever.

NQ - 1 Hour / VXN Correlation Struggling OU812VXN has been interesting during VX Settlement, The
IV and skittish nature of the NQ Optiojs Market is confusing
Traders.
VXN IS suppressed while NQ Slides at times.
Underlying is the preferred Instrument, Micros over
options - MNQ performs far better presently.
The Front Run of 200 SMA @ 14986 was 6 ticks.
Bottom the Range and Larger retracement or Diver Down.
The VIX / ES have been dragging the NQ around perfectly,
not the VXN - this confirms the ALL Market Correlation.
Freaky Friday tomorrow, Large Expiry seeing Leap Exits
show up at 10 AM EST and EOD>

NQ - Daily / 4X Negative Divergence - Break @ 1 Positive @ 26/12Traders should Observe MACD Break. It is unusual - while sitting near lows
it has been unable to clear the Signal Line for greater than one month.
Crossing the Signal Line (White Line) would be a Buy SIgnal. This is why
the NQ sold off the last 30 Minutes Thursday. Insts knew this presented
the potential for a Counter-Trend - we indicated based on VX Price action
there would be an 82% probability the Equity Comkex pulled back to ST Supports.
It is an unusual break as the overall structure is very weak.
MACD is a Trend-following momentum indicator - MACD is calculated by
subtracting the 26-EMA from the 12-EMA.
We Prefer the 21/13 for quicker response to breaks as it provides more
of an Edge for retracements - suggest observing those more accurate
settings.
________________________________________________________________
Price has two Overhead Trendlines which are the Real TLs.
1/5 TL and the 3/5 TL as they have a POS (Point of Convergence) for which
the intersect is identified. Duration Intersects are very powerful Resistance
and the why.
The Level sets a Clear SELL opportunity.
________________________________________________________________
Here's the larger issue.
The Monthly Timeframe remains in an extraordinary Parabola and will until
we see this range from 15,500 to 16,500 broken. The MACD is as high as it
has been and has a Positive Slope.
it is supportive but can curl to flatten out at elevated Levels.
The Flip Side of this: 8/8 completed Last Month on the Largest Count.
It is presently 1/X or the point of indecision.
The NQ has not had an 8/8 Monthy Count going back years.
___________________________________________________________________
The highest Probability is the NQ Reverses and performs the Larger 4/5 Sell we
have been patiently waiting for... This is how we are going to Trade the Setup.
16771 is the MAR CT Limit to avoid an Overthrow, and frankly, even if it did, it can
reverse and place a large Dark cloud over 8/8 as it has done in the past on
shorter Counts.
_____________________________________________________________________
The Salient point here is although there are the Potentials for Higher, the higher
the potential is Price will move back to test 14,000.
_____________________________________________________________________
Merry Christmas / Happy Holidays Everyone
- HK

NQ - 1 Hour / MondayWe are closely observing the Year-End Losers in NQ for the Potential
Fuel for any retracements - the Year-End Winner remain under pressure.
The Likes of CERN are not going to turn the NQ, it is however a Chart worth
observing, pure Mania.
Expanding Breadth will be difficult until Wednesday, If probable at all.
On balance, selling is letting up on those equities which have already taken
50 to 60% Price Declines.
The Low to Low Extension and Full Draw have similar PO's for NQ.
_________________________________________________________________
We'll see how far they press their Luck as NQ is being kept in check @ Micro
Resistance while having POs down to 14450s.
Another Day or two of this selling and MArgin Calls quickly come into the Trade.

NQ - 15 MinuteTrending Cloud touch into Fill.
Pretty amazing Price action in an enormous Range.
ES and NQ pulled back to larger Supports on 2 Draws,
1 @ 50% the other Micro - .618.
The Bid into VX did not last again.
_______________________________________________
30 Minutes chart has been reliable on both ends for Scalp,
a higher low on the 15Min has confirmed entries both up
and down.
New Highs come into trade on the ES recovery over 4610.50
LIS.
NQ will need to cross 262 to continue the ignorance of the
Ravens Rates...
_________________________________________________
McClellan OSC's are in Crash Area and Trending Lower...
Flash Crash can develop at any time, a reversal to new highs
can as well. Depends on QM.
Trade Safe.
Closed Long Flip at Objective now CASH unto 1130 AM EST.
NQ . 618 in IntraDay traded and faded at 179.

NQ - Daily Entry / ES YM CLIf you review the Charts Published yesterday, you will find entries
for - YM ES CL was almost perfect into the SELL.
NQ, as it does - exceeded in Globex.
NQ's Pirfce Objective is 15943.5
It is important to Note - NQ, as insane as this may sound
can go on to make New Highs or at least make a failed
attempt, it is the strongest on a relative basis, it can occur.
It is possible, the Pelican may toss out some Fish, we simpy
do not know - the Sea-Bird is speaking today as is Yellen
the Fellon, as well other Fed Bullhorns.
We hold 4 MAR 2022 & 16 DEC 2021 - pressed in Globex as
Resistance traded first, spreads remain too wide for MAR
during Globex.
TQQQ, as well 6K with 3 Entries - the final 1K was a Flier when
the next level was front-run.
The ES nailed the 4667 Entry, hopefully, it was taken up here in
Size by Traders - We took a Small Entry of 6 CTs.
ES PO - 4554.25
YM - did the same, a run to the lower Entry was the SELL. No
Position as out focus is Tech.
RTY - smoked, No Position.
CL - 12 Sells at First Entry, TGT 64.40
VIX has the Apex to contend with and we believe it will be tested.
Any Pullback in the VIX will be bought, use it for entry into the
Retracements, 23.10s is the LIS.
VXN - Anxious, it can move around the board today... ultimately it
will breakout above 35, it's a game of patience, as Distribution won't
be able to contain what is ahead in terms of the need for Liquidity.
10 Year holds the keys to the Tesla, it needs to rapidly rise off the
Trendline Posted yesterday.
_______________________________________________________
Publishing Limits have been reached, so today's commentary will
be dripping in slowly.
Make no mistake, this is going to whipsaw into a very Large SELL.
144's to 377s will be tested on the Daily Charts.
________________________________________________________
CB Consumer Confidence is extreme in importance as it uses a
Larger Sample Size of 3000 vs 500 Fro UMich.
8 AM Bond Bid and Flight to Safety could push the Indexes over the
Cliff to Price Objectivres.

NQ - Daily Structure / V.4The NQ has been the Laggard to the Downside.
A break of Big 7 was required to indicate the Validity
of the Bearish Engulfing Candle.
APPL
MSFT
AMZN
GOOGA
GOOGL
TSLA
NVDA
All began to Sell on NYSE Open Friday, a shortened Day with
Volumes Sub Par.
_______________________________________________________
With Crude Oil absolutely being SOLD during the Globex Session once
the 24 O/N Session got going, it was clear we were in store for Lower
Prices.
Crude saw its 7th Largest decline - $10
The YM Confirmed the Reversal of the Trend with a +1100 Point decline.
Crypto declined.
Bonds became the Flight to safety Bid.
The Dollar Pulled Back.
Financial and Small Caps faced steep declines.
Breadth - Overall Breadth was unwell. We see many NYSE COMP Companies
down 50% - 60% from Highs. The NYSE Composite along with Crude Oil and the
Dow all provided a very large indication all was not well.
__________________________________________________________
Rate sensitivity for the NQ broke, as ZN ZB TLT all managed to be Bid out
of 8 AM EST causing the Dollar to retrace.
The math continues to grow more horrific in Bonds.
1.55% against a Real Inflation Rate (Adjusted 1980 Methodology) of 10.12%.
Decidedly low - by my Fuzzy math and data it is currently 17.34%.
For the purposes of the Bond Edifice, we'll use 10% and apply the adjustment
to the 10 Year Note.
9.45% assured LOSS every Year for holding the 10 Year Note.
7.99% assured LOSS every Year for holding the TLT 20 Year ETF.
8.02% assured LOSS every Year for holding the 30 Year Bond.
Pristine Wall Paper:
1 - 6 Month T-Bills - 9.95% assured LOSS.
This is the Win / Win Bond Hodlers assume will work itself out.
It will not.
YCC crosses the Rubicom. There is no turning back from this event.
The Republic goes Full Banana - Dirty Monkey.
__________________________________________________________
NQ is now on its own once again, at the Mercy of Jumbos, BlackRock
and VanGuard.
Delta Hedging has moved the VX Complex as large Bids to Protection
were initiated, there is nowhere else to hide, and these Instruments
were inhaled Whoelsale.
Thye took the VX Curve down into Settel and reversed thereafter, getting
their lower fills and quickly seeing 50%+ Gains on Protection.
Those offsides on VX who were selling Calls for income were wiped out -
this story is simply beginning.
All those off0sides on Bonds... Enormous losses.
"Stuff" had to be sold to offset in order to square losses and correct
imbalances in Margin. In this environment, SELLING begets further Selling.
Months of Gamma Levered Bets reversed, the final stages of the Blow Off
were completing as few actually wanted to Buy the Underlying, instead, the
Jumbos levered up - took gains and left everyone else Bag Holding.
The Fed was Mute - this unwind can continue for a few weeks, 2 to 3 at
minimum into the December FOMC.
We will see how it is all managed as it can turn sharply downward until
there is an assurance of a Back Stop from Jerry and the Kids at 33 Liberty.
Dissension has been growing at the FED with more than one half of BOG
indicating the Taper and Rate Cycle should begin sooner as opposed to later.
A panic selloff after the FSR could change up their Plans.
Every Bank from BOA to APM to CITI indicated assets are 20% to 50% overvalued
under certain Conditions. Mutations perhaps... who knows.
The Covid Cycle of abuse is quite clear.
_______________________________________________________________
This Week will be instructional.
It is difficult to imagine Margin Selling not encouraging further Selling. We have
barely begin to see the Cascade in Margin.
How dramatic this Sell Off becomes, will be determined this week.
Crude Oil can now trade down to 65 and then 60$.
We are going to reposition our Biotech and move back to Cash as quickly as possible.
It seems nothing will be spared and there are just a few Instruments in which to
find safety beyond CASH.
They are the cyclical winners which ... eventually are sold to cover losses on Margin.
________________________________________________________________
We will look at the 1 Hour Timeframe and review the Indications.
The Daily SMAs tend to provide support at the 34, with a potential Retreafement to the
21 SMA.
If this Fails it will be a very quick trip to the 89 / 144 and potentially the 377 SMA in a
few short weeks.
This will be another chart as Clutter tends to compound if too much Data is within
one chart.
For now, the Structure Count Indicated 8/8 to the Downside.

NQ - 1Hr / Continuation After Consolidation OR ReversalAfter an unprecedented move in Price... Something which has never occurred,
the record moves Up for the Daily Price EOD...
We cannot assume, there will not be further Upside.
___________________________________________________________________
Trading Probabilities is the Best we can do.
When presented with Opportunity... ie. A setup that favors our Trades/Positions,
seizing them is our Default.
Trading what we see, not feel nor project, we obey.
Timing trades can be extreme in difficulty when Operators have a clear advantage.
___________________________________________________________________
Managing RISK in this environment requires adherence to limiting DrawDowns
while maintaining the patience to permit the Trade(s) time to develop.
Managing Capital, our methodology requires Inversion Entry at Levels.
This permits us to be early, employing increasingly larger entries Price moves
against our Trade(s).
"Certainty" clearly does not exist.
___________________________________________________________________
At virtually any moment in time, Options Leverage can move Price well against
our Positions.
And with the Equity Complex functioning as the "Economy" - Risks compound as
the vested interest in keeping it higher and higher remains a clear threat to
Sellers.
___________________________________________________________________
QCOM is an excellent example.
The EPS was frankly disappointing.
The Net was down 5% - (Input Cost Driven)
QTC/QTL - Shortages provide Pricing Power - QTC up 56%.
QTL up 3%.
For now, QCOM is able to forward "Inflation aka Pricing Power"
The issue, this is waning... REV's up 12%
Costs - Up 36%
QCOM is now our 3rd Largest SELL Position.
Puts: 200: 140 - 180 (-16.7)
Underlying: 12.5 @ 158.12 (-100)
Our Hedge in Underlying was closed@ 164 (+47)
Net the Position is Negative (69)
On 9/9 we are fully exposed to the SELL.
If required, we will re-enter Hedge, but our Indicators suggest the
Gamma Squeeze is ending.
Large Gaps are below, when will they fill.
We have until January on Options, Shares, as much time as needed.
These are Positions, not Trades.
___________________________________________________________________
NQ's exposure to Tesla is 6%, how much did Tesla drag the NQ yesterday...
Not much.
___________________________________________________________________
What is working for Probability are the Issues we have outlined in prior NQ Commentaries.
The above Chart Illustrates in no uncertain terms what to do and where.
___________________________________________________________________
We will continue to Hold / Press into Wednesday.
It has the Potential to be an unusual reversal Day, a wider Range with a Lower Low.
For now, we are simply observing Price Chop and Wedge into the Break.
___________________________________________________________________
Within this Environment - Possibilities are endless.
Position: 61.2% into SELL.
Our Stop is well above Bar 8/9 and will balance 64.2% into BUY IF necessary to
Limit losses.

NQ - 4Hr + Macro / Gamma - Delta Accident - JPow Fools AgainThe Macro Data Calendar for Today:
Non-Farm Payrolls
Average Hourly Earnings
Unemployment Rate
Coupons - $8.425 Billion 2s to 4s.
______________________________________________________
ZN continues to Trade the Lower End of the Range.
The BOE Stick saved the US Treasury Market, although FED FUNDS...
Disagree - www.cmegroup.com
Oops... Again - www.cmegroup.com
Powell Blindsided everyone with the Taper while FED FUNDS...
Accident moving forward in TIME.
2x Ooops.
______________________________________________________
Our Thesis was the Federal Reserve would begin to move forward,
quickly forward to Increase FED FUNDS far more rapidly than the
Retail Trader/Investor anticipates.
This Thesis has been ongoing since JULY 2021.
2024 to 2023 to 2022 to now 2021.
We were Correct - 100% Correct.
Thereby creating a large Event taking the Equity Complex to its knees
and down to the 200SMAs, where they would find minor support for
a Counter-Trend, only to reverse and Trade to closer to the 400SMAs.
Nothing, and I am quite resolute in this Thesis, has changed.
The Probability has increased substantially - Exponentially.
______________________________________________________
Disagree?
Up to you, it is your Capital @ RISK.
We continue to mount a large Position in Options for the IMPENDING
reversal.
______________________________________________________
NQ will be in 8/9 today, the Price Objective we stated for the Profit
Target... was met during Globex @ 16424. SOLD NQ on a FR.
Resistance has Traded First.
______________________________________________________
I have been repeatedly Asked in PM @ TV why I am a "Bear" in this
Mania.
Answer: Continue to chase Gamma/Delta, we Fade it, there is no
Top Picking is ongoing, there is, however, an acute understanding of
how this ends, and it will.
Positioning for it, taking heat... taking losses, all part of the entry.
We hold no Underlying Sells in the NQ ES YM RTY.
We do Hold Derivatives in the QQQ SPY SMH TQQQ TSLA QCOM
TLT AMC AAPL and continue to build on these Positions from
November to January.
Top pickers have at it, wading in is more our style and we know
how to do so with a minimal negative effect - Hedge Underlying.
______________________________________________________
We see a very large Market Dislocation directly ahead.
Agree/Disagree - immaterial.
It is our Trade Plan and it is not changing, not remotely.
______________________________________________________
The unwind will be of extreme velocity, most will indeed miss
the majority of the Negative Price Actions.
Presently - 32% Positioned into the impending SELL.
______________________________________________________
Trade Safe everyone - HK

NQ - Time again, with 1 ExceptionToday was unusual, the last hour Ramp to new Highs did not complete.
1st Day in 3 Days.
NQ's RSI is overheating, that said, there is room left on the Burner.
They attempt to Cool it off by Ranging it during Globex in order to
Setup the shove higher again tomorrow.
Measured Move Indicates @ 16681 Price Objective, 16500 will have a
large reaction, after today's extension, failed to reach 16456.
*** Of Note, the VX Complex remains completely controlled. As the
VXN was trading its Highs today on several Occasions... The NQ was
at or very close to its Highs.
Generally speaking, this usually occurs prior to reversals as the ARBs
eat themselves, gorging on the Prop and HFTs competing for Positon.
Trading the Reversals on TIME works, it requires waiting for the Setup
to arrive, but it does work for now.
Friday's are a different animal altogether.
The FED was Johnny on the Spot today with $6.24Billion in Cheese.
____________________________________________________________
NQ RSI Is of concern as are the large Divergences forming.
Patterns closely resemble those prior to the most recent 7% decline.
The Structures can complete Monday or Tuesday.
This Toss Over has been interesting to manage, SELL out Months while
Buying Front Month Underlying - not the Type of Trading we enjoy, but
take what we are provided.
____________________________________________________________
The Equity Complex is a complete Mess, driven by greed and Options.
QCOM reports a 56% increase during the Chip Shortage.
Cost of Sales continues to rise... CASH diminished again.
Unsure what they are selling, as Outsourced production to TSM and
Samsung is well behind on Deliveries.
Fraud, Deceit, and Lowered Guidance.
I find Q3 EPS, extraordinarily Suspect on all Levels.
Lose $6 to $8 Billion in Sales, but beat lowered guidance...
Call BS on the frauds, not that it'll do a lick of good:)

NQ Weekly - Lower Boundary TestedZooming out to the Weekly TF - Pirce tested the lower Channel Boundary @ 14367.
Price is not trading between the .500 and -.382 @ 14882 and 15004 on the 4Hr as
illustrated in the Prior NQ Observation.
The 4Hr draw which lines up is from the Globex Highs at 15399 to the Lows @ 14367,
it is working for now. We often need to switch up TF's depending on the type and
structure of the rebound.
All the Oscillators are deep in the Negative Region.
The EMAs/SMAs for the 21 / 34 / 50 is not too far off as indicated - just under 15K to
slightly over.
The NQ appears resolute in filling its overhead gap over the 21/34/50 - but can it?
It appears they are attempting to push Price up ahead of all the impending Macro
Data.
We completed the Price Objective at the lower boundary, for now, patience as to
where this competes.
They are desperate to flip the Bars to green...
Let's see how far this goes, prior to rolling back over.
There are far too many negative Data Points, Political Risk, Geopolitical Risk, Global
Economic Risks and EPS Risks to not have this RT fall apart.
The longer this takes... the greater the Risk to downside that could exceed 15%, the
NQ Came off roughly 5% from the Highs.

NQ - 10Yr Trigger @ 1.545We indicated the SELL for NQ would return once the 10 Year Note Yield Tripped the
Line in the Sand @ 1.545.
Here we are, after a 100 Tick closing SELL during Black Betty Hour... the Globex
AL.Ghouls were unable to halt the decline as it gained momentum overnight.
TLT will wake up in the 142s on its way to the 130s, ZN is attempting not to take
the dive, it will eventually trade catch up.
For months we indicated Rates on the 10 Year Note would be the catalyst as the
Bond Market began to revolt and Price-In Inflation and a great many other issues.
If you are new here, please do not assume, go back, and read the prior commentary.
As the Events we have previously outlined continue to unfold, Yields will increase
their ROCs, placing immense pressures on the Equity Complex.
The Markets are Broken Arrows, waiting for detonation. And yet there remains a very
healthy does of participants who remain stuck in the prior 18 months.
They are simply the Energy needed for further downside to Price Objectives which
have been discussed repeatedly - consistent visitors know them.
We opened our NQ SELLs as the 10Yr Appeared as if it would Trip the LIS from yesterday
evening.
PuckBunny contacted me via PM as she SOLD watching the 1.545 Level break. Nice work
young Lady, congratulations.
Hopefully, you joined us.
We closed our NQ STOs @ 14436 earlier and are back to 96.26% CASH, waiting for the next
entry.
Until Friday, it would appear Retracements are giving way to the next move down as the
Lower Trendline now resides @ 14011 with the next Price Objective @ 14197.
As we indicated, VX would accelerate and with it, Ranges would expand.
We saw Price Dip into 14725 .50% RT, but fall well short of the .618.
14588 is the 50% and the .618 @ 14627 from the Highs of yesterday to Lows.
The continuation of the Trend will depend on this morning's Macro Data.

NQ- Rate Sensitive ComplexAlthough the correlation between Rates and Financials has broken
due to the steep decline in lending and CASH Hoarding... The DX
and 10Yr Yields will drive the NQ Price Levels.
NQ is a hot mess at present.
Indecision is the undercurrent.
We have been SELLERs all week.
Geopolitical RIKS is highest for NQ as China is shuttering its
Finances and Economy from outside participation.
It is only a matter of time before retribution actions are taken.
And Taiwan... imagine the issues building there over the coming
months.

NQ Top Cycles Lined Up PerfectlyMy NQ Cycle analysis lined up perfectly with this move. This rotation should keep the NQ between 7300 and 7400 for most of the next month. There is a chance the NQ could fall further, but I doubt it.
Pay attention to my analysis posts and follow me if you like my work. I'll keep you informed of the markets as I see them going forward.

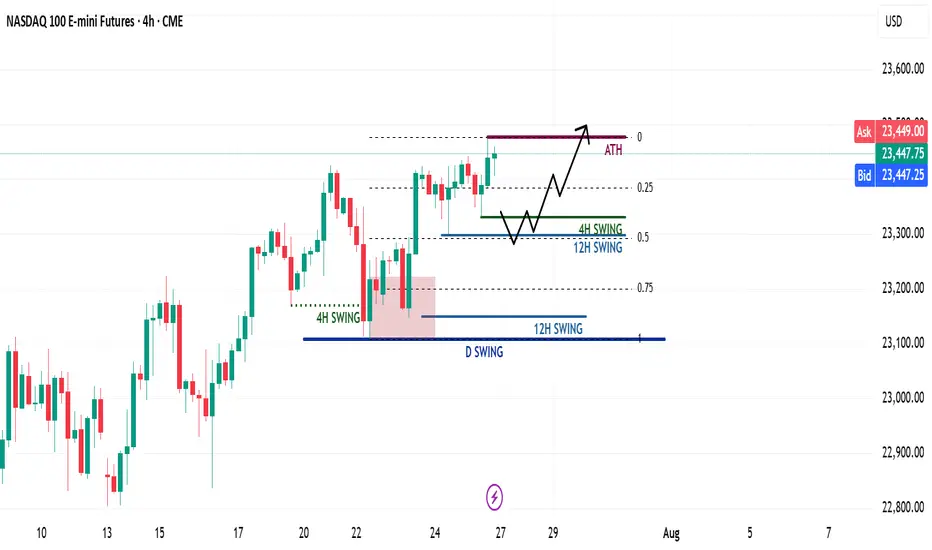
NQ Weekly Recap & Gameplan – 27.07.2025🧭 Market Sentiment
The overall sentiment remains bullish, supported by:
• Lower inflation data
• Trump’s policy shift toward aggressive rate cuts
This creates a strong risk-on environment across U.S. indices.
🔙 Previous Week Recap
• NQ continued its price discovery phase
• Price swept 4H swing liquidity and triggered a market structure shift
• A new 1H demand zone was formed after MSS
• Price revisited the 1H demand and launched toward new all-time highs (ATH)
• While I anticipated a deeper retracement, ES provided the cleaner pullback
• I executed longs on both ES and NQ using SMT divergence (ICT SMT concept)
📊 Technical Analysis
My bias remains bullish as long as the higher timeframe structure holds.
For the upcoming week:
• Watching for either the 4H or 12H swing high to get swept
• Ideally, a retracement toward the 0.5 Fib level, which aligns with my bullish discount zone
• A clean liquidity sweep into this zone could act as a launchpad for the next leg higher
⚙️ Trade Setup & Execution Plan
Entry Strategy:
• Wait for a new 1H–4H Market Structure Shift
• Identify the new demand zone post-MSS
• Look for price to return to the zone for a long opportunity with LTF confirmation
Trade Management:
🎯 Target: New ATH
⛔ Stoploss: Swing low of the 1H–4H demand zone
📌 Chart will include Fib levels, MSS zones, and execution trigger areas.
Let me know your thoughts or share your plan below.
Happy trading!
High Probability Short Position NQTP: FE 4.618
SL: Swing high
Size based on your risk management strategy
