CVX - resistance and ichimoku breakout + stochastic divergence!CVX broke out of the resistance zone and broke out from the ichimoku cloud and is now, in my opinion, ready for some upside
the stochastic bullish divergence is also signaling a long position
Search in ideas for "stochastic"

USDJPY - RSI & Stochastic Oversold! - and other confirmationsHi Traders!
The market is in a strong Downtrend.
As you can see the market also reached the Support.
The momentum of the price decreased too.
The market is at the moment in a descending wedge.
The Trading Idea is simple: Just wait for the Break of the Upper Trendline.
We have these confirmations now:
RSI is oversold
Stochastic is oversold
Market at daily Support
Decrease of Volume after High Price Action
The faster the market reaches to a S&R Level,
the deeper it bounces back (in usual situations).
We recommend to trade the Breakout with a wide SL.
Thanks and successful Trading :)!

MNKD - Double bottom stochastic divergencePenny play - double bottom stochastic divergence. If you get in on the way up and use a tight stop this could work out nicely. If things get going, they will move quick.
Buy: 3.50
Target: 3.76 - 4.37 (7.43% - 24.86%)
Stop: 3.30 (-5.71%)

WHR - Stochastic Divergence Gap FillWhirlpool (WHR) has stochastic divergence on channel line support with a gap above.
Buy: 166.34
Target: 171.00 - 178.53 (2.79% - 7.33%)

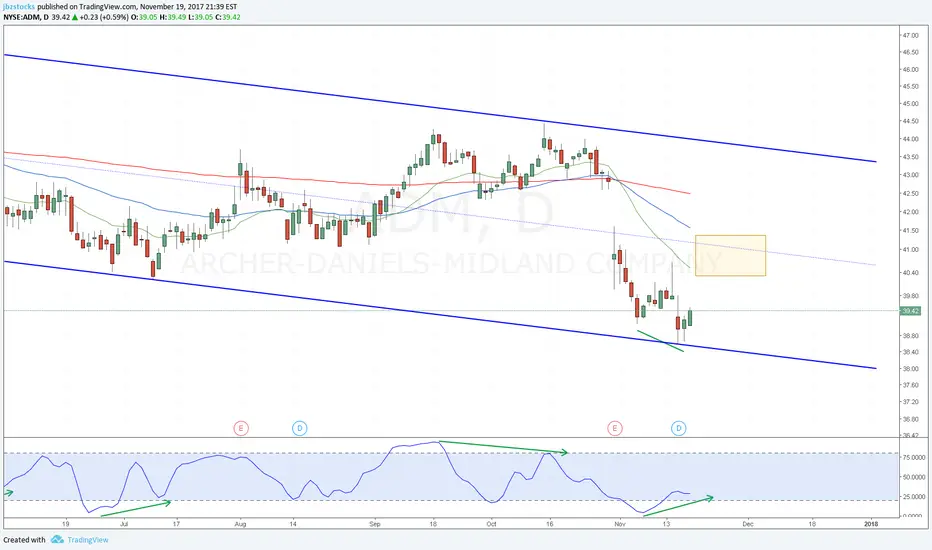
ADM Stochastic Divergence Channel Line BounceArcher-Daniels-Midland (ADM) has stochastic divergence on trend line support. There is a gap to fill above the target zone that could lead to an extra 2.5%
Buy: 39.65
Target: 40.31 - 41.37 (1.68% - 4.35%)
jbzstocks.com
@jbzstocks
DISCK Stochastic Divergence Channel Line BounceDISCK has a coiled up stochastic with divergence and has good price support at this level.
There are two setups here, one for the Daily time frame and one for the 15 Minute.
Daily - Divergence Setup
Buy: 16.50
Target: 17.18 - 18.53 (4.12% - 12.30%)
15 Minute - Bull Flag Setup
Buy: 16.50
Target: 17.18 - 17.60 (4.12% - 6.67%)

Channel Line Bounce Stochastic DivergenceThis one came up on scans. It's in a well defined channel, and has stochastic divergence on the (9,3), and just got an upgrade to "Outperform" from NYSE:RJF . Ideally, it will come out of the flag and move right to the top of the channel and into the profit zone.
Buy: 18.55
Stop: 18.30
Target: 18.99 - 19.80 (2.37% - 6.74%)

Ascending Triangle with Potential Stochastic DivergenceNeed a green day to move the stochastic up and confirm divergence. This is a buy when it crosses yesterday's high.
Buy: 88.90
Stop: 87.40
Target: 91.71 - 94.33 (3.16% - 6.11%)

Falling wedge, stochastic divergenceQuick falling wedge with stochastic divergence could play out nicely here.
Buy 56.97
Target: 58.71 - 61.53

NZDUSD pulling back to trendline, see daily stochastics!After breaking a major trendline, NZDUSD is now retracing back to probably retest this. We can get a good +80 pips movement from this pullback before it drops again. The Stochastics on the daily chart is ready to shoot up.

Selling GBPAUD midterm - with "Stochastic Real Deal indicator"Selling GBPAUD following Stochastic Real Deal custom indicator
The indicator is available for a trial here
Just ask for access in comments

Summer Uptrend push shown with StochasticsWe do see some volatility in the short term with the market not understanding which way a break will come. However the investor with a longer term view should take into account the weekly charts where stochastics are showing a repeatable and inevitable uptrend in the making. The Summer period is looking to provide the next significant uptrend starting within the next few days!

Stochastics broke the downtrend lineStochastics broke the downtrend line before the actual price does. A move to the upside is expected. Long @ 0.7425
1st target @ 0.382 - 0.7490
2nd target @ 0.50 - 0.7540

Stochastic Divergence - Identifying DivergenceStochastic Divergence is one of the most powerful leading indicators of price. Convergence will show price and stochastic oscillator moving towards each other. Divergence show the price and stochastic moving away from each other.

GBPJPY TF H4 (DIvergence Stochastic + MIL level)Selamat siang rekan-rekan. Di sore ini saya mencoba menganalisa menggunakan metode MIL “Market Interpretation Candle” kembali. DImana kali saya mencoba menganalisa pergerakan GBPJPY dalam timeframe 4 jam. Kita memadukan indikator stochastic dengan MIL.
Dapat kita lihat bahwa saat ini pada timframe H4 kita temukan Divergence Low antara chart dengan indikator stochastic periode (5,3,3). DImana harga beranjak dari level “Golden Entry” pagi tadi, sehingga dapat kita prediksi bahwa harga akan mencoba naik menuju level “Golden Target”nya. Dengan menunggu konfirmasi apakah level tersebut nanti dapat di breakout oleh candle H4.
Jika terjadi breakout, maka harga akan mencoba terkerek naik lagi menuju zona reversal. Dengan target pada “Reversal Level 2”
Mungkin sekian ide dan opini saya dalam analisa teknikal kali ini. Jika rekan-rekan sependapat dengan saya, jangan lupa meninggalkan jempol dan komennya “Please Leave your comment and LIKE aswell”. Terimakasih dan salam sukses selalu untuk kita semua.
Best Regards,
Don-Hawkish

Stochastic and MACD HSI strategyStochastic and MACD HSI strategy. With Stochastic as main and MACD as filtering for singal noise

Btc monthly stochastic rsi crossing 50Each time btc stochastic rsi moved above 50 from lows, it rallies before the btc halving (purple) and dips to higher low during the halving

Stochastic Pro works on EUR USD 15 MStochastic Pro it allows you to track the price reversal zone more accurately and helps you avoid false signals that are given by standard indicators. Stochastic Pro can be used both on Forex and binary options . the main thing is to wait patiently for a good signal. if you have any questions, please contact me in private messages.

BTC SHORT - Stochastic overbought & price hit fibonacci 0.382 BTC SHORT Target 58xx
Stochastic overbought & price hit fibonacci 0.382

Reversal on stochastic bullish divergence Falling wedge coninciding with stochastic diverge on the weekly and edge of supply zone. Long-term bottom seem relatively close makes for high probability northbound move.

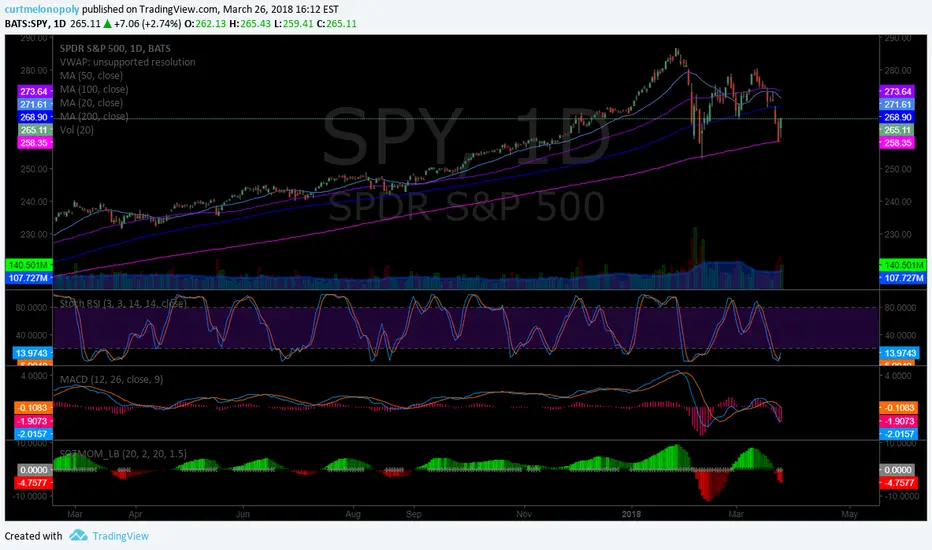
$SPY 200 MA bounce with Stochastic RSI turned up. Chart Notes.$SPY 200 MA bounce with Stochastic RSI turned up. Watching MACD and SQZMOM. #swingtrading #trend
It looks like it could turn and retest the 200 MA really soon again, however, taking a long off the 200 MA isn't such a bad strategy if you can get the MACD to confirm
Register to free email list for trade set-ups, webinars, special events: compoundtrading.com
Website: compoundtrading.com
Free chat room: discord.gg
Subscribe: compoundtrading.com
Twitter: twitter.com
Lead Trader: twitter.com
Tradingview: www.tradingview.com
Facebook: www.facebook.com
StockTwits: stocktwits.com
Email: info@compoundtrading.com
Platform: Algorithm model charting for $SPY, $VIX, #OIL, #GOLD, #SILVER, #Crypto ($BTC Bitcoin, $ETH, $LTC, $XRP,) $DXY -US Dollar and Swing Trading Newsletter. Live trading rooms for daytrading and oil traders. Private coaching and live alerts.
Multi time frame StochasticThe idea for this is quite simple and no rocket science necessary to make decisions. This is to help you (hopefully) to anticipate instead of participate.
The thick yellow line is the default Stochastic (14,3,3); the shades of blue are lower time frame lines while the shades of red are higher.
When the 17 strands form a rope it's time for action, buy or sell. When the rope disentangles be cautious and/or exit.
Another good place to act is where the strands form angles (peaks & valleys) but not necessarily a nice rope yet. Check that you are in the overbought/oversold areas when actioning this.
When the rope forms a fishnet, beware, you will get caught! Hopefully you are out by then and waiting for the next peak/valley/rope to form.
You can also change the time frame to differ from that of the chart's time frame if you want to study or test strategies.
Use this with other indicators (Bollinger Bands, MA's) to help your decision making.
Hope this helps.

