Stochastic StrategyStrategy:
Buy:
-Stochastic goes back from oversold to middle
-RSI goes over 50
-MACD crosses up
Sell:
-Stochastic goes from overbought to middle
-RSI goes under 50
-MACD crosses down
Settings:
MACD: 8, 21, 5
RSI: Line at 50 instead of 70 and 30
Stochastic: Alert function
have fun :)
Search in ideas for "stochastic"

Stochastic and RSI of BTC/Euro + China news
Hello and welcome back to a quick update from my previous post.
I will start the article by listing any changes made from previous chart, followed by my conclusion.
Below the conclusion I will try to "defend" my conclusion and go more into details for those who are interested in: the why.
Finishing off with the China News promised from the title.
Changes
Fine tuned the Trend lines.
Added RSI
Conclusion
Neither the RSI, Stochastic or volumes are giving any indications that we will break out of the triangle on the upside during this week.
However, there are two large news that can impact the market in any way: China new Digital currency and EU banking draft on digital currencies.
These two news are wild cards and will hit the market one way or the other.
I am still holding off my trades as of now.
The why
I added RSI to be able to compare it to the Stochastic, because I wanted to see how much they eventually differ. Stochastic are better when the marked is trading side-ways and choppy, whilst the RSI thrive during trending markets. The difference between the two will give me an indication of the volatility where I would lean more towards the stochastic as "truth", since we are in a side-way market right now.
The Stochastic is under its moving average, which is not a good sign, and nearing its bottom at index 20. I spot no divergence on the stochastic.
The RSI is not telling anything comforting as far as I can see, and it is not different from the stochastic (the pattern, high and low and trend line although the actual values differ).
I see no technical indications on the chart that this will form a break out this week on the upside, but it seems that the momentum is rather sluggish and have higher probability to go down to next support line.
With this in mind and the two news mentioned earlier, I find it is too risky to make any trades at the moment.
To balance best Vs worse in case of no trade.
The best case is that the price go down and I do not lose money but gain a buying opportunity.
The Worst case is that the price goes up and breaks the triangle. However, it is not likely it will break the triangle by a lot, and stronger possibility that the previous resistance is the new support. If that will be the case, I would not have missed a lot of possible profit and something I would be more OK with than the opposite.
News
China is buying back A LOT of gold and they are this month releasing their digital currency. This can mean one of two things: The gold is to back up and strengthen their FIAT, or this gold is used to back their digital currency.
If the latter, then what will that effect be on the price of bitcoin?
Even though the Chinese digital currency is HIGHLY centralized and controlled, and no where close to compete in BTC for availability to the people. It will however be a very strong currency in the existing financial institutions. Venezuela did try to do something similar with their oil backed currency, but let us not compare the financial power and influence of Venezuela and China ;)
Personally, I think this digital currency of China will trigger a wild fire.
Other countries will try to back their own currencies with gold, and start to seriously look into creating their own digital currency (EU is already making that draft).
I believe the price of BTC will take a small hit.

AAOI - Falling wedge breakoutStochastic divergence at the breakout point of a falling wedge. 3 days late, but there is more upside. The stochastic is at 63.6517 so we still have some upside before completing the rotation and ending the signal. Combined with the falling wedge pattern, I expect a move up to the 200ema (red).
Buy: 46.48
Target: 49.50 - 52.52 (6.50% - 13.00%)

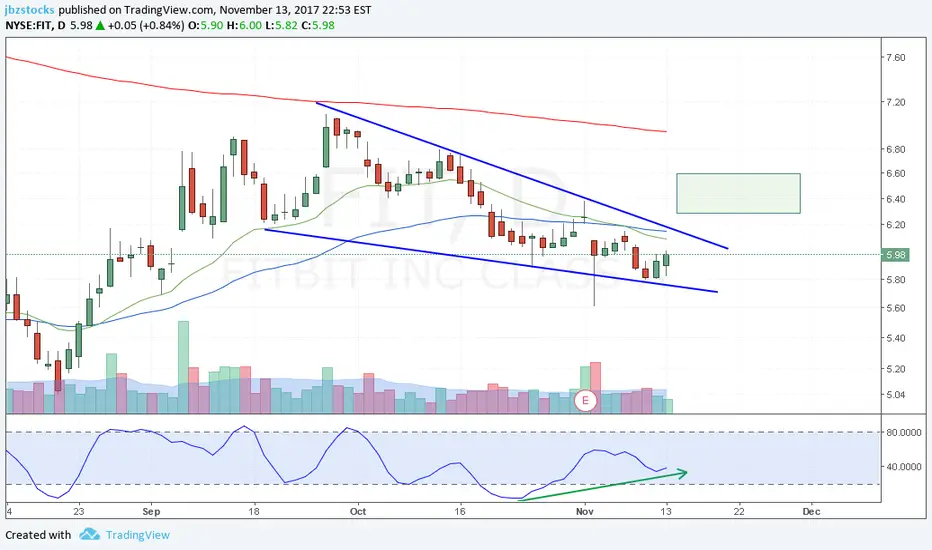
Stochastic divergence at the breakout point of a falling wedgeBuy: 6.10
Target: 6.29 - 6.60 (3.11% - 8.20%)
Stochastic divergence at the breakout point of a falling wedgeThis is a textbook divergence. Earnings are scheduled for 11/28 so we want to be out of the trade by then.
Buy: 29.05
Target: 30.31 - 32.29 (4.34% - 11.15%)
Stop: 28.30

Getting ready for the bounceNice channel formed, anticipating the bounce with confirmation of stochastic... thoughts?
Stochastic divergenceThe idea is that at this moment there has already been a divergence in the stochastic. Good chance to go short.
Divergence in TDMACD in 4h.
What I would really like to see is the pair force again the 61.8% fibonacci point and respect that point, if that happen I go short. If you do not respect this point you can reach 78.6%.

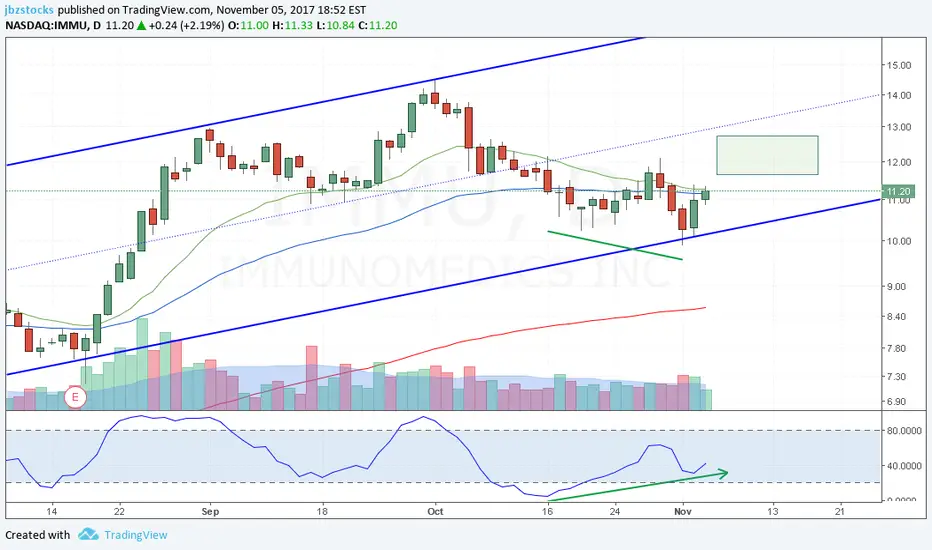
Stochastic divergence channel line bounceIMMU has set up for us once again. This is a nice divergence setup where you can see clear lower lows in the price and clear higher lows in the stochastic. Wait for a break above the recent highs and get in at/above 11.40.
Buy: 11.40
Target: 11.64 - 12.18 (2.11% - 6.84%)
Stochastic Osillator Indicating Price Increase Soon.%K is about to cross above %D on Stochastic. Shorts will start to cover and bulls will start to buy driving price up.

Negative Stochastic DivergenceStochastics keep making lower highs while the price is making higher highs. This is a negative signal. Take your profits people!

Stochastic weekly buy for a month or soAs I believe this pair has nowhere to go so Im waiting for it to top itself even if it takes a whole two or three months, not saying intraday you can't make money but it won't be that easy for you have to take out key levels/mirror levels to get this correct or a chance at making a 7/10$
So what's being looked for in MN IS a M formation (half n bat or normal)to form n Stochastics to hit overbought areas before I take my initial idea as we see bears are incontrol by the signs of wicks found in this near term range it's formulating . Right now I'm just giving views that people won't see coming just like nzdusd n AUDUSD +audjpy I was on about reaching old positions people thought would never been see but what happened in this near future it all happened 😏😁so again here's a nice view of what's to happen. I do clear chart analysis before I dive deeper into research and candlestick formation ... I don't like counting waves in a choppy market for it's hard to know what waves or corrections we are in. I can see some bearish fall it indicates on monthly timeframe as price shows its narrowing to bursts like a compressed spring . That's why I'm not interested to risk any sort in it unless a find patterns that guarantee money

Stochastics divergenceThere is a divergence between stochastic and price, witch very often results in a turn.

Zoom 30% profits, bottomed out Stochastics and 90MA Stochastics on Weekly and Monthly look bottomed out, as well as touching the moving average 90 base line on the daily chart, indicating a continuation of the bull trend.
Limit order $380 and hold for profits of 30%, then sell a portion and buy back lower.

about stochastics parametersstochastics parameters %k period , %k slow,%d type and %d period values i need to set

Gbpjpy (stochastic rsi + order block )
**Stochastic RSI:**
Stochastic RSI is a momentum oscillator that measures the level of RSI relative to its high-low range over a specific period of time. It is an indicator designed to identify overbought and oversold conditions in a market.
1. **Stochastic RSI Formula:**
\
\
where RSI is the standard Relative Strength Index.
In this context, traders often use values like 14 for the RSI period and 3 for the stochastic period.
**Order Block:**
An order block is a concept from price action trading. It refers to a block of price movement where significant buying or selling activity has occurred, leaving behind a level that is likely to act as support or resistance in the future.
1. **Identifying Order Blocks:**
- Order blocks are often found after strong trending moves.
- Look for areas where the market has slowed down or reversed significantly.
- The order block is typically a consolidation or a small range of price bars.
**Stochastic RSI + Order Block Trading Strategy:**
1. **Trend Identification:**
- Determine the overall trend using other indicators or trend analysis tools.
- This strategy is often more effective in trending markets.
2. **Stochastic RSI Setup:**
- Use the stochastic RSI to identify overbought or oversold conditions.
- Look for potential trade signals when the stochastic RSI is in the extreme regions (e.g., above 80 for overbought, below 20 for oversold).
3. **Confirmation with Order Blocks:**
- Look for order blocks that align with the identified overbought or oversold conditions.
- The order block should act as a support (in oversold conditions) or resistance (in overbought conditions).
4. **Entry and Exit:**
- **Long Entry (Buy):** Consider entering a long position when the stochastic RSI is in oversold territory and supported by an order block. This suggests a potential reversal to the upside.
- **Short Entry (Sell):** Consider entering a short position when the stochastic RSI is in overbought territory and faces resistance from an order block. This suggests a potential reversal to the downside.
5. **Risk Management:**
- Set stop-loss orders to limit potential losses.
- Consider using a risk-reward ratio to ensure the potential profit is worth the risk taken.
6. **Monitoring and Adjustment:**
- Regularly monitor the trade for any signs of reversal or trend continuation.
- Be ready to adjust the strategy based on market conditions.
Remember, no trading strategy is foolproof, and it's essential to practice risk management and adapt strategies to changing market conditions. Additionally, backtesting and simulation can help validate the effectiveness of the strategy before applying it in live trading.

STOCHASTIC RSI - INDICATING POSSIBLE BEGINING OF NEW BULL CYCLE Vertical analysis of BTC paired with the stochastic RSI on the 14-day chart.
Key
- Yellow boxes = represent bear market/bear prices
- Thick green line on stochastic rsi = bull market resistance
Taking a look a historical data this method has proven its self as a very solid way to predict both bottoms and tops of the market cycles(although much better at predicting trend directions rather than exact dollar value bottoms/ tops) and thus we are able to sue this analysis as part of our overall direction analysis in whether we expect a further upward on downward continuation from here. As with all analysis, one technical analysis alone cannot give you all the info you need to accurately predict the market direction but this analysis lays the basis of many further possible predictions.
Looking at the chart we can see the bear markets reflected as yellow boxes on the bitcoin chart and this is reflected on the stochastic rsi as well. While the stochastic rsi is below 20 we have historically been in either a full-blown bear market or a period of strong market consolidation, just as we have seen in the last few months. We can see every single time we manage to have a positive cross below the 20 stoch RSI we see a strong move upwards (which has held true to the recent 63% increase on BTC). Furthermore, a break over the 20 stochastic RSI has historically shown the beginning of a new cycle upward + confirmation that the bottom has been seen (this is what we are currently seeing play out)
Going off this chart alone I would assume this move will continue after this current small healthy correction and we will see a strong move to new ATH for crypto.

Stochastic RSI strategy for the Dax using emaA strategy for the dax using stochastic on Relative strength index and exponential moving averages.
I used bars on this chart as opposed to heikin ashi so at first glance this seems less optimal than the Dax ema stochastic trailing points strategy but this strategy outperforms the Dax ema stochastic trailing points strategy on heikin ashi.

Bitcoin 4Hrs. 9/7/17-Stochastic and volume support hint?Stochastic ocillator level went out of the overbought area (below 80) for the first time on august 6/8/17 at 23:00 P.M . It eventually got back over 80 and the uptrend continued for a few hours.
On todays lowest low (so far) there was a a big price dip that reached ($3176.52) wich was partially bough up by the bulls but still ended closing down bearish (large wicked bearish candlestick).
It was quite a dip, and it it just happened to find support at that same August 6 first stochastic crossing down 80 price level ($3176.52).
The Stochastic crossed down for the first time in an uptrend above both S.M.A's and with previous high buying volume so there was not real reason to short right away, the thing is that the uptrend had been rolling up for several hours, it was a big uptrend and that was the first time it lost buying pressure and it did so at the same price level as todays lowest low which is the first time we have had that much selling pressure (volume).
Its just a curious thing, and it could very well be just a coincidence, either way i will keep an eye on that $3176.52 usd price level as a good support level for the upcoming hours.

ULTIMATE Strategy : Huge profit ratio : WATCH THIS**Hello traders !
My name is Alex and Im a 21 years old trader and business man from Canada.
For the last 3 months i've work on finding the perfect stochastic/rsi combo on multi time frame .
I've found and backtested a lot of system using 3 to 8 different time frame stochastic/rsi at the same time .
Some of these system are giving me a 75% win ratio with R/R : 1 , without** any other technical analysis . (584/786 trade test on 6 months , 10 major pairs , specific TP and SL ) -- Forex & Oil
But when we add these system with a technical analysis ( Fibonacci , trend , support , etc.. ) , It's another game : huge profit ratio , small or no drawdown & unreal risk/reward.
By following me you will receive some good technical analysis wich I use in combo with alot of different RSI/stoch system .
If you want to trade this strategy by yourself I recommand that you practice in demo before .
The indicator is CM Stochastic Multi-TimeFrame , thanks a lot to the creator ! ( See in related ideas )
Otherwise if you want some additional information you can contact me in private.
If wou want to thanks me , please like & follow .
Good trading !

Stochastic of Exponential Moving AverageHi traders,
This indicator a classic EMA with a smoothed Stochastic oscillating around it, using the EMA as midpoint of the Stochastic oscilator.
It can be used as an overlay on your chart using the EMA as support and resistance or as an independent indicator under your chart.
You have to trim the width of the Stochastic depending on the value of your asset, so USD/JPY=1 and EUR/USD=300.
This is a great trend following and momentum indicator.
Cheers, Indicat

AUD/CHF shorting signsSimilar to AUD/CAD, AUD/CHF is setting up for a short opportunity with the following in view:
- inside bar following high test bar in pull back to 50ema
- price rejection at resistance at ~0.8210
- price retraced to 0.618 Fibonacci level which coordinates well within proximity of resistance at ~0.8210
- Stochastic and RSI in overbought territory
- Stochastic and RSI hidden divergence (bearish trend continuation)
entry - below inside bar
stop loss - above mother bar (above previous high test bar)
target - previous swing low at ~0.7830, or lower

Stochastic Oversold, Scalping OpportunityAnalysis:
On the 15-minute chart, ASX:FHE ’s Stochastic oscillator is oversold below 20, indicating potential for a quick bounce from $0.00000079. The price is near the lower Bollinger Band, reinforcing the setup. A move to the middle band ($0.00000083) is plausible. Low liquidity warrants tight stops.
Actionable Insight:
Scalp long at $0.00000079, targeting $0.00000083. Stop-loss at $0.00000077. Exit within 1-2 hours due to volatility.
Chart Setup:
Timeframe: 15-minute
Indicators: Stochastic, Bollinger Bands
Levels: Target ($0.00000083), Stop ($0.00000077)

STOCHASTIC RSI GLANCE VIEW LL/HHHere we see the BULLS are in control. Safe cross over the 30 mark. If we go back in time, follow with me the LL and HH from the candles. View stochastic rsi for LL HH for guidance. Now do you see a double top! Reads BULLISH REVERSAL.
Later I will make an idea on a 2MO TF to unveil the candle countdown, color, wicks, with stochastic rsi.
