I'm gonna trust the stochastic on this one!We are at a support line which was created a week ago. The crossover of the stochastic indicator is ready to happen. I see a pretty good buy here.
Search in ideas for "stochastic"

Timing Mkt Entrance from RSI, Stochastic & Bollinger BandsI am eager to buy this stock because of its strong financials, its strong dividend, exemplary stewardship, and its current valuation, which is significanlty less than its fair value estimate (~$21/share current, compared to ~$29/share est. fair val.).
However, due to its recent price increase I am not confident to buy this stock now because I have a gut feeling that this stock will decrease in the short-term, thus minimizing my prorfits. Furthermore, with the market being as high as it is, I would like to mitigate the effects of any impending stock market slumps. Many believe that another crash is imminent, and I dont want to be caught in a situation where I paid a price for a stock that it may not reach again for several months. This will tie up valuable income that could otherwise be used to make bargain purchases should a stock market slump occur.
My analysis of this stock is as follows.
I first indicated the prolonged overbought status of the RSI indicator, further confirmed by the stochastic indicator beginning in middle-to-late November.
Then, I took note of the repeated top-Bollinger band penetration by the price signal, beginning in the first week of November, and continuing until mid-December.
Finally, I looked at the volume oscillator to look for signs of divergence. I know that if strong upward moves are supported by a strong positive shift in volume, that the current trend is likely to continue. However, I know that if a strong upward move in price is backed instead by a strong negative shift in volume, that a price reversal may soon follow.
Further to my point about volume movement, I observed that the volume oscillator's value at the close of December 11 was ~-4%, and more, that the rate of change of the volume oscillator was decreasing. This is especially apparent in the DEMA-9 of the volume oscillator signal. Since volume is an inherently noisy signal, especially in the 4h chart used in this analysis, I prefer to analyze a smoothed, DEMA-9 on the volume oscillator instead. This makes it more straight forward to assess volume movements and not be distracted by strong peaks and valleys seen in the un-smoothed signal. Thus, I anticipated that a further volume decline would ensure, despite the fact that the price appeared to be increasing rather strongly (but deceivingly so).
I thus held off on buying this stock on November 24, where I began my analysis, despite my strong urge to do so given the attractive price increase.
I am not certain when I will buy this stock, as the point I made about an imminent market crash is still valid. However should the price continue to decline significantly - the current decline sits at -2.3% in 3.5 hours since mkt open - it will look much more attractive to buy at that time.

EUR/GBP - BEARISH RSI DIVERGENCE | STOCHASTIC & 61.8 FIBONACCI
EUR/GBP has pushed upwards and retraced considerably after being sold off for the past few months.
A strong sell signal has formed via the RSI divergence. RSI has been printing lower highs with price printing marginally higher highs, thus showing waning strength.
Stochastic is strongly overbought and crossing over as further confirmation.
Macro 0.618 fibonacci resistance has been touched and failed to be breached on a second attempt now which forms further confluence.
All of the above yields a considerably strong reason to open short position with a target of the strong volume level of 0.903.
Stop will be placed in and around the region of the 0.92 level.

Take out ATH this week what does Stochastic revealNOT ADVICE. DYOR.
The key is only a one hour bar over 95 on the Stochastic - no more. Then check back odds how performs in that week and next. CAVEAT: Short sample size based on 2020 statistics only.

PFPT, Stochastic Oscillator left the overbought zone on Nov 18This is a signal that PFPT's price trend could be reversing, and it may be an opportunity to sell the stock or take a defensive position. Tickeron's A.I.dvisor identified 62 similar cases where PFPT's stochastic oscillator exited the overbought zone, and 52 of them led to successful outcomes. Odds of Success: 84%. Current price $98.71 is below $100.68 the lowest support line found by Tickeron A.I. Throughout the month of 10/19/20 - 11/18/20, the price experienced a -11% Downtrend. During the week of 11/11/20 - 11/18/20, the stock fell -3%.
Bearish Trend Analysis
The Momentum Indicator moved below the 0 level on November 18, 2020. You may want to consider selling the stock, shorting the stock, or exploring put options on PFPT as a result. Tickeron A.I. detected that in 69 of 94 cases where the Momentum Indicator fell below 0, the stock fell further within the subsequent month. The odds of a continued downward trend are 73%.
PFPT moved below its 50-day Moving Average on October 23, 2020 date and that indicates a change from an upward trend to a downward trend.
The 10-day Moving Average for PFPT crossed bearishly below the 50-day moving average on October 29, 2020. This indicates that the trend has shifted lower and could be considered a sell signal. Tickeron A.I. detected that in 11 of 15 past instances when the 10-day crossed below the 50-day, the stock continued to move higher over the following month. The odds of a continued downward trend are 73%.
Following a 3-day decline, the stock is projected to fall further. Considering past instances where Apple declined for three days, the price rose further in 50 of 62 cases within the following month. The odds of a continued downward trend are 68%.
The Aroon Indicator for PFPT entered a downward trend on November 11, 2020. This could indicate a strong downward move is ahead for the stock. Traders may want to consider selling the stock or buying put options.

OCNCASH-Stochastic OversoldAnalysis:
Stochastic Oversold, Need to break Down Trendline to go up, Next resistant 0.725

ICAD, Stochastic Oscillator left the oversold zone on Oct 29, 20This is a signal that ICAD's price trend could be reversing, and it may be an opportunity to buy the stock or explore call options. Tickeron A.I.dvisor identified 69 similar cases where ICAD's stochastic oscillator exited the oversold zone, and 62 of them led to successful outcomes. Odds of Success: 90%. Current price $9.76 crossed the resistance line at $9.80 and is trading between $9.80 resistance and $9.63 support lines. Throughout the month of 09/29/20 - 10/29/20, the price experienced a +12% Uptrend, while the week of 10/22/20 - 10/29/20 shows a -12% Downtrend.
Bullish Trend Analysis
The Momentum Indicator moved above the 0 level on October 05, 2020. You may want to consider a long position or call options on ICAD as a result. Tickeron A.I. detected that in 69 of 84 past instances where the momentum indicator moved above 0, the stock continued to climb. The odds of a continued upward trend are 82%.
The Moving Average Convergence Divergence (MACD) for ICAD just turned positive on October 06, 2020. Looking at past instances where ICAD's MACD turned positive, the stock continued to rise in 36 of 43 cases over the following month. The odds of a continued upward trend are 84%.
ICAD moved above its 50-day Moving Average on October 29, 2020 date and that indicates a change from a downward trend to an upward trend.
The 10-day Moving Average for ICAD crossed bullishly above the 50-day moving average on October 22, 2020. This indicates that the trend has shifted higher and could be considered a buy signal. Tickeron A.I. detected that in 16 of 20 past instances when the 10-day crossed above the 50-day, the stock continued to move higher over the following month. The odds of a continued upward trend are 80%.
Following a +8.51% 3-day Advance, the price is estimated to grow further. Considering data from situations where ICAD advanced for three days, in 212 of 255 cases, the price rose further within the following month. The odds of a continued upward trend are 83%.
The Aroon Indicator entered an Uptrend today. Tickeron A.I. detected that in 167 of 198 cases where ICAD Aroon's Indicator entered an Uptrend, the price rose further within the following month. The odds of a continued Uptrend are 84%.

CHRS, Stochastic Oscillator left the overbought zone on Oct 09This is a signal that CHRS's price trend could be reversing, and it may be an opportunity to sell the stock or take a defensive position. Tickeron A.I.dvisor identified 63 similar cases where CHRS's stochastic oscillator exited the overbought zone, and 58 of them led to successful outcomes. Odds of Success: 90%. Current price $18.48 crossed the resistance line at $18.65 and is trading between $18.65 resistance and $18.00 support lines. Throughout the month of 09/09/20 - 10/09/20, the price experienced a -1% Downtrend, while the week of 10/02/20 - 10/09/20 shows a +10% Uptrend.
Bearish Trend Analysis
CHRS moved below its 50-day Moving Average on October 09, 2020 date and that indicates a change from an upward trend to a downward trend.
The 10-day Moving Average for CHRS crossed bearishly below the 50-day moving average on October 01, 2020. This indicates that the trend has shifted lower and could be considered a sell signal. Tickeron A.I. detected that in 13 of 16 past instances when the 10-day crossed below the 50-day, the stock continued to move higher over the following month. The odds of a continued downward trend are 81%.
Following a 3-day decline, the stock is projected to fall further. Considering past instances where Apple declined for three days, the price rose further in 50 of 62 cases within the following month. The odds of a continued downward trend are 84%.
The Aroon Indicator for CHRS entered a downward trend on September 16, 2020. This could indicate a strong downward move is ahead for the stock. Traders may want to consider selling the stock or buying put options.

AMZN sees its Stochastic Oscillator climbs out of oversold terrOn September 23, 2020, the Stochastic Indicator for AMZN moved out of oversold territory and this could be a bullish sign for the stock. Traders may want to buy the stock or buy call options. Tickeron A.I.dvisor looked at 51 instances where the indicator left the oversold zone. In 42 of the 51 cases the stock moved higher in the following days. This puts the odds of a move higher at over 82%. Current price $3058.75 crossed the support line at $3000.12 and is trading between $3081.11 resistance and $3000.12 support lines. Throughout the month of 08/24/20 - 09/24/20, the price experienced a -9% Downtrend, while the week of 09/17/20 - 09/24/20 shows a +0.37% Uptrend.
Bullish Trend Analysis
Following a +5.89% 3-day Advance, the price is estimated to grow further. Considering data from situations where AMZN advanced for three days, in 285 of 394 cases, the price rose further within the following month. The odds of a continued upward trend are 72%.
AMZN may jump back above the lower band and head toward the middle band. Traders may consider buying the stock or exploring call options.
The Aroon Indicator entered an Uptrend today. In 247 of 348 cases where AMZN Aroon's Indicator entered an Uptrend, the price rose further within the following month. The odds of a continued Uptrend are 71%.

ASTBTC -> bull flag + bullish StochasticAirswap trades in a big bull flag. It is getting ready to punch up and deliver 355% until next resistance level.
TA factors:
1- Bull flag is a bullish pattern;
2- Stochastic daily time frame crossed bullish

Crude - 1 point away on Stochastic Slow weekly I just noticed Crude is only 1 point away from turning positive on Stochastic Slow weekly. This will truly take off if it manage to climbe above. We're still in bottom of trendchannel. If it breaks we will head south to mid 30 area. Long from here is better risk-reward imo.

EURJPY - Day trade by Keltner & Stochastic 27/8/2020* The signal are tested in 3,5 years. Winrate stability over 52% every year.
Risk: 1%.
Risk/reward: 1/1.2 for the most result.
* Tradingview's backtest time ~ 3.5 years/Premium account, differs between currency pairs (Cryto is the default backtest time is shorter because the market is open both Saturday and Sunday: about 2 years)
- Base on order: 2 ways to enter or combine both.
Method 1
+ Keltner channel: the price closed above or below Upper / Lower Keltner for signal 1. Wait for the price to adjust to the Basis line, then enter the order.
Method 2
+ Keltner channel: price closes above or below Upper 2 / Lower 2 Keltner gives signal 1. Wait for the price to adjust to Upper / Lower line, then enter the order.
Method 3: combine both, priority 1 if satisfied conditions
+ Stochastic option: appear rising signal: K>80. Decline signal: K<20 for signal 2.
- When the above conditions are met, the Indicator shows a Buy / Sell signal according to the trend.
-----------------------------------
- Stoploss: Calculated from the entry point + - actual fluctuation by the formula ATR (20) * risk ratio (risk).
- Profit: Calculated from the entry point of the command + - actual oscillation using ATR formula (20) * reward ratio (reward).
- Profit: Look the Summary below.
- Should be backtest 3 Years (long term), each Year (medium term) and Quarter or 6 months (short term). If each year the success rate is always more than 50%, can be used for actual trading

ABCD pattern confrimated by a stochastic bearish divergenceif we look attentively price broke frankly the trendline and just pullback to it (and more over approximatively to the 0,618fib
there is a big bearish divergence on stochastic meaning the bearish trend isnt over.
im entering short till next support, sl can be tighter using price action on 1h TF
first we have to wait for a small confirmation before entering this trade

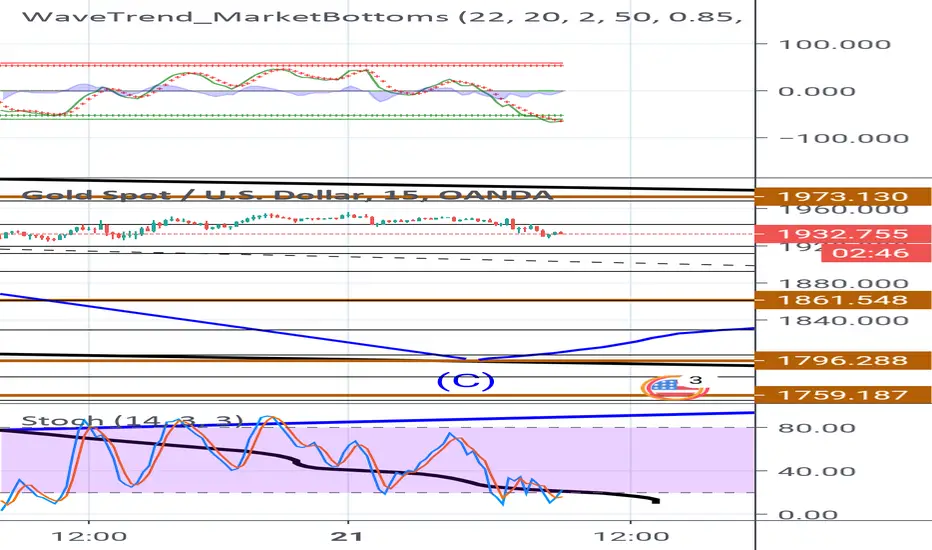
Warning macd and stochastic at bottom monitoring 1953Failed bearish trend suspect retest 1953 and 1973
Looks like small bullish divergence at stochastic
CRVBTC -> ascending triangle and bullish StochasticPlease support my idea with likes, it is really important to me =).
CRV trades on a bullish pattern. The bottom is IN. The ascending triangle probably will punch up.
TA factors:
1- Ascending triangle is a bullish pattern;
2- Stochastic is oversold 1 h time frame.

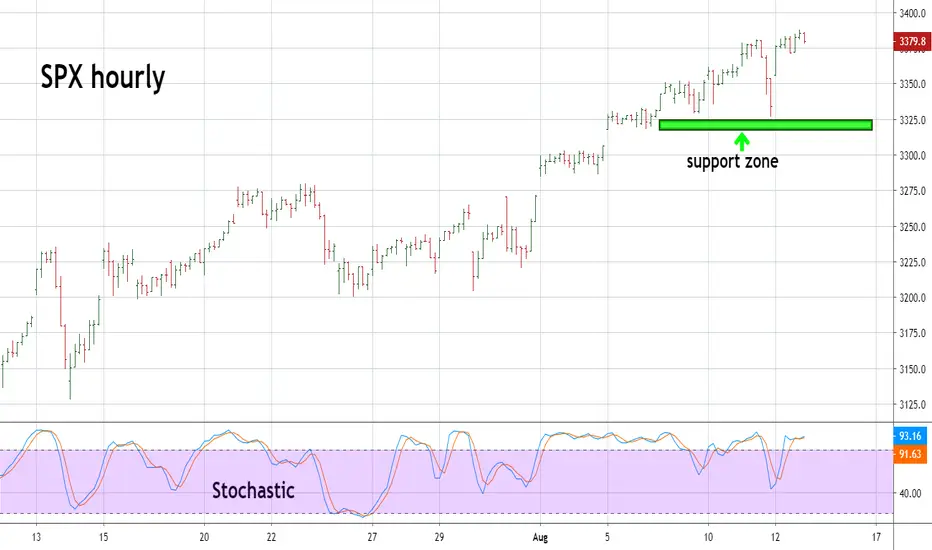
Keep Watching SPX Hourly StochasticIn my 8/11 SPX post I noted my Market Profile - Volume indicator had support just below S&P E-Mini futures 8/11 low of the day.
I suspected that the SPX could rally in the early part of the session. The rally continued late into the day and the SPX made a new post crash rally high.
Today's rally shows just how difficult it is to predict even a short term drop. The SPX is probably in an Elliott Wave third of a third wave up from its late March 2020 bottom.
These structures usually have very steady rallies with shallow corrections.
Keep watching the Hourly Stochastic, if it reaches over sold zone and the SPX is in the support zone it could be a great opportunity to go long.
Mark