BTC - Analyzing monthly momentum shifts with the Stoch RSI!What is the stoch rsi?
The Stochastic RSI (Stoch RSI) is a momentum indicator that applies the stochastic oscillator to the RSI, making it more sensitive to price changes. The Stochastic RSI has two lines:
Blue line = the fast momentum line
Orange line = the slower momentum line
How It Works:
* Helps identify overbought (above 80) and oversold (below 20) conditions.
* Crossing above 20 signals possible bullish momentum.
* Crossing below 80 signals possible bearish momentum.
Why Use It?
* Reacts faster than regular RSI.
* Helps spot momentum shifts and reversals.
* Best used with other indicators for confirmation.
Analyzing the Monthly BTC Chart Through the Lens of Stochastic RSI: A Cycle Comparison
in this discussion, we’ll take a deep dive into the monthly Bitcoin (BTC) chart and examine how the Stochastic RSI aligns with previous market cycles, dating back to 2016. By comparing BTC’s historical price action with Stoch RSI signals, we aim to identify recurring patterns, overbought and oversold conditions, and how momentum shifts have played a role in past bull and bear markets. Understanding these correlations could provide valuable insights into where BTC currently stands in its broader cycle and what to expect next. Let’s break it down.
Let's dive into the bullmarket of 2016/2017:
In 2016 and 2017, the Stochastic RSI on the monthly BTC chart stayed consistently above the 80 level, often fluctuating between 80 and 100. During this period, the blue line occasionally crossed below the orange line, signaling a short-term pullback. When this cross occurred, it was typically followed by a red candle in the next month, indicating a brief dip before the price continued its upward movement. This pattern appeared multiple times throughout the bull market, allowing BTC to make higher highs and pushing the price further up.
However, the key turning point came when both the blue and orange lines crossed below the 80 level. This marked a shift in momentum, often leading to a significant drop in price or even a bear market phase. When the Stochastic RSI fell below 80 and remained there, it indicated that bullish momentum had stalled, and a potential reversal or prolonged downtrend was likely to follow. This was a critical signal for traders to watch during the bull cycle.
What happened in 2019-2021?
In 2019, the Stochastic RSI on the monthly BTC chart quickly moved from the oversold region to the overbought area, reflecting a rapid surge in BTC’s price during that time. This sharp movement in the Stochastic RSI mirrored the fast-paced price increase. However, once the Stochastic RSI entered the overbought zone, the blue line crossed below the orange line, signaling a potential reversal. When this happened, the Stochastic RSI fell below the 80 level, indicating that bullish momentum was weakening.
This crossover was a critical signal of potential downside, suggesting that BTC could experience a correction or even an extended period of bearish pressure. The decline in the Stochastic RSI below 80 marked the beginning of a phase where BTC faced increased downside momentum, leading to a correction in price for months.
Later in the cycle BTC and the Stoch RSI went up to the overbought area ones again. When the Stoch RSI with the blue and orange line crossed below the 80 was the start of a prolonged bear market.
What occured in this cycle?
In the current cycle of Bitcoin (BTC), there have been three notable crosses on the Stochastic RSI, which offer important insights into market conditions. The first cross stayed above the 80 level, which typically signals an overbought condition. When the Stochastic RSI is above 80, it indicates that the market may be experiencing strong bullish momentum, but it's also at risk of becoming overextended, potentially signaling a reversal.
However, the other two crosses occurred as the Stochastic RSI moved below the 80 level, which is generally interpreted as a sign that the bullish momentum is weakening and that further downside could be in play. The fact that these two crosses occurred below the 80 level suggests that the overbought conditions are being worked off, and momentum may be shifting to the downside.
The last cross is still in play. The momentum is quickly turning to the downside while BTC is facing downside pressure
How can we compare this cycle with the last ones?
In the last cycle of BTC, there were two key crosses of the Stochastic RSI below the 80 level, both of which marked important turning points for the market.
The first cross below the 80 level triggered a significant crash of around 70%, which was a sharp correction from the bull market's peak. This steep drop signified a clear shift in market sentiment, with the bearish trend beginning to take hold. The second cross below 80 marked the official start of the bear market, though it wasn’t as dramatic as the first crash.
An interesting aspect of the second cross was that Bitcoin briefly made a slightly higher high before the decline, which might have seemed like a potential sign of recovery or a continuation of the bullish trend. However, this higher high was not sustainable, and the bearish momentum quickly took over, confirming that the market had turned decisively to the downside. This higher high can often be seen as a bull trap, where traders were temporarily lured into thinking the market was rebounding, only for the price to reverse sharply.
In contrast, the cycle before this one was marked by Bitcoin staying consistently above the 80 level for the entire duration of the bull market. The Stochastic RSI remained elevated, reflecting strong bullish momentum and a prolonged uptrend. Once the Stochastic RSI crossed below the 80 level, it signaled the official start of the bear market. This transition from above to below 80 is often seen as a clear indication that the overbought conditions had been worked off, and the market was beginning to lose its bullish steam.
In both cycles, the Stochastic RSI's behavior has been crucial in identifying key points where the market shifted from bullish to bearish. In the most recent cycle, the sharp crash following the first cross below 80 and the subsequent bear market beginning with the second cross below 80 highlight the significance of this indicator in forecasting major market changes. Meanwhile, in the previous cycle, the sustained time spent above 80 helped to keep the bullish momentum intact until the market finally reversed with that pivotal cross below 80.
These patterns suggest that once Bitcoin’s Stochastic RSI starts crossing below the 80 level after an extended period of bullish movement, it’s a strong signal that the market is entering a phase of weakness and may eventually lead to a bear market.
Conclusion:
The current cycle shows similarities to the 2019/2021 cycle, particularly with the second cross down on the Stochastic RSI, which previously marked a local top. There is a strong possibility that this could signal a cycle top.
Thanks for your support.
- Make sure to follow me so you don't miss out on the next analysis!
- Drop a like and leave a comment!
Search in ideas for "stochastic"

ADAUSD - Upward move coming - 2023!It looks like Cardano it's going to start 2023 well.
On the 4-hour timeframe chart(left), Cardano's price is showing Regular Bullish Divergence. The Divergence is indicated by the Relative Strength Index and the Stochastics.
On the daily timeframe chart(right), Cardano's price is showing an Oversold condition. The Oversold conditions are indicated by the Bollinger Bands, Relative Strength Index, and Stochastics.
Both charts complement each other. The new innovative plans for 2023 are in line with these ideas as well.
Enter your long position only if/when the candle closes above the key level and confirms it as a support.
All further details are shown on the charts.
Good luck!

DASHUSD - Short - Retrace possibleOn the chart we can see the price is currently overbought. The three indicators are suggesting the price is in overbought condition and is likely to go down.
This is a short-term setup and the profits could be taken at the target. The three indicators used are Bollinger Bands, RSI and Stochastic.
See all further details on the chart.
Goodluck!

LTCUSD - Short - Small drop comingOn the chart we can see the price is currently overbought. As we can see all the three indicators are suggesting the overbought condition. So this can be a short-term oppurtunity to get some profit if this plays out.
The indicators used are Bollinger Bands, RSI, Stochastic.
See all the details on the chart.
Goodluck!

BTC - Stochastics hasn't bottomed out yet on BTC Monthly The Stochastics hasn't bottomed out yet on BTC Monthly:
Why ?:
=========
Because when the Stochastic bottoms out we see the green indicator line cross over the red indicator line indicating movement back upwards. An example of this is marked on the Stochastic at Points "A" and "B"
The Current stochastic at point "C" shows BTC is only just breaking the bottom of the pattern and the Green and Red indicators on the Stochastic have yet to flip bullishly .
Whats this mean ?
==============
This leads me to believe that in month or two BTC will eventually reach the bottom of the upwards moving channel at around the 13 to 12k area.
Interestingly the graph shows the MA150 is conveniently situated at this area and will act as additional support .

BW - What a beautiful Weekly chart
Weekend preperation and discovery. I love it when I find something as beautiful a BW on the Weekly time frame. I looked through about 300+ charts today and found 22 that I fell in love with for April.
Explanation:
Focus is the stochastic indicators, mainly the middle and bottom one. The top stochastic is my signal with a shorter setting. It shows me direction and confirmation for trade execution. The idea is to find charts that have stochastic that angle like the one in BW, almost like the stochastic wants to jump out of the indicator and move into the chart. Extremely good and pronounced BULLISH DIVERGENCE.
Price continues to try to move down, while momentum continues to move to the upside. Bullish divergence, trend reversal and dollar signs. I boxed the angle/shape on the stochastic. Hope ya'll enjoy.
Top - Stochastic signal
Middle - Stochastic 14
Bottom - Stochastic 21

BTC/USD Sideway what can we plan?Hi everyone and Happy new years 2023 From Thailand. Wishing you happy and wealthy.
Okay let talk about BTC, we surely BTC are in downtrend and now are sideway in downtrend after that no one know it will go to lower low or make reversal pattern but we can do trading by use Stochastic you see in Charts Stochastic quite affect in sideway, my advise is when Stochastic are Overbought and clash with resistant that are Shorts/Sell Signal and Stochastic are Oversold and clash with support that are Long/Buy Signal.
However you have to follow closely because range movement of BTC it's so narrow, keep do risk management if ratio of risk/reward less 1:2 it's not worthy to take that position.
That my idea hope you get some ideas to trade. Ps. Market always right and should not fight with market.


(SPY) Bears, the market may move lower: careful of the look backAMEX:SPY
In this video I go over very general market conditions and express my bear case on the SPY using some simple indicators. This is not financial advise and was created for entertainment and educational purposes only. Do not use this video and its contents as a recommendation to buy or sell any type of security, the opinions expressed are of my own and should be taken with a grain of salt. No one person is always right (or wrong)- please do your own TA and DD when making any financial decisions in the market. A stock guru I know once told me "price action is king" and I took it to heart. Ignore the noise, be simple, look at the chart and let it speak to you.
The video is really only supplemental information to pair with the post below (which is much more detailed):
The SPY is coming off a very strong bearish candle close at $412.
This marked a range from the previous 4 months with a top of range of $479.98 - closing the month of April's candle -14.33% or -$68.77.
This 4 month move countered 8 months worth of price discovery - or in other words, a 1 year reset button was just pushed. Rewind.
Monthly Time Frame:
Stochastic shows neutral, room for buyers and sellers
The 200 is trading below the 50, signaling a bull market - don't isolate this thought though
The monthly candle that just closed pushed well past the 12 EMA - which acted as support on the previous 3 months candles (as seen as a slice of the candle wicks/shadows)
Weekly Timeframe:
Stochastic shows oversold slightly. On this time frame the SO seems to be much more sensitive on the oversold side than the overbought. Bears should keep this in mind when considering short term reversals or lookbacks.
The weekly candle printed below the 50 SMA, 12/26 EMA, but above its 200 SMA. The 50 SMA (low) attempted support but ultimately failed.
The Daily print closing below closing levels of April 2020
There was also a 12/26 EMA cross under that developed in the last daily print - this could signal a stronger downside that is to come.
3 Day Time Frame:
Very similar to the weekly with one big difference lying in the 12/26 crossunder which happened Feb 10 and a look back rally that pushed through (but failed to maintain) in late March.
May Sept Dec 21' and Feb 22' all produced similar 3day prints that were follow by a bull rally - do be careful of these rally periods as the SPY continues its downward trend as they will come because the price never goes straight up or down.
The Stochastic is again showing signs of being very sensitive to oversold conditions. Oct 21', Jan Feb and March 22' all show a rally after touching the oversold mark.
1 Day Time Frame:
This is where the picture becomes a little more clear IMO.
The daily print is now below the 200 and 50 SMA set, and the 12/26 EMA still - both the 12 under the 26 and 50 under the 200 - technically a bear market (unlike the 1M, 1W, and 3D showing the 50 over 200)
The first overhead EMA is the 12 which could be looked to as resistance upon a lookback. The 50 SMA (low) should also be noted, as it seemed to have provided support April 12th - 18th. This support is now considered resistance.
Stochastic showing oversold, and again showing sensitivity to these conditions as compared to its counter
This is IMO the most important line of support/resistance you can find - not just for the SPY but for the entire market. The ULTIMATE crash will come with confirmation of the break below. Mark this line on your charts and consider it for the future. This is the bottom of 08' that created support, switched to resistance in 11' which confirmation of its strength in 18' and 20'. It was only during a recovery(?) that it was broken. Time will tell if resistance is now support - we do not know yet because it has not been tested. My gut says it will provide some, but very little resistance when the time comes.
This is what that line looks like relative to the daily for context - the current price is roughly $20 away of -5% from this line of "assumed" support. This is not a hard feat IMO for bears to look at as a price target in the short term.
This would be in the $390-400 range.
If you consider the 3 day chart in relation you will notice the 200 SMA set has a H-C-L of 387.26, 382.71, 376.92, respectively. This could be a lower PT that bears could be looking to.
Additional levels to consider to the downside would be a range of 405-411 in the near short term. Really, considering the gap found on April 1st to April 5th that range could be extended to 400 before support could start to be used. There is no real structure here though, the next structure is found in the lower 390s.
Lookbacks could happen at any time, but patterns lately show lots of doji and morning star reversals that tend to give us a heads up. Again, nothing goes up or down in a straight line.
Lookback levels I would consider would be on the Daily time frame at the 50 and 200 SMA sets
50 SMA: 437.19, 433.28, 428.68
200 SMA: 450.98, 448.15, 445.13
Also, I would consider the pivots at 437.20 and 461.55 as resistance in the case of a rally
Conclusion:
I expect continuation of bearish pressure with short lived look back rallies. The market overall IMO is not topped out just yet and we very well may see higher highs before lower lows in the short term. Even though I do think a crash is imminent, I do believe there is room for bulls to take short control. Mainly do to oversold conditions that show lots of sensitivity. That said, there is also no indication of a bottom just yet either. Almost all signs point down. Remember, and this is the last time, nothing goes up or down forever - expect turbulence. I think the SPY will go down to $400 to at least test, and perhaps even lower to the 370s before a bottom is found.
You all have a wonderful trading week and best of luck to all those in the market!

BTC hits ATH – But this hidden signal could ruin the rally!Bitcoin (BTC) has been in a steady and impressive uptrend over the past two months, with nearly seven consecutive weekly green candles forming on the chart. This sustained bullish momentum signals strong buying pressure and growing confidence among market participants. Such a consistent rally is rare and often indicates a broader shift in sentiment, suggesting that Bitcoin may be entering a new phase in its market cycle.
Price discovery
Recently, BTC broke through its previous all-time high (ATH) of 110K on the lower timeframes, a significant technical development. This breakout means BTC is now trading in price discovery territory, where there is no historical resistance to guide price action. While this opens the door for further gains, traders should remain cautious. Upcoming daily and weekly candle closes will be critical in determining whether this breakout is sustainable. For the move to be confirmed, Bitcoin needs to close multiple weekly candles above the previous ATH. If instead, the price falls back below the ATH on either this weekly close or the next, it could introduce downward pressure and potentially signal a failed breakout.
As we navigate this pivotal moment, it's crucial not to get swept up in the euphoria. While the price action is undoubtedly bullish, certain technical indicators warrant close monitoring to avoid complacency. In particular, the weekly Stochastic RSI and the weekly RSI are now at levels that deserve attention.
Stochastic RSI
The weekly Stochastic RSI is entering overbought territory, even before this week’s candle has closed. This suggests strong bullish momentum is currently driving the market. However, history shows that when the Stochastic RSI enters the overbought zone, it often marks areas where it was wise to take partial profits. If the blue and orange lines on the Stochastic RSI begin to cross back below the 80 level, it could indicate a weakening of momentum and the possibility of a short-term correction. That scenario becomes more likely if Bitcoin fails to continue making higher highs in the weeks ahead.
Relative Strenght Index (RSI)
Meanwhile, the Relative Strength Index (RSI) is approaching a critical resistance trendline. In previous market highs, we’ve seen the RSI top out at 89, followed by a high of 80 despite new highs in BTC’s price, a classic case of bearish divergence. If Bitcoin fails to push significantly higher in the coming weeks and the RSI does not break above the 80 level, we could be looking at a potential triple bearish divergence. This would be a strong warning signal that momentum is waning, and it could lead to a broader correction.
For this reason, it is crucial that Bitcoin continues to push upward with conviction. The RSI must break through its historical trendline and post a new high above 80 in order to invalidate the threat of bearish divergence. Should the market fail to do so and instead roll over, we may experience increased volatility and downside pressure as we move into the summer months.
Conclusion
In conclusion, while Bitcoin is exhibiting powerful bullish behavior and appears poised for further gains, the sustainability of this rally hinges on continued momentum and strong technical follow-through. Specifically, Bitcoin must maintain closes above its previous all-time high, avoid a bearish cross on the Stochastic RSI, and see the RSI break above its recent highs to neutralize the threat of bearish divergence. If these conditions are not met and momentum fades, the market may face a period of consolidation or correction in the near term. Staying vigilant and objectively monitoring these indicators will be essential for navigating what comes next.
Thanks for your support.
- Make sure to follow me so you don't miss out on the next analysis!
- Drop a like and leave a comment!

$AUDCAD | Sell Trade | Market Exec | Technical Confluences:
- Price actions are now at Stochastic Overbought conditions in Daily, H4 and H1
- Price action is at the 78% Fibo retracement levels which also coincides with a Interest Zone
Fundamental Confluences:
- Both currencies are considered as commodity currencies and both currencies require strong commodity prices to prosper and it all comes down to growth
- Australia's growth is more concentrated on China's outlook and Canada's very US-centric still.
- We are still not seeing much growth momentum in the China space and with US-side having a soft landing possibility, Canada's prospects should be better at the moment
-----
Will be taking a position into a sell OANDA:AUDCAD position.
Targeting to TP approximately half the position at the 50% Fibo Extension levels (in blue) and move my SL levels to B/E. It will depend on how the price action is at the 50% Fibo's Interest Zone.
This trade will be the battle of the Interest Zones.
Full TP are the 61%/78% Fibo Extension levels.
Remember, DYOR.

BITCOIN is still BULLISH. Because we are Embedded. I see people trying to short this market!
WRONG, WRONG, WRONG.
You should be
LONG, LONG, LONG.
Whilst the slow stochastic's are embedded - which they have been for 10 days now.
How do Slow Stokes embed? 3 continuous days with readings above 80 on the K&D line.
You now have a indicator that has flipped from overbought to a LOCKED 🔒 in trend.
(This also works in Bear moves with reading under 20)
We could see 55K easily by Friday a return. move to the upper Bollinger Band.
If at any point the stochastic's close under 80... they can regain their embedded status, the very next day ONLY.
Also losing the stochastic's doesn't mean to short, but simply take some chips off the table.

How to Analyze the $SPY Daily ChartGreetings fellow traders,
Welcome to this installment of our newsletter where we analyze price action on AMEX:SPY on the daily, hourly, and 15 minute timeframes. We will keep this one short and sweet.
DAILY TIMEFRAME
What is the Trend?
The short term trend is bullish: the 9-candle EMA is trading above the 20-candle EMA.
The medium term trend is bullish: the 20-candle EMA is trading above the 50-candle EMA.
The longer term trend is bullish: the 50-candle EMA is trading above the 200-candle EMA.
How Strong is the Current Trend?
One of the ways that traders can analyze the strength of a trend is by appeal to the Average Directional Index (ADX). Readings below 20 indicate a weak or non-existent trend. If the ADX is going up, readings between 20 and 40 indicate a developing early trend of low to moderate strength. Readings between 40 and 55 indicate a strong, well-established and robust trend. And finally readings above 55 indicate an extremely strong trend that is likely approaching exhaustion.
At the moment, the ADX is 25.04 on the daily chart, indicating a low strength trend that can, with additional momentum, pick up steam. But how likely is this? In order to answer that question, we are going to have to look at several other technical indicators, supply and demand levels, and chart patterns.
One of these technical indicators is the relationship between the 9-candle EMA and the 20-candle EMA. Despite the impressive upward move in price action yesterday, the distance between the 9-candle EMA and the 20-candle EMA remained constant from the day before. If the trend was strong, you would expect the distance between the two to be increasing. The fact that it did not is a potential warning sign that the trend is not extremely strong at the moment.
What do the Momentum Oscillators Tell Us?
Another thing to consider are the two main momentum oscillators: the Relative Strength Index (RSI) and the Stochastic Oscillator. These momentum oscillators can give us clues as to whether or not the current trend is reaching exhaustion, or if it is likely to continue.
Let’s first consider RSI. As of yesterday’s close, we have an RSI reading of 65.86 — a reading that is approaching the technical overbought level of 70. For reference, the last time that AMEX:SPY was trading at these levels was in August of 2022. During that incredible summer rally, the RSI pushed all the way up to 73.43 before the trend reached exhaustion and a powerful reversal ensued. Bearing that in mind, you should not necessarily be surprised if AMEX:SPY were to push into that overbought territory this time around as well before reversing.
That being said, the Stochastic Oscillator is flashing a reading of 97.52, which is incredibly close to the maximum overbought reading of 100. This is a major indication for technical analysts that we may soon see a mean reversion in price action so that this all-important momentum oscillator can “cool off” for a bit.
Indeed, it has been 6 days since AMEX:SPY last made contact with its 9-candle EMA, suggesting that we are potentially due for a basic reversion to the mean in price action. If we were to first push higher, though, there are a few levels on AMEX:SPY to keep in mind.
How High can the Market Push?
The first is the upper Bollinger Band, which closed yesterday at 430.97. While that value will shift higher today, this upper band is a level to keep in mind as potential resistance should the market catch an end-of-the-week bid.
The second level is the high from August 2022: 431.73. Both of these levels are within reach if bulls want them.
Finally, if things get really crazy, keep your eyes on 435.34.
Are there Signs of Bearish Divergence?
Notwithstanding the potential for one final push to enter the overbought territory on RSI, it is very important to note that on Monday of this week we received a technical bearish divergence signal in price action.
Even though the market made a higher high than at any point in the previous 30 trading days, we did not get a higher high in:
The reading on the Relative Strength Index
The reading on the Stochastic Oscillator
The reading on MACD
When these indicators fail to make higher highs while price is making higher highs, this is an incredibly strong sign of bearish divergence. Should the market push into close, positioning for a mean reversion pullback during power hour should certainly be on watch.
What are the Mean Reversion Price Targets?
However high price ultimately pushes before reversal, it would be prudent to keep the following potential pullback levels in mind if you are trying to play a mean-reversion trade.
The first target would be the 9-candle EMA. While it is currently trading at 424.54, this value will change with each passing day. You can use this, or potentially the 14-candle EMA, as your first “profit-taking target” for a mean reversion trading strategy. Do keep in mind, though, that there is currently some solid demand between 426.14 and 425.82 that we will have to break through in order to gain some selling momentum.
The second target, should the first be broken, would be 422.58, a previous resistance level.
The third “stretch” target would be around 420.73. Anything below 420 would likely see 418.31.
What are the Main Supply and Demand Levels to Add to our Charts?
Finally, make sure to track the recent supply and demand levels on the daily timeframe:
429.62
420.72
417.62
415.72
411.92
Stay tuned for the follow-up video where we zoom in on the hourly chart for more specific short-term guidance.

NNDM possible profit strategyBuy shares strategy -
Dip Buy NNDM at $2.98 yellow 8 EMA LINE
RISK 5% -> Stop Loss $2.91
TARGET 1 Reward: 10.4% Sell $3.29
TARGET 2 Reward: 13.4% Sell $3.38
________________________________________________________________________________________________________________
In order for NNDM to make a serious move north, bullish volume needs to kick in. Volume holds the weight of price up, it validates price. Here i am using several variables to justify a possible buy. This is a day chart. I am using the EXTENDED FIBONACCI RETRACEMENT to acquire my target lines.
What I Like -
*The candlestick formations; there is a push to break prior support/now resistance at $3.06. (yellow horizontal line) Notice how many times $3.06 was opened or touched in the past, going back to Jan 24, 2022, Feb 24, mar 8th, 14th 15th, and so forth...VERY IMPORTANT PRICE for NNDM. Now, with the 8ema and the red 34ema, the candles are using those as a springboard to push north. That's why bullish volume is so important to accomplish that.
*RSI is trending somewhat bullish; at a value of 57, the RSI, being a momentum indicator, suggests more room for running north
*8 EMA AND 34 EMA; The 8 ema has just crossed north over the 34 ema, suggesting that this stock price is ready to move bullish. Finding these crosses can be parabolic bullish moves!
What I Don't Like -
*Stochastic indicator is quite Overbought; While some investors suggest using the Stochastic as an overbought/oversold indicator, others suggest using it as a momentum indicator. The ideal stochastic indication would be both the RSI and Stochastic at the bottom of their respected graph moving upwards, suggesting an overall SENTIMENT that the bullish move is underway.
*VOLUME is not ideal; as stated above, we need more volume to come in
*Let's see what happens*
DISCLAIMER - I am not a professional trader. These are merely my thoughts and possible moves; i enjoy watching these stocks validate my process or slap me across the face lol. If you are in need of professional assistance with your trades, don't look here. I am not that guy.

USDCHF - Some Reasons for Why to sell the Market?Hi Traders!
The market is in an shortterm Uptrend.
In the H4-Timeframe the price is in a downtrend.
As you can see, we here have some reasons on why to sell the market USDCHF:
Reversal Zone
The first reason is the reaching of the Reversal Zone (orange Box).
This area is a barrier for the market, because there are lots of Resistance Levels in it.
Bearish Stochastic Divergence
The second reason is the bearish Divergence.
As you can see the Stochastice is making lower highs while the price is making higher lows.
Higher Timeframe Trend
As mentioned before, the "big" Trend we're looking for we can find in the H4-Timeframe.
There it is in a Downtrend.
Higher Timeframe Structure
If you go to the H4-Timeframe, you can also see a Trendline which is acting as a Resistance.
This role could push the price lower.
Entry Trigger
In the chart you can see a Trendline.
If the market breaks and closes below this trendline, we are looking to sell.
We recommend to wait for a Confirmation!
Thanks and successful Trading :)!

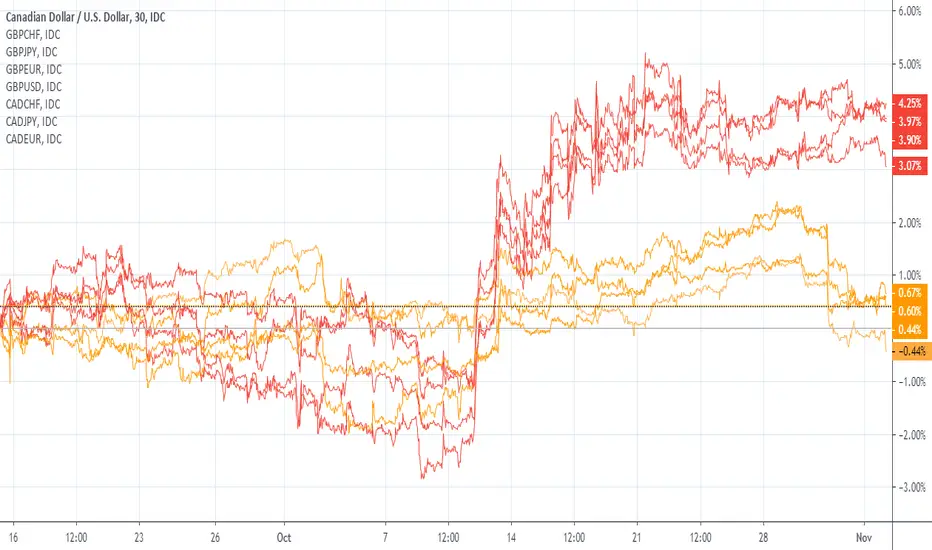
CAD versus GBP Brownian Motion Proces Stochastic Model on PriceAt current market, both CAD multilateral band and GBP multilateral band are bearish, however it is difficult to predict which one of the band will initiate the bearish. This is resolved by using Brownian motion process stochastic. The stochastic is confirming the bearish with sudden drop initiated by CAD multilateral band to the new interdays low and followed by GBP multilateral band.
At such, Brownian motion process stochastic could be very useful to gauge which multilateral band will initiate for bearish of the bearish bands as well as to initiate the bullish of the bullish bands. Musa and DeJong (1992-1995) tested the Brownian motion process stochastic and found them in harmony from time to time.
TRXBTC Daily Trend Change | Increase in Bull Volume Hello Traders
Two more months in the year, how time flies…
Today’s chart update will be on TRXBTC, we have a potential daily trend change which is backed up with strong bull volume…
Points to consider,
- Trend is putting in new higher lows
- Resistance at .236 Fibonacci retracement
- Support held by EMA’s (EMA’s Bull Cross)
- Stochastics trading in upper region
- RSI testing its local resistance
- Visible increase in bull volume
TRX has been on the move as of late, changing its overall daily trend with consecutive higher lows as it comes into local resistance. This resistance, the .236 Fibonacci Retracement, is in confluence with structural resistance, a key area that needs to be broken for a continuation.
Support is being held by the EMA’s which does look quite strong after a confirmed bull cross. This cross initially signalled the daily trend change.
The stochastics is currently trading in the upper regions; a healthy retracement in the trend can come to fruition as the stochastics does have a lot of momentum stored to the downside.
The RSI confirmed the bullish divergence, and is now trading in the upper region at local resistance. If this resistance breaks, is can trade in the orange highlighted box for an extended period of time, as history suggests.
Volume has been a great indicator; we have had an increase in bull volume, showing that buyers are strong in this trend change. We need to see this continue for local upper resistances to be tested.
Overall, IMO, TRX has had an impressive trend change with follow through; a healthy correction is not farfetched. This will cool of the stochastics and RSI indicators before another leg up, this will also allow the trend to put in another higher low…
What are your thoughts?
Please leave a like and comment
,
And remember
“You’re going to learn a million things, then you need to forget them all and focus on one.” - SunriseTrader

$EURGBP | Sell Trade | Market Exec |Technical Confluences:
Price action is bounced off an Interest Zone and created a newer low
Price is breaking through a support trendline
To note, Stochastics is moving into Oversold conditions but fundamentally, there is support for OANDA:EURGBP to be weaker
Fundamental Confluences:
This FX pair is a trade-related pair and normally doesn't move much against one another unless there is a change in fiscal or monetary front
In this sense, we got a gauge of how both central banks, ECB and BOE stance are. ECB is taking on a data dependent stance and is trying to resist cutting interest rates while BOE sent out a hawkish note the other day that majority of them do not want to cut rates
Naturally from a yield perspective, holding GBP compared to EUR is more attractive and this is what we are aiming for.
-----
Will be taking on a short OANDA:EURGBP position when market reopens on Monday.
This trade may take some time to complete as it there is normally not much action with this pair except during London's trading hours.
-----

$CELH | Buy Potential D1 | Market Exec | Technical Confluences:
- Elliot wave may have completed Wave 4 and begin the Wave 5 move
- Price action is close to the 78% Fibo levels and a Demand zone (Yellow Zone) area.
- Stochastics are at Oversold levels on both Weekly & Daily timeframes (TF)
Fundamental Confluences:
- Earnings was positive with both domestic & international revenue increasing, EPS beat, EBITDA also up
- Slowly gaining market share in the Energy drinks segment
________________________________
I see these levels as good for me to being some allocation of my Portfolio into $CELH.
Blue Zones & Fibo Extension levels (in Blue) will be the starting point of some my TP levels.
Remember, DYOR.
________________________________
Boosts 🚀, Follows ✌️, Shares 🙌 & Comments ✍️ are much appreciated!
If you have any ideas or charts, do share them in the 'Comments' section below and we can discuss our perspectives to improve or strengthen our strategies.
If you want something analyzed, do drop me a DM. :D
________________________________
Disclaimer: The above suggestion is an personal opinion in general and does not constitute as investment advice. Any decisions taken based on the above suggestion is purely your own risks. DYOR.

AUDNZD | Short H4 | Market Exe | Trade-Related TradeTechnical Confluences for Trade:
- Stochastics are in Overbought Conditions on H1 & H4 time-frame
- Price action is close to a Supply Zone (Blue Area) & has Resistance Trendlines around
- Aiming for the 38.2% Fibo retracement to TP
Fundamental Confluences for Trade:
- Nothing much can dictate the movement of this FX pair as they are heavily trade-related. Any major movement will come from supply-demand areas, monetary policies or economic data gyrations.
Suggested Trade:
Entry @ Area of Interest 1.0970 - 1.1010
SL @ 1.1060
TP 1 @ 1.0920 (Close Half-Position & move SL to Entry level once TP1 is achieved)
TP 2 @ 1.0838
Risk-to-Reward @ Approx. 2.04 (Depending on Entry Level)
________________________________
Boosts 🚀, Follows ✌️, Shares 🙌 & Comments ✍️ are much appreciated!
If you have any ideas or charts, do share them in the 'Comments' section below and we can discuss our perspectives to improve or strengthen our strategies.
If you want something analyzed, do drop me a DM. :D
________________________________
Disclaimer: The above suggestion is an personal opinion in general and does not constitute as investment advice. Any decisions taken based on the above suggestion is purely your own risks.
Any websites / brokers / applications suggested here are also provided as informational purpose only.
________________________________

EURUSD | MT Long H4 |Overly OversoldPair: FX:EURUSD
Timeframe: H4 - Medium Term (MT)
Direction: Long
Technical Confluences for Trade:
- Stochastics are in Oversold Conditions on D1, H4 and H1 time-frames
- Price action has some support trend-line holding it
- Horizontal trendline looks like a demand zone across the years
- Horizontal trendline (Red) is at the 1% Fib Extension Level
- Aiming for the 32.8% Fibo Retracement with 23.6% as the TP 1 level
Fundamental Confluences for Trade:
- EUR weakness has been mostly been pricing in the expectation that ECB will cut in June and diverge from the FED. Currently, priced in.
- Risk is further war escalation from the Israel-Iran tension
Suggested Trade:
Entry @ Area of Interest 1.0620 - 1.0650
SL @ 1.0589
TP 1 @ 1.0698 (Close Half-Position & move SL to Entry level once TP1 is achieved)
TP 2 @ 1.0758
Risk-to-Reward @ Approx. 2.44 (Depending on Entry Level)
May the pips move in our favor! Good luck! :D
*This trade suggestion is provided on an advisory basis. Any trade decisions made based on this suggestion is a personal decision and am not responsible for any losses derived from it.

EURCHF | Short H1 | Market Exec | Taking a Safe Haven TradeTechnical Confluences for Trade:
- Stochastics are in Overbought Conditions on H4 & D1 time-frame
- Price action is at a Consolidation/Supply area
- Price action may reverse towards the lower Consolidation/Demand area
Suggested Trade:
Entry @ Area of Interest 0.9815 -0.9835
SL @ 0.9879
TP 1 @ 0.9767 (Close Half-Position & move SL to Entry level once TP1 is achieved)
TP 2 @ 0.9707
Risk-to-Reward @ Approx. 2.00 (Depending on Entry Level)
________________________________
Boosts 🚀, Follows ✌️, Shares 🙌 & Comments ✍️ are much appreciated!
If you have any ideas or charts, do share them in the 'Comments' section below and we can discuss our perspectives to improve or strengthen our strategies.
If you want something analyzed, do drop me a DM. :D
________________________________
Disclaimer: The above suggestion is an personal opinion in general and does not constitute as investment advice. Any decisions taken based on the above suggestion is purely your own risks.
Any websites / brokers / applications suggested here are also provided as informational purpose only.
________________________________

EURGBP | MT Short H4 | Betting Against the EURPair: OANDA:EURGBP
Timeframe: H4 - Medium Term (MT)
Direction: Short
Technical Confluences for Trade:
- Stochastics are in Overbought Conditions on H4 and H1 time-frames
- Price action has multiple resistance from trendlines & also a horizontal trendline (supply zone)
- Aiming for the 50% Fibo Retracement which the horizontal line shows a supply-demand zone.
Fundamental Confluences for Trade:
- Nothing much can dictate the movement of this FX pair as they are heavily trade-related like the FX:AUDNZD . Any major movement will come from supply-demand areas, monetary policies or economic data gyrations.
Suggested Trade:
Entry @ Area of Interest 0.8590 - 0.8620
SL @ 0.8643
TP 1 @ 0.8562 (Close Half-Position & move SL to Entry level once TP1 is achieved)
TP 2 @ 0.8522
Risk-to-Reward @ Approx. 2.22 (Depending on Entry Level)
________________________________
Boosts 🚀, Follows ✌️, Shares 🙌 & Comments ✍️ are much appreciated!
If you have any ideas or charts, do share them in the 'Comments' section below and we can discuss our perspectives to improve or strengthen our strategies.
If you want something analyzed, do drop me a DM. :D
________________________________
Disclaimer: The above suggestion is an personal opinion in general and does not constitute as investment advice. Any decisions taken based on the above suggestion is purely your own risks.
Any websites / brokers / applications suggested here are also provided as informational purpose only.
________________________________
