TRX Thoughts$TRX
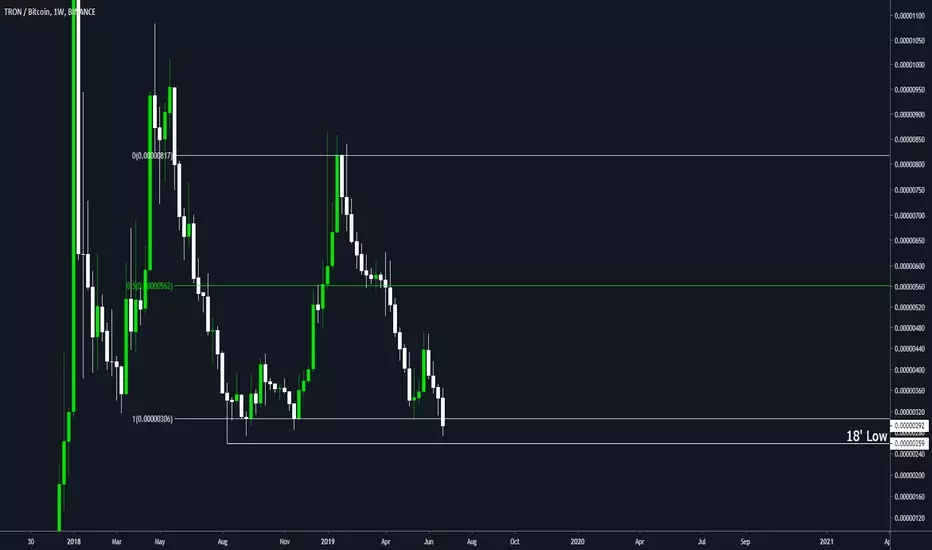
We haven't taken out the 18' low, and we're currently resting beneath the range low. I would personally be patient with this and sit on the sidelines until we get some closes back into the range.
Search in ideas for "tronix"
TRX Scalp Trade ideaClear invalidation beneath the POC/recent HL, bullish divs on the 4H, exit at the first trouble area, lunch is on me.
R: 2.83

TRX LONGTRX
Not too chabby at all, so far I'm liking what it's doing here. Once we get moving upwards, R1 and R2 will be two areas of resistance to look at.

Tron (TRXBTC) Will be a good buy and hold once it comes down.Check out my previous Tron ideas. Up over 50% currently.
While it does look bullish, don't buy until it retraces back into the buy zone. This could take a couple of months.
The main ideas are on the chart. Looking at the Tron community, they seem like fanatics, just like the XRP community. That is good for the coin, since they are likely to hold and create more demand. When the next bull run arrives, this coin will perform well.
Thanks for viewing! Buy a million Tron and hold them. Treat it as a long term investment. Be prepared for it to go to zero, but I doubt that will happen. Now is the time to be buying some of these altcoins. Many are below their ICO price. If there is a good one, buy some and forget about it. The winner will likely negate the losses of the coins that go to zero.

Tron Train to Rekt CityI'm on a highway to hell
With so much positive action going on in the space right now, it's hard to stay in any TRX position with the chart looking this ugly. Volume is anemic and the Jan push up was spurred by BTT hype. There aren't alot of tricks left up Justin Sun's sleeve and social media really destroyed him for screwing up a recent Twitter giveaway. The charts don't inspire confidence, neither does public sentiment.
The interior of my bands is the 20 ema and TRX consistently resides below that. And by consistently I mean ~200 days since Jan 18, 2018. It lives there. It has had two different periods of trading below the 20 ema for >30 days, and the first period was followed by more lows, and more trading below the 20 ema. Those periods are marked by the info indicators on the chart.
Currently the boll bands are opening up like a rattle snakes mouth injecting consecutive daily red candles that extend below the lower bands. This type of action kicked off the most recent downturn in Feb 19. If it blows through 500 sats, which I think it will, it has very flimsy support at 396 sats. If people are checking their blockfolio, and majors are posting moon candles everywhere, they're going to hate seeing Tron bleed out in their app. Their going to bail, and it will end up in a very critical zone marked in blue.
Personally I think the Tron, um, supporters will step in and guard that zone pretty well. 300 sats will probably bring a QE styled defense or we'll see a really odd string of announcements around then. If 220 sats fails, it's game over.
Full disclosure in that I held a position in Tron until I dove into this chart tonight. On Binance right now, 1000 tron will net you roughly 1.3 BNB. I'll check back in 6 months and see how this played out.

TRON looking to growResistances shown, good places that I'll be looking to TP.
Stop loss below the current support for safety.
Not trading advice :)

Tron Long
Pair: Trx/Btc (Binance)
Buy: 565-571
Tp1: 614 (8%)
Tp2: 652 (15%)
Tp3: 723 (27%)
StopLoss: 545(-4%)
Risk/Reward: 1/2

TRX conservative buy box for hodlersI'm not too bearish, the dotted line is a good place to find support aswell.
The box tho, oof , smashing that resistance lead to a really nice pump.
I'm personally gonna buy some TRX there.

TRX Target Hit! But we're still at the mercy of the Bear's bite!Hello Everyone,
Welcome back to my latest TRX Update, Here We Go:
The 0.02200 Long Target hit with room to spare (I have included previous analysis on 3/1 for comparison). TRX's movement followed my charting channel from the bear flag very well (blue and black dotted lines) and with considerable accuracy, I was able to update and enter slightly lower at 0.2120, it dipped as low as .20. Tron ended up dropping a lot faster than I had initially anticipated, it has been a slow sideways mover over the last several weeks into well over a month now. The yellow circles are the entry points for long positions that I have been using. Now...... I wait and see which way we go next. If this drops again, I have not decided if I want to dollar cost average or, set the appropriate stop loss and re-enter. I will make that determination depending on what the market shows me and how far it looks like it will drop.
If we drop steeply, I will take a stop loss position and re-enter at a lower cost. Small drops, I will suck it up and DCA. If we rally upward, I will again see what the market is showing me and make the decision on letting it ride or pulling profit when the time comes. Too soon at this point to predict with the volatility that's been going on, not to mention the major BOT trading that I think was going on ALL weekend! Major buy/sell walls that perfectly inline and holding price points for a significant amount of time, can you say BOTS!!
Earlier long entry points of .238-.239 are still valid if we rally upward. I would personally wait for confirmation of an actual uptrend rally before entering any higher than .023 at this time.
Short positions can be entered into now as well, if......and that's a big IF, you are brave enough to take the risk and enter now. I say this because we are in such a major downtrend with the bears in charge so there is great possibility of this dropping and retracing even lower. However, tron is due for another rally so, there is a lot of risk to enter a short position. My indicator is signaling a small short position entry at this time due to the significance of the trending bear conditions. If you take a short position I would consider setting a stop loss for .024.
Stochastic is at 13 which is in the oversold range.
RSI is at 38 which is on the border of the oversold range as well.
We are below all of the Moving Averages except the 100 SMA (.0217) and 200 SMA (.0219).
We've been in this major downtrend for the last 8 days. Based on TRX's performance since January of this year, it seems to change from uptrend to downtrend and vice versa every 6-10 days.
At the time of writing this, we are back up to the 0.786 fib retracement at 0.0229 and climbing, which, is in a major support zone starting at roughly 0.021 with major overhead resistance at 0.026. Please keep in mind that we are still very much in a downtrend and at the mercy of the bear. There will be the monthly BTT airdrop for all TRX holders on March 11th, we may see a brief rally at this point however, I am not hopeful. The BTT airdrop played no effect on the price of TRX during the February 11th airdrop, in fact, we even saw a slight decrease in price.
Hit that follow or like button if you find this analysis useful or helpful.
Good Luck and Happy Trading!!
AWC
**For Educational Purposes Only. This is not meant as any buy/sell trade advice, trading is volatile and at your own risk.*

Short, I told ya look out for the spike and drop! :DAs I said in my previous idea...
I have identified a possible BAT pattern leading to point D at either 127% or 161.8% . I always like to remind my traders that anything can change in a speculative market and structure can always develop a new IDEA. If this happens we will revisit TRX with another concept if we get another impulse up to .03 cents! I cannot see it at this time but what I do see is a possible head and shoulder heading back down in a complex pattern that I identified with the PURPLE lines. A ny spikes up can easily pull right back down and deny . Be on the look out for tha t. The chart shows resistance at .028 and .027. I will be NOT taking any short positions but I will be on the lookout for a buy from point D at my suggested PRICE ZONES. When I mention ZONES there is no specific price but an area of prices that show strong support or resistance depending on the time-frame we are observing.
SO as you can see it actually happened. That was pure luck on my part foreseeing that. I hope those who short had their stops above .028 if so you would have been safe.
If you decided to take the short.....
Entry SECOND ENTRY PASSED NO ENTRY TO TAKE
TP1 @ .0228
TP2 @ .0200
TP3 @ the lower point D at 161.8% taking price to .016 cents
SL should be above .028
--------------------------------------------------------------------------------------
LONG TERM BULL buy in will be at either point D 1 or point D 2 depending on your risk appetite!!!! I will be buying at POINT D 1 as I am a long term holder of TRX . The development of TRONIX is a 10 year roadmap to 2030. Please understand this and trade with care and understanding of this speculative market as congress and regulators decide how this market will continue to develop!
TP 1 & 2 for BULL will be when we go back up to the resistance points. We will be looking for support to develop below and observe it as it develops.
Entry @ .01600
TP1 @ .0250
TP2 @ .0300
TP3 @ .0350
SL @ .01100

TRON/BITCOIN (TRXBTC) LONG BULLISHThe TRON bulls have remained strong since the New Year has elapsed. The project has survived the immense FUD that was unfairly postulated by haters and pessimists. During its bear market period since ATHs of 0.25 the TRON foundation has made fantastic progress - always keeping ahead of its agenda. The TRON ecosystem will continue to grow as more users flood in and the DAPP floodgates open up.
This is not a project that you want to miss.

Short term pullback Long term buyGood evening everyone. I have been studying TRX for us and with our recent bull run in the market we always see days of correction come after. We can clearly see price falling farther back down and breaking out of patterns lower and lower from the impulse. I have identified a possible BAT pattern leading to point D at either 127% or 161.8% . I always like to remind my traders that anything can change in a speculative market and structure can always develop a new IDEA. If this happens we will revisit TRX with another concept if we get another impulse up to .03 cents! I cannot see it at this time but what I do see is a possible head and shoulder heading back down in a complex pattern that I identified with the PURPLE lines. Any spikes up can easily pull right back down and deny. Be on the look out for that. The chart shows resistance at .028 and .027. I will be NOT taking any short positions but I will be on the lookout for a buy from point D at my suggested PRICE ZONES. When I mention ZONES there is no specific price but an area of prices that show strong support or resistance depending on the time-frame we are observing. Good luck traders and I hope you enjoy this idea!
If you decide to take the short.....
Entry @ anytime now
TP1 @ .02 cents and to wait for a solid bearish candle closing below .02519 - .02451 BEFORE YOU ENTER
TP2 @ the lower point D at 161.8% taking price to .016 cents
SL should be above .028
--------------------------------------------------------------------------------------
LONG TERM BULL buy in will be at either point D 1 or point D 2 depending on your risk appetite!!!! I will be buying at POINT D 1 as I am a long term holder of TRX. The development of TRONIX is a 10 year roadmap to 2030. Please understand this and trade with care and understanding of this speculative market as congress and regulators decide how this market will continue to develop!
TP 1 & 2 for BULL will be when we go back up to the resistance points. We will be looking for support to develop below and observe it as it develops.
Entry @ .01600
TP1 @ .0250
TP2 @ .0300
TP3 @ .0350
SL @ .01100
I will be updating and adding fundamentals that go with this shortly! GOOD LUCK TRADERS! and THANK YOU FOR LOOKING AT MY IDEA AND SUPPORTING MY VIEW!

TRXUSDT: Cheat Sheet (up to 55%)Here is my plan on how to play both directions TRXUSDT might take:
In case of a breakout to the top of the triangle, I play a buy-in with a safe confirmation roundabout 3 - 4% above the breakout point as conformation.
If on the sell target #1 I see declining momentum, I gonna sell using a constantly updated stop loss.
In case of enough moment, I will be looking towards sell target #2.
In case of a breakout to the bottom, I expect the (very) heavy resistance zone of TRXUSDT to push the price further down.
If .01937 USD gets broken to the downside, we are entering a low resistance area with a likely double bottom at .01100 USD.
Since the support at this level is really strong, I expect a larger bounce to the the sell zone between .01719 and .01936 USD.
In case the support doesn't hold, a stop loss between .01000 and .01050 USD will secure my funds.
Please note that this might play out over several weeks or months, especially if the breakout is to the top of the triangle, due to the heavy resistance zone.
You can watch the live chart here:
www.tradingview.com
Ethereum Donation Address:
0x285C0455D4B8c1b9e9D9f4a03bbFa130fEcD894B
Thank you & Happy Trading!


TRON Like watching paint dry #TRON #TRX #TRXUSDStill watching TRON and waiting for an impulse to validate my count.
Marc

TRON buen analisis para los meses siguientes!vemos a tron encasillado en niveles , vemos que ah tenido una tendencia alcista muy buena , pero el mercado de criptoactivos en general ah estado bajista , asi que el sentimiento es que en cualquier momento puede darse la vuleta por ahora , el precio esta lateralizado puede estallar para cualquier lado

TRX Looks Like It Could Use A BreatherMy TRX analysis has probably been my most spot on analysis so far, so I'm proud of this one. I originally suggested that TRX was bullish after rallying back above its broken support, (in blue) when it was still hovering around 350. Then it broke out of its triangle, as I said was pretty likely given price action. I also suggested that the breakout at 430 would have been a safe long entry. Since then, if one had followed this idea and exited when the weekly RSI reached overbought (above 800), you'd have walked away with 90-100% profits. If you bought even earlier (in the high 200's or low 300's) you'd be sitting at up to 300%. I entered at 376 and then 318. I exited a little early (close to 600), but that's okay. I'm still learning, which is why I don't day trade much. We even overshot my target (green X) but then quickly got rejected.
I called this one very early because the signals were pretty clear to me.
You can see my two previous TRXBTC charts here:
However, as I said towards the end of my last TRXBTC analysis, weekly RSI had reached overbought with heavy volume, which signified we were near a top. I noticed on Reddit a lot of people were trying to time the dip and going "all in" above 700 sats. These people are gamblers, to say the least. I said we'd probably topped out when we were over 800 sats, and since then we have had a pretty major pullback. I think we can now expect a bigger correction. Potential targets would be my red X's. If 660 breaks down, we could fall to the newfound support in the 554 zone (broken resistance) or at 430 (the big breakout point). TRX remains long term bullish, so I wouldn't go full-on bearish until any lower supports are broken. This is simply an idea to show where we could head if we have indeed topped out for now. If we consolidate above 660 and move up, we could break 860 and test 1000-1500.
Of course, we could consolidate here and head higher to retest 860, especially if Bitcoin bounces. If I were to short here, I'd probably set a stop loss. My red targets are zones where I might personally look for re-entry, as I scaled out of TRX and into NEO, which I think is showing a similar bullish accumulation pattern to TRX before its breakout. That's my personal trade though, and it might not play out as I hope it will.
This is not financial advice, and I'm not a professional financial advisor. Just because I made an excellent call once doesn't mean I will continue to do so, and it doesn't mean that my target prices HAVE to be reached. You choose what to do with your own money.
-Victor Cobra

$trx forming c&h can be plotted using the weekly stoch flickson the weekly tron chart we can see a nice cup forming which will soon start dropping to create the handle.
historically the weekly stoch has show good entry and exit points for tron and currently we are on the roof waiting for the drop off (most likely this weekend, post nitron event).
once the stoch leaves the 70-100 zone we will start looking for longs around the mid 500s, however we need to watch out for justins pumpotronic speeches that can cause tron to do stranger things :)


I called the previous Tron bottom. My current thoughts.I have called the previous Tron bottom three months ago. Check that out in the related ideas section.
As you may know, I have been a permabull on Tron for very long. It is because I own Tron myself, and I am biased, but not without reason.
Tron is a good buy and hold.
1. Tron team has cash to last at least until 2021. There was over a billion USD worth of Tron sold at the previous top by early investors. I believe they will provide more capital if needed.
2. Tron has a strong community.
3. Tron has good marketing.
Because of those reasons, Tron will be a good long in the bull market, and I believe it will perform very well. Furthermore, somebody has been painting an accumulation pattern for Tron, so we know that Justin is willing to use his own money to paint a good chart.
Perhaps Tron has bad technology, but what matters most is marketing.
I am not attempting to call the top here, but just know that I will not be buying at these levels. I bought the bottom. I do not want to risk adding more at the top.

Double bottom forming on BTC? Moon soon?I can see a double bottom forming for BTCUSD. BTC dipped under the 150 MA but held at the previous support (roughly 3700 on Bitfinex).
If this level holds on several time frames I can see Bitcoin climbing above the 150 MA, which would "sling shot" the price well over the 200 EMA on 4h. You see this sort of squeeze often, look at historical charts and see how price interacts with moving averages.
If this double bottoms at $3700 I can see this as being the absolute bottom of Elliott Wave 2, going for a third leg up much like we've seen for coins like NEO and Tronix already. It seems Bitcoin is behind in this cycle, understandable with such a giant. This also looks like a bull flag formation.
If all this is true, I can see the third Elliott Wave coming soon, and as we all know the third wave is the longest ;)
****** This isn't trading advice :) ******
