Search in ideas for "tronix"

TRXUSD Is About To ExplodeTronix is about to explode downward. We're seeing a nice squeeze on a daily with the momentum oscillator pointing to the south.
There's virtually no support for TRX as the price is at its lowest since Tron first launched under the Ethereum wing and then broke off to its own mainnet in June 2018.
Short is recommended if we see 2 consecutive down candles on the TTM and oscillator remains below 0.
SL to be set accordingly to your position and target is defined by the TTM and oscillator losing traction.
If you're thinking of investing in Tron long-term, I recommend this article that analyses the fundamental outlook of TRX - bulltrap.io

TRX to two cents before riseTronix has been dropping and looks like its at its final stages - buy as much as you can

Tronix | Wait or SellWith the market speculation, Bull Returning to Market. Tron saw jump from 0.042 to 0.056 partially because of Bull Returning to market and partially because of Tron being listed on many exchanges.
Both of the above factors resulted in heavy buy , Now market seems to slowed down and trade side ways. So what to do now?
If you see the chart, it has formed a cup but where is handle? Handle is yet to be formed. So Just to hold your bets , if you have not entered and want to enter for short term, please hold. If you are already in Tron, then don't sell it yet.
Wait for the handle of tron to be formed(orange line in the chart) , if handle forms then it is Big Signal for Buy, and if it goes down it is big signal for Sell.
Long Term : Buy(anything under 0.06)
Short Term : Sell if price goes under 0.042 and buy if price crosses 0.055
As of now this is the analysis.
If you like post, please like , share and subscribe :)
kryptotimes


Tronix; Will it happen again?The No.1 candle of TD sell setup now is closed. Just look at the chart; Will it happen again?! There is a real better different with previous ones, The new sequential just started after TD but setup completed! It's really good.


TRONIX - TRX - Tron - fib analysis - Tuesday 9th JanuaryThis is my first view on the support line for TRX.


Tronix - Who Needs McAffee Pump and Dumps?(Trade this coin on Binance in my signature below)(And check out the cute bulls in the apparel shop)
TRX is one of the coins I've been trading but haven't been able to chart because Binance. Thanks TradingView!
This was McAfee's last call before he stopped doing Coin of the Day and got "hacked". As you can see, it didn't do much.
This coin has skyrocketed from under a cent to where we are now.
It may have some fundamental value and it may not in a sea of altcoins all promising the world and huge innovation, but, in any event, we're looking at a larger descending triangle on TRX and it gives us an opportunity to make a trade.
LONG
Entry: 235-245 Sats
Target: 355-365 Sats
STOP: 210 Sats
Target is based on the .786 fib of the most recent move measured from breakout to the top, which conveniently converges with where the ramp/mean/trendline from the breakout was broken.
Stop on this trade should be tight as a break downwards is likely to indicate correction and confirm downtrend.
==
Stop the Organ Harvesting Persecution of Falun Gong Practitioners by the Chinese Communist Party
dafoh.org

TRX/BTC: A Gamble with Huge RewardIts not one hundred percent, but this really does look like a continuation inverse head and shoulder pattern, everything matches in terms of volume and shape of the graph. The price objective if the inverse head and shoulders were to break upwards would be 1249 satoshis which can be seen in the purple arrow. In addition there is major support around 300 satochis, the risk/reward on this would be insane, so if one were to invest close to 300 satoshis, there would be extraordinary lower risk for the possible reward. Bitcoin has been a tank lately, powering through everything, so its highly probable that Bitcoin will just steam roll through Tronix despite everything.
Continuation Inverse Head And shoulder:
1.) The general shape and volume match those of an inverse head and shoulder, it can be seen that volume is decreasing throughout the movement and there is a lot less volatility on the right shoulder suggesting possible accumulation.
2.) Using the Moving average convergence divergence (MACD), it can be seen that during the head portion of the last move, as the weekly moving averages converged and had a bullish cross, there was huge upside potential in tronix.
3.) Also, using the stochastic, there were two bullish crosses that occurred in this move, the second one was a significant divergence. (It could be argued that since the divergence isn't as large on the right shoulder when compared to the head, there will not be as much upside potential as well)
However, for something like this to occur, bitcoin would either need to be stagnant while tronix pushes up, maintains its price while BTC drops in price, or increases faster than bitcoin. This is possible, but I don't think it is highly likely, thus, I do believe this is a gamble.

TRX - The Outlier - Time For A Mega Short?Ah, Tronix. Yes, it's actually called "Tronix", not "Tron." The coin with the disappearing wallet. No joke, I made a wallet back in early 2019 for TRX and stored the private key. I like to do things the old fashioned way, so I wrote it down and double-checked it by logging in. The second time Iogged in, I got the notification, "this wallet doesn't exist." Since then, I've been pretty wary of this project. I could go into all sorts of conspiracy theories about Justin Sun, CZ, Binance, stablecoins......but I'll leave that to your imagination.
This is a purely technical setup. TRX is one of the few coins that has maintained higher support levels during this bloodbath. What's up with that? As far as I understand, TRX is burned to help keep the Tron stablecoin USDD pegged to the dollar. USDT recently moved away from the Tron network. Anomalies like this don't usually last long in the crypto market. I'm speculating that this breaks down massively. There's already buzz that TRX will be the next LUNA, but before I say it's going to zero, let's just look at horizontal supports. If TRX cannot hold the 200 MA on the 3 day (teal), and if it cannot hold that orange uptrend, I think it can fall 50% pretty quickly, much like other alts during this period.
On the bullish side, TRX will need to break and hold above the 200 day MA (teal in the below chart)
The 200 week MA lingers just below, at the 4 cents level. Now, the question is - does TRX test the 50 week MA near 8 cents one more time before dumping? Let's find out.
This is not meant as financial advice. This post is highly speculative, and is meant for entertainment :)
-Victor Cobra

TRON 2.618 Support - Bull ContinuationIdentifying the strongest trendline with the fib circles shows the price sitting just above 2.618
With the formation of seemingly a bullflag, this is a very bullish sign
At these levels TRON is very undervalued imo
Bulls will win this battle

TRON Continuation or Bear Wave? TRXUSDUsing fib circles we can see the bear moves and bull moves respective to their fib areas
I hope for a bear wave, to further validate my Fib waves idea
Regardless TRON is very cheap and going long is a nice idea

#Tron/USD Bullish with V.4.0 coming.Tron 4.0 is coming if we can break our 2 major resistance at 0.0157$ and 0.0166$ we can see it take off to 0.018$.

TRON potentially clawing itself up off the ground???After being down in the dirt for so long TRXBTC may be showing bullish signs for a potential reversal!
Slowly but surely TRX has been building an upwards channel which is now looking like it is turning into a higher TF ascending triangle pattern.
IDEAL bull entries would be break of triangle before re-testing to confirm support at 200SAT level. If strong support is shown will be looking
at candlestick formations to enter off bullish engulfing candles on 4HR TF.
Short term play is also possible if Darvis box is formed for internal trend trading.
TP's once triangle is broken, we would be looking at previous structure, TP's at 215, 226, 235 with final TP at 260 for full retracement.
If full retracement occurs, cup & handle formation may be a possibility for longer term bullish play.
LEARN TA! At MBA we teach technical analysis from the basics up, learn to trade with our veteran traders with a community of 200+ other traders;
Link in profile description!

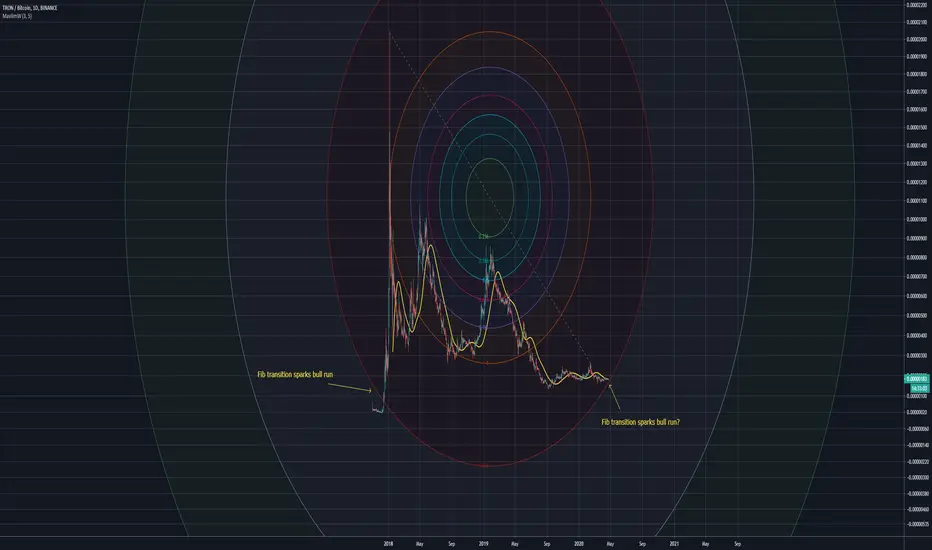
Tron transition ideaTransition between 2.618 and 1.618 fib levels saw a bullrun prior, will it see a bull run this time? Looking for a breakout
TRON Above .236TRON is showing some bullish signs, like many major alt coins. 4H chart.
Alligator is eating bullishly, (jaw lips and teeth are separated)
Sitting above the .236 fib line from retracement from last top
Trading preciously along 1/1 Gann line, I expect a movement into the 1/2 area.

TRXBTC: Long PositionOn the daily timeframe, it floats near support, the situation is similar to XRPBTC : long here is less risky and looks more reasonable. Stop could be tight.
But need to keep in mind (always) overall market conditions because it could change everything.
Information is just for educational purposes, never financial advice. Always do your own research.

TRON Falling WedgeFalling Wedge setup. A lot of these seem to be forming amongst cryptocurrencies, maybe its just my selection preferences.. Included fibonacci retracement levels.

Tron/Bitcoin (July 23) #TRX $TRX #BTC $BTCKeep accumulating TRX this zone because TRX will move so fast. Justin Sun smells this time is not good time to push up, so he delayed his lunch to July 27, that's the begining time for next rally. Hold tight!
Stoploss : Under 230

TRX Thoughts$TRX
Lower TF's look good, however you're still longing into resistance. Wait for break above white box to long on a weekly close.
