How Intermarket Signals Could Help to Avoid Major CrashesThree Crashes, One Pattern
I've been testing whether intermarket analysis can help avoid major drawdowns when selling weekly puts. Here's what the data shows across three very different market crashes:
COVID Crash (Feb-Mar 2020)
Drop: -914.75 points (-22.87%)
Duration: 29 bars, 41 days
Signal: BEAR fired in mid-February, BEFORE the crash
The macro composite dropped sharply as bonds rallied (flight to safety), credit weakened, and VIX exploded. The signal went red weeks before the worst of the selling.
2022 Bear Market (Jan-Jul 2022)
Drop: -837.25 points (-15.25%)
Duration: 137 bars, 199 days
Signal: BEAR fired in early January, stayed red through most of the decline
This was a slow grind lower as the Fed tightened. The indicator stayed in BEAR mode for most of the year, keeping me flat during the worst of it. Notice how the red background covers almost the entire decline.
April 2025 Tariff Crash
Drop: -770.25 points (-13.35%)
Duration: 6 bars, 10 days
Signal: BEAR fired in late March, BEFORE the drop
The fastest of the three crashes - just 10 days. But the macro signals still deteriorated first. Credit (JNK) weakened, volatility spiked, and the composite crossed below its signal line before price collapsed.
The Pattern
Three different causes (pandemic, Fed tightening, tariffs). Three different timeframes (41 days, 199 days, 10 days). But in each case, the macro signals deteriorated BEFORE equities fell hard.
The Core Idea
Markets don't move in isolation. Before major equity drawdowns, stress often appears first in:
TLT (Bonds) - Flight to safety begins
JNK (Credit) - High-yield weakens as credit risk gets priced
DXY (Dollar) - Strengthens as risk-off flows accelerate
VIX (Volatility) - Fear builds in the options market
The indicator normalizes each market using z-scores (standard deviations from 1-year average), then combines them:
Macro Score = (TLT + JNK) - (DXY + VIX)
When this composite trends down and crosses its signal line, conditions favor caution. When it trends up and crosses above, conditions favor risk.
Why This Matters for Put Sellers
Selling weekly puts has attractive math: 90%+ win rate, consistent premium. But the losses when they come are brutal (600% stop loss). One bad week can erase months of gains.
The question isn't IF a crash will happen. It's whether you're holding short puts when it does.
My 5-year backtest on ES 7DTE puts - using TastyTrades backtester:
Without Macro Filter:
357 trades | 96.1% win rate
Total P/L: +$63,492
Max Drawdown: 10.30%
Profit Factor: 2.90
With Macro Filter:
200 trades | 96.0% win rate
Total P/L: +$33,636
Max Drawdown: 2.91%
Profit Factor: 3.51
Key finding: 72% reduction in maximum drawdown.
Yes, fewer trades means less total profit. But avoiding the tail risk changes everything about position sizing and sleep quality.
Current Status: A Challenging Environment
Right now (January 2026), we're in a consolidation range. The macro score is hovering near flat, and with the 7-day EMA setting, signals are flipping almost weekly.
This is exactly the environment where the indicator struggles:
Range-bound price action
No clear macro trend
Frequent signal changes (whipsaws)
Difficult to follow systematically
I'm being transparent about this because it's real. The indicator seems to work well for catching major regime shifts but generates noise during consolidation phases.
Work in Progress
This is not a finished system. It's a research framework I'm actively developing. Areas I'm exploring:
Signal method variations - The indicator offers 7 different methods (EMA Cross, Slope, Momentum, Multi-Confirm, etc.). Some may handle consolidation better.
Longer smoothing periods - The current 7-day EMA is responsive but whipsaw-prone. Testing longer periods for range markets.
Regime detection - Adding logic to identify trending vs ranging environments and adjust sensitivity.
Combining with price filters - Using EMA20 or other price-based filters as secondary confirmation.
The goal is to reduce false signals during consolidation while maintaining the ability to catch major turns.
What It Catches vs. What It Doesn't
Works well for:
Major regime shifts with clear macro deterioration
Gradual credit/bond stress building over days or weeks
Events like COVID, 2022 bear market, April 2025 tariff crash
Struggles with:
Range-bound, choppy markets (like now)
Overnight gaps from surprise news
Idiosyncratic moves unrelated to macro
Short-term whipsaws in flat macro environments
How I'm Using It (Current Approach)
1. Check the indicator before opening new put positions
2. Clear RISK-ON (green, rising): Full position size
3. Clear RISK-OFF (red, falling): No new positions or reduce exposition
The "flat/choppy" category is new - I'm adding nuance rather than treating it as binary. When macro is unclear, I'd rather miss premium than get caught in a whipsaw.
The Honest Tradeoff
What you give up:
Fewer trades = less total premium
False signals in consolidation
Missed rallies when flat
Requires discipline to follow
What you gain:
Avoided COVID crash: -22.87%
Avoided 2022 bear: -15.25%
Avoided April 2025: -13.35%
Significantly better risk-adjusted returns
Ability to size up when conditions are clearly favorable
For me, avoiding those three crashes was worth the whipsaws in between. Your risk tolerance may differ.
Try It Yourself
I've published the indicator with multiple signal methods so you can test what works for your approach:
EMA Cross (what I use) - Classic crossover
Slope - Simple trend direction
Momentum - Rate of change threshold
Multi-Confirm - Requires 4+ methods to agree (more conservative)
Indicator in related ideas below.
What's Next
I'll continue refining this approach and will share updates as I find improvements. Specific things I'm testing:
Longer EMA periods for the signal line
Adding a "flat zone" where macro is inconclusive
Combining macro with price structure (above/below key MAs)
Different parameter sets for trending vs ranging markets
If you have ideas or are working on something similar, drop a comment. This is open research, not a black box.
Final Thought
Three crashes. Three different causes. Three times the macro signals warned before price collapsed.
Is it perfect? No - the current consolidation proves that. But when the big moves come, they tend to show up in credit, bonds, and volatility first.
I'd rather deal with some whipsaws during flat markets than be holding short puts when the next -15% hits.
---
What macro signals do you watch? How do you handle range-bound environments? Let me know in the comments.
Selling


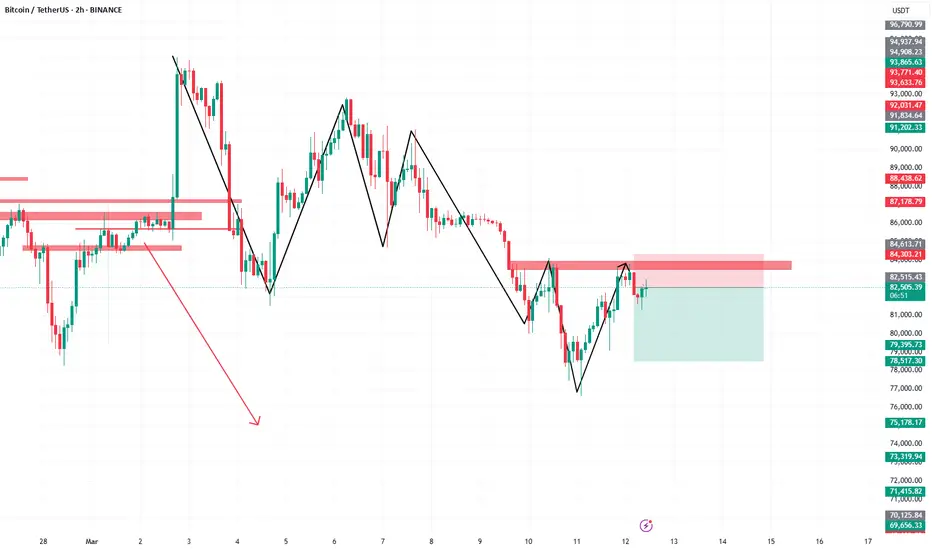
BTC/USDT SELL/SHORTbitcoin can move down
In this analysis, we are observing the potential repetition of market history by comparing the current Bitcoin price action to the previous bearish cycle. By utilizing Fibonacci retracement levels, historical patterns, , we can formulate a hypothesis that the market might follow a similar trajectory if bearish sentiment prevails.
How to find Sell Side Institution Trading ActivitySell Side Institutions are a major market participant. They are often called "Wall Street"
These giant banks and financial services companies do a variety of trading activities. They move price in an entirely different way than the Buy Side Institutions.
Sell Side Institutions have specific services they provide to the stock market including Market Making when there is a void of buyers. Sell Side make the market by selling short before market opens when the overall market has more retail sellers than buyers.
Sell Side also does all the buybacks for major corporations. Sell Side also are strictly short term trading trading a variety styles and strategies throughout the day. Sell Side has the best of the best floor traders who are the most experienced and savvy traders in the world.
Join this discussion to find you how you can learn to trade with the Sell Side and what indicators to use in your Tradingview software.

SHORT ON NAS100Nas has been failing to break highs.
Highs continue to get Lower coming from a major resistance area.
Telsa, Amazon and others facing back lash for many political reasons. (negative)
I will be selling nas before unemployment news today that expect more people to be unemployed. (negative)
News could set this trade on Fire to the downside.

SHORT ON CAD/JPYCAD/JPY is currently in its pullback phase seeking liquidity for its next rise up.
I will be selling to the nearest demand level then I will be looking for price to change structure to get in for a buy.

SHORT ON GBP/USDGreat setup on GU
Price is falling from a major supply zone.
I will be selling GU to the next level of Demand.

SHORT ON GBP/CHFNice Market structure change from up to down on GBP/CHF
I am selling to the next level of support.

SHORT META Ahead of Earnings Report Based on Insider Selling"Meta Platforms Insider Sold Shares Worth $22,132,922"
Mark Zuckerberg, 10% Owner, Director, Chair of Board and Chief Executive Officer, on January 15, 2025, sold 35,921 shares in [eta Platforms. Following the Form 4 filing with the SEC, Zuckerberg has control over a total of 353,696 shares of the company, with 353,696 controlled indirectly.
Jennifer Newstead, Chief Legal Officer of Meta Platforms sold 905 shares of Class A Common Stock on January 14, 2025, at a price of $604.54 per share, totaling $547,108. Following the transaction, Newstead directly owns 31,105 shares of Meta Platforms.
Jennifer Newstead, Chief Legal Officer of Meta Platforms, sold 905 shares of Class A Common Stock on January 21, 2025, at a price of $618.0 per share, totaling $559,290. Following the transaction, Newstead directly owns 30,200 shares of Meta Platforms.
The sales were conducted under a Rule 10b5-1 trading plan adopted on November 30, 2023.
Olivan Javier, Chief Operating Officer of Meta Platforms, sold 413 shares of Class A Common Stock on January 21, 2025, at a price of $618.0 per share, totaling $255,234. Following the transaction, Javier directly owns 16,275 shares and indirectly owns 95,287 shares through various entities.
The sale was conducted under a Rule 10b5-1 trading plan adopted on August 30, 2023.

Breakout Signals via Asymmetrical AveragingSpecial Application of Average Bullish & Bearish Percentage Change Indicator
INDICATOR AVERAGES BULLISH AND BEARISH VOLATILITY SEPARATELY THROUGH THEIR NATIVE PAST CANDLE COUNT. NOT PERIODICALLY!
Asymmetrical averaging is a versatile technique that involves assigning different lengths for independent averaging of opposite market forces. This adaptability uncovers high-probability breakout signals by establishing a threshold that filters out irrelevant fluctuations.
Below, I illustrated 2 practical examples of the method applied to bullish and bearish breakout scenarios:
Bullish Breakout Example:
Set the bullish averaging to 30 and the bearish averaging to 1000.
If the bullish average consistently surpasses the bearish threshold, it indicates robust buying momentum and a potential breakout to the upside.
The extreme bearish average establishes a consistent baseline, filtering out short-term fluctuations and focusing on significant upward momentum to deliver reliable bullish breakout signals.
Bearish Breakout Example:
Set the bearish averaging to 30 and the bullish averaging to 1000.
If the bearish average rises above the bullish threshold, it signals growing selling pressure and a potential breakout to the downside.
The extreme bullish average provides a steady reference point, eliminating minor fluctuations and isolating significant downward momentum for dependable bearish breakout signals.
LINK TO THE INDICATOR:

Raw VS Percentage Volatility FormatA Quantitative Comparison of "Buying & Selling Pressure" and "Average Bullish & Bearish Percentage Change"
In market analysis, the choice of averaging method can profoundly influence the insights derived. The "Buying & Selling Pressure " and "Average Bullish & Bearish Percentage Change" indicators demonstrate the unique strengths of fixed-period and candle-count-based averaging approaches.
Key Differences Between Fixed-Period and Candle-Count Averaging
Fixed-Period Averaging in BSP:
➡︎ In "Buying & Selling Pressure", candle metrics are averaged over a defined period (e.g., 14 bars).
➡︎ This provides rapid insights into market sentiment changes, making it ideal for tracking incentive shifts and volatility in real time.
➡︎ However, because this method includes all candles in the averaging window, it may reflect short-term fluctuations, offering less stability compared to candle-count-based methods.
Candle-Count Averaging in ABBPC:
➡︎ "Average Bullish & Bearish Percentage Change"uses a predefined count of bullish or bearish candles for averaging percentage changes.
➡︎ This produces stable and reliable values, which are less sensitive to noise and better suited for risk and reward assessment.
➡︎ The focus on specific candle states ensures that only relevant market behaviors contribute to the averages.
Using Percentage Change for Risk Definition
One of the greatest strengths of the "Average Bullish & Bearish Percentage Change" indicator is its ability to assist in risk and reward calculations with much more market related figures instead of raw values of volatility:
Defining Risk
The average percentage change of bearish candles can serve as a dynamic stop-loss level.
For example, if the average bearish percentage change over the last 10 candles is 2%, a trader can set a stop-loss at 2% below their entry to account for typical market behavior.
Quantifying Reward:
The average bullish percentage change helps identify realistic profit targets.
If the average bullish percentage change over the last 10 candles is 3%, a trader can set a target at 3% above their entry to maintain a favorable risk-to-reward ratio.
Dynamic Adjustments:
As the market evolves, these average percentage changes update, allowing traders to adjust their risk and reward levels in real time for better precision.
Quantitative Advantages of Percentage Change Averaging
Normalization Across Price Levels:
Percentage changes enable consistent comparison across assets with vastly different price ranges.
Enhanced Stability for Risk Assessment:
Candle-count averaging smooths out noise, offering a reliable basis for setting risk parameters like stop-losses and profit targets.
Improved Predictability:
By isolating specific candle behaviors, percentage-based metrics provide clearer signals for trend-following or mean-reversion strategies.
Advantages of BSP’s Fixed-Period Averaging
Despite being less stable, "Buying & Selling Pressure " excels in areas requiring speed and adaptability:
Fast Incentive Tracking:
Period-based averaging adapts quickly to changing market conditions, providing timely insights into shifts in buying or selling pressure.
Broad Volatility Capture:
BSP includes all candles in the defined period, capturing overall market dynamics, including sudden spikes or reversals.
Real-Time Decision Making:
Its responsiveness makes it highly suitable for momentum or breakout trading strategies.
Bottomline:
Use "Average Bullish & Bearish Percentage Change" for stable, consistent data ideal for risk assessment, particularly when defining dynamic stop-loss levels or profit targets based on average percentage changes.
Use "Buying & Selling Pressure " for its speed and adaptability in tracking real-time shifts in market incentives and capturing volatility.


Bearish Continuation SetupLooking for Continuation Trade, Just wait for a Valid retest with Bearish Conformation with the Help of Candlestick Patterns for better Risk Management.

GBPJPY H8 - Short SignalGBPJPY H8
We have a nice setup here yet again, with our crosshairs on that 193 handle for GBPJPY. Last weeks price movement on Friday was wild, to say the least, over the eastern session we took off 100's of points, before closing the day down towards 190 price. 600 points from top to bottom we saw, from the likes of ***JPY, this was very impressive!
With the exception of the fakeout to the upside, albeit it headline driven, we have now seen a subsequent correction, which takes us back towards that 193.000 handle, a confluence zone and an area we could look to sell.
Stops would be around 50 points at 193.500 covering recent highs, and take profit targets would be every 100 points.

BANKNIFTYI Observed these Levels based on price action and Demand & Supply which is My Own Concept Called "PENDAM CONCEPTS" ... Please Don't Take any trades based on this chart/Post...because this chart is for educational purpose only not for Buy or Sell Recommendation.. Thank Q

KEY KeyCorp Options Ahead of EarningsLooking at the KEY KeyCorp options chain ahead of earnings , I would buy the $14 strike price Puts with
2023-6-16 expiration date for about
$0.27 premium.
If the options turn out to be profitable Before the earnings release, i would sell at least 50%.
Looking forward to read your opinion about it.

SHORT ON NZD/USDNice head and shoulders on the daily.
Clean break of the neckline and the previous day low.
Dxy is bullish and looking strong.
I will be taking the follow trade on NZD/USD
MARKET SELL NOW
ENTRY - 0.60781
SL - 0.61418 63 PIPS
TP - 0.58534 224 PIPS

Short entry Trading below 200 moving averages
Shortd 30qty it tried to move up but unfortunately it break the support of 200 moving average n now going down 6 7% profit target for down side stoploss above today's high

Gradual Gold meltXAUUSD analysis:
Gold has broken the descending trend-line that was connecting the bodies of the candles on the 4H this was (also acting as a resistance) line holding price.
Another descending trend line has been issued this time wick to wick to see if we have a fighting chance on the 4H but if this one will not hold we might see price approach the next major resistance area @ 2401.93.

GRPN, THE LITTLE COUPON APP THAT COULD (EARNINGS CHART)Can it keep going? Technically, yes. I see numbers up to $40.
However, I'm posting this because I see this idea as far more likely to occur is some form.
It looks like a potential top is about to occur.
At these levels, with momentum, a drop could take price as low as $4. If not lower, down to $2.
It's hard to be bullish on this stock with a chart like this.
In other words, I'm saying, I don't know if there is more upside, and if there is, I'm okay with missing it because I'd rather not be wrong and ultimately lose money on the downside.
Mostly a question of risk vs reward.
I would ultimately be bearish overall.
I think the pink zone might see a top and I think we could see trends break all the way down to the blue zone.
Current pattern is highlighted.

XAUUSD SELLING OPPURTUNITY 💯Discover an enticing Selling opportunity in GOLD as it undergoes a critical retest of a key resistance area. With market analysis, technical indicators, and price action as your allies, evaluate the potential downside move. Stay vigilant and informed to capitalize on this precious metal's market dynamics.

XAUUSD 90% CONFIRM ANALYSISDiscover an enticing Selling opportunity in GOLD as it undergoes a critical retest of a key resistance area. With market analysis, technical indicators, and price action as your allies, evaluate the potential downside move. Stay vigilant and informed to capitalize on this precious metal's market dynamics.

COPPER! Is the party over?Targets met. Activity in an options portfolio that was poised to rise before the market rose (INSIDER) resold 4.14 calls into the market. Made 400% on that strike. How about that? Is it worth studying options strategies and tracking the activity of the big players?
