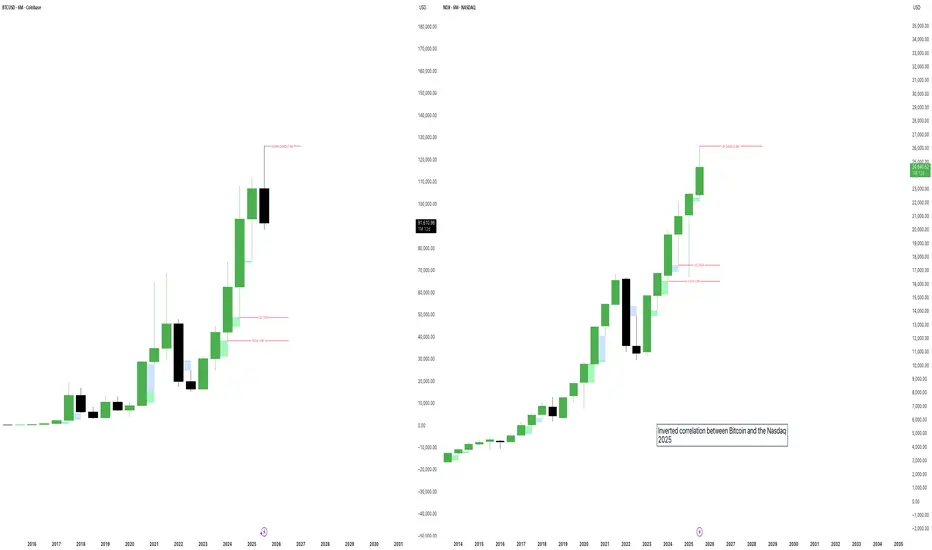
Inverted correlation between Bitcoin and the Nasdaq 2025There have been unusual behaviors between the NQ and BTC, which are normally highly correlated assets. However, this year the April dump on the NQ pushed the price down to the Q2 2024 low and came very close to the overall 2024 low — it missed it by only about 300 points. Bitcoin, on the other hand, wasn’t even close to its Q2 2024 low: the price dropped to $74,500, while the Q2 low sits at the $49,000 level.
On the flip side, the current 6-month candle on the NQ is still strongly bullish (as of November 20, 2025), while BTC’s 6-month candle is already strongly bearish. It opened at $107,000, and yesterday’s low (November 19) was $88,500 — meaning it would take a significant move for Bitcoin to close the half-year candle in the green, especially with less than six weeks left until the end of the year.
I’m very curious to see how the year closes out. Personally, I remain on the bearish side and have been shorting the market since $124,500 on BTC, adding to the position again at $115,500 and $107,300.
Greetings to all.
Sellsideliquidity
Liquidity Voids: Where Price Runs Through Empty Space█ Liquidity Voids: Where Price Runs Through Empty Space
Big moves don’t just “happen”, they happen because either buyers or sellers step aside and let price run.
A liquidity void is what’s left behind when that happens: an area on the chart where price traded with very little volume, leaving a ‘hole’ in market participation.
This is not just another fair value gap. A typical FVG can form on normal volume during strong momentum. A liquidity void specifically signals a displacement under thin conditions, meaning the move was too easy, and price often comes back to check that area later.
█ What Exactly Is a Liquidity Void?
Think of the order book as a ladder of bids and asks. Normally, price moves step by step as orders fill at each level. But when there aren’t enough orders (low liquidity), price jumps levels and that jump is your void.
On a chart, it shows up as:
A large, one-directional candle with very small or no wicks overlapping neighbors.
Little or no volume relative to the move’s size (thin participation).
Price displacement that looks almost “too clean” — no hesitation, just a straight run.
These clues tell you price didn’t just move on heavy buying/selling, it moved through empty space.
⚪ Liquidity Void Detector
Use this free Liquidity Void Detector indicator to spot liquidity voids. It signals when the market makes a relatively sharp move on comparatively low volume, helping you spot these voids in real time.
█ Why Low Volume Matters
⚪ Not All Gaps Are Voids
A fair value gap can form on high participation, think of a breakout candle with heavy volume and institutional backing. That’s an accepted price move.
⚪ Voids Are Different
A liquidity void happens when the market skips prices because there was no one there to trade. It’s an inefficient move that the market often wants to revisit and “fill in” once participation returns.
⚪ Volume as the Filter
When volume is below its own average (or below a trend baseline), it tells you this wasn’t a “healthy” move, it was a thin-book displacement.
█ How Traders Use This
⚪ Mark the Zone
Draw the high and low of the candle(s) that created the void. This is your “inefficiency zone.”
⚪ Wait for the Return
Voids often act like magnets. Price often reverses and retests or fills the void, but it can just as easily slice through the zone once revisited, as thin liquidity offers little resistance.
█ What Research Show
Academic studies on price gaps find that immediate fills are rare, but the probability of fill rises over time. Downward voids (panic selling) fill faster on average than upward voids.
Crypto traders track CME Bitcoin gaps and report over 80–90% eventually get filled, but timing is unpredictable.
Volume-adjusted strategies outperform simple gap-filling because they focus on inefficient moves, not every gap. The key is filtering for thin participation.
█ Bottom Line
Liquidity voids are not just gaps, they are evidence of skipped prices under low participation.
They tell you where price moved “too easily,” leaving behind unfinished business.
Learn to filter for low-volume displacements, mark those zones, and watch how often price comes back to rebalance them. This turns a random candle into a predictive level, one that can guide your mean reversion trades or act as a support/resistance flip in trending markets.
-----------------
Disclaimer
The content provided in my scripts, indicators, ideas, algorithms, and systems is for educational and informational purposes only. It does not constitute financial advice, investment recommendations, or a solicitation to buy or sell any financial instruments. I will not accept liability for any loss or damage, including without limitation any loss of profit, which may arise directly or indirectly from the use of or reliance on such information.
All investments involve risk, and the past performance of a security, industry, sector, market, financial product, trading strategy, backtest, or individual's trading does not guarantee future results or returns. Investors are fully responsible for any investment decisions they make. Such decisions should be based solely on an evaluation of their financial circumstances, investment objectives, risk tolerance, and liquidity needs.

XRP Pullback Play — 0.786 Fib Meets Sell-Side LiquidityXRP is currently in a pullback phase. The next high-probability long setup is at the 0.786 Fibonacci retracement, aligning with a Sell-Side Liquidity (SSL) zone.
🟢 Long Trade Setup
Entry Zone: 0.786 retracement
Stop-Loss: Below $2.80
Take-Profit 1: $3.00 (mOpen)
💡 Educational Insight
Sell-Side Liquidity (SSL) represents the pool of stop-losses and pending buy orders resting below recent swing lows. Price often seeks these liquidity pockets before reversing.
The 0.786 retracement aligns with this SSL zone, creating a high-probability setup.
However, confirmation should come from order flow → monitoring absorption, delta shifts, or footprint imbalances at this level will validate whether buyers are stepping in before entering.
🔍 Indicators used:
DriftLine — Pivot Open Zones → For identifying key yearly/monthly/weekly/daily opens that act as major S/R reference points
➡️ Available for free. You can find it on my profile under “Scripts” and apply it directly to your charts for extra confluence when planning your trades.
_________________________________
💬 If you found this helpful, drop a like and comment!

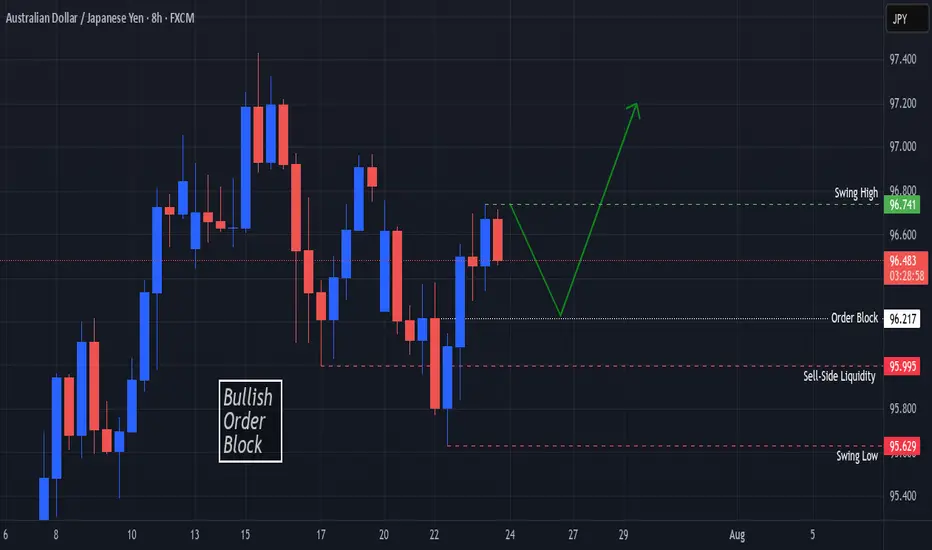
AUDJPY Bullish Order Block In SightOANDA:AUDJPY Price finds Support at the Swing Low @ 95.629 and creates a Swing High @ 96.741!
Based on the ICT Method, the Swing Low broke Sell-Side Liquidity @ 95.995 and opened up a Bullish Order Block Opportunity @ 96.217!
Price is currently working down from 96.49 at the time of publishing but once Price visits the Order Block, this could deliver Long Opportunities!!
BTC to move upwards this week?Daily Outlook:
- market swept sellside liquidity
- price moved impulsively
- market moving higher reaching buyside liquidity
- may reach ATH and sweep to go lower

BTCUSD Rejection Setup – Order Block Hit, Weak Lows in Sight!📉 BTCUSD is setting up a textbook bearish reversal — Smart Money style.
This 1H chart shows Bitcoin tapping into a high-timeframe Order Block at ~$104,190–104,560, with a clear rejection from the premium zone and confluence with the upper trendline.
📊 Technical Breakdown:
✅ Order Block tapped at $104,190–104,560
✅ Strong rejection candle near the trendline resistance
✅ Price failed to break above the Strong High — a sign of Smart Money distribution
✅ Targeting Sell-Side Liquidity at $101,420
✅ Final target? Weak Low and liquidity pool around $99,189
🔍 Smart Money Confluence:
Price has moved into a premium selling zone, aligning with the upper bounds of market structure
Order Block rejection suggests institutional selling interest
Weak lows below $100K are prime targets for liquidity grabs
Retail longs are likely trapped — ideal conditions for a downward sweep
🧠 Institutional Logic:
Smart Money doesn’t chase price — it delivers it. This move likely represents a "Mitigation and Distribution" phase before a deeper selloff:
📌 Mitigation of previous long positions inside the OB
📌 Distribution at the highs before targeting the next liquidity pool
📉 Trade Idea:
Short Entry Zone: $104,200–104,500
Targets:
TP1: $101,420 (Sell-side Liquidity)
TP2: $100,000 (Psych level / Weak Low)
TP3: $99,189 (Liquidity Magnet)
Invalidation: Clean break and close above $104,800 (above the OB and Strong High)
🧠 Tip for Traders:
Wait for a confirmation bearish structure shift or lower high on the LTF (15m/5m) before entering full size. Smart Money leaves clues — not impulses.
💬 Comment "BTC Setup" if you’re trading this drop
🔁 Save this analysis — this is how Smart Money dominates crypto markets.

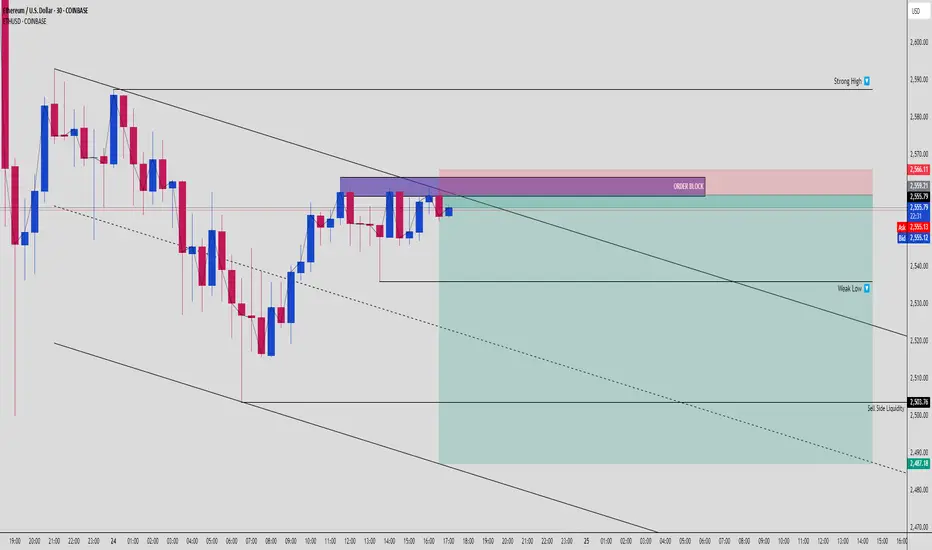
ETHUSD Bearish Trap Unfolding: FVG Fill Targets Sell-Side Liq!🚨 ETHUSD – Smart Money Bearish Setup (30-Min Timeframe)
Ethereum just gave us a beautiful SMC reversal setup after a short-term range liquidity sweep. Let’s break this down so you don’t miss the next leg. 👇
🔍 1. Structural Liquidity Sweep
A clean grab above internal highs pushed price into a well-defined premium zone where both Order Block (OB) and Fair Value Gap (FVG) reside. It’s not a bullish breakout – it's a liquidity trap.
The strong high at ~$2,566 hasn’t been breached, meaning structure still leans bearish.
🟪 2. Order Block Reaction Zone
Price is tapping directly into a bearish Order Block zone (~$2,559–2,566), showing hesitation and rejection candles.
💥 OB rejection confirmed with wicks and short-body closes
🔻 Follow-through expected down to clean up inefficiencies below
This is where Smart Money quietly enters short – right before the crowd realizes it wasn’t a real breakout.
🟦 3. Fair Value Gap (FVG) Below Price
A large FVG zone (~$2,553–2,503) is waiting to be filled. This is textbook Smart Money behavior – price rallies into premium, rejects OB, and aggressively seeks to rebalance inefficiency below.
📉 4. Weak Low & Sell-Side Liquidity
Below $2,530 lies a Weak Low, likely to be swept as price seeks out Sell-Side Liquidity. Final target sits at ~$2,487, right before the broader demand re-enters.
This is a liquidity vacuum move:
Price is engineered to sweep internal liquidity → break structure → mitigate deeper imbalance.
🎯 5. Trade Setup Breakdown
📍 Short Entry Zone: $2,555–2,566 (OB + trendline + FVG rejection)
🔐 Stop Loss: Above $2,570 (structure break level)
🎯 Take Profit Zones:
TP1: $2,530 (Weak Low sweep)
TP2: $2,503 (FVG base)
TP3: $2,487 (Sell-Side Liquidity)
⚖️ Risk:Reward Ratio – 1:3 or better
💡 Bonus: Add trailing stop after TP1 for locked-in gains
🧠 Market Psychology Lesson:
Retail sees a breakout of range = FOMO buys
Smart Money sees trapped longs = entry fuel for bearish move
Weak lows = targets
Your job = be the hunter, not the hunted. 🎯
✅ Summary:
ETHUSD is setting up for a classic bearish SMC reversal. Price tapped the OB, respected structure, and is showing a roadmap toward Sell-Side Liquidity below $2,500.
Don’t fade the confluence:
Premium OB + FVG
Rejection wick confirmations
Weak low + clean internal liquidity targets
⚠️ Keep emotions out, follow the setup, manage risk like a sniper.
💬 Type “ETH ON LOCK” if you’re tracking this beast with precision. Tag your trading squad!
POLKADOT - Strategic Patience for the Next MovePolkadot: Strategic Patience for the Next Move
I've been holding Polkadot since $5.82 and still have my trade open. While I haven’t taken profits yet, this time I plan to secure gains once it approaches $10 again, as I anticipate a correction around December 18th. This pullback could last until December 23rd, where I aim to significantly increase my position.
📈 Scalping Opportunities:
For now, patience is key. However, scalpers will find plenty of opportunities leading up to December 17–18. Be vigilant during those dates, as volatility may spike.
💡 Swing Trading Insight:
Any swing trades entered on December 23rd or the early hours of the 24th could offer exceptional returns.
⚠️ Key Advice:
Always stick to your plan.
Don’t let greed cloud your judgment—secure partial profits to maintain liquidity.
From January onward, the market's psychological and analytical demands will increase. Be prepared and don’t get distracted by noise.
🔑 Closing Thoughts:
This market rewards discipline and foresight. Stay sharp, stay humble, and remember: the best opportunities often come to those who are patient and prepared.
May your trades be fruitful.
God bless you.
—Jay

Bitcoin Wait for a good longThe bullish case is strong, but proper risk management is essential if you're looking to go long. The current market is heavily overleveraged with long positions, causing sharp wicks and rejections, typical of a bull run.
I plan to wait and open a position at $60,750, keeping in mind that the price could drop further to $57,700, where I also plan to enter. However, don’t sleep on that level—it might be the last opportunity to open a long at a good price!
BINANCE:BTCUSD

WTI USOUSD Short day tradingBearish Arguments
VANTAGE:USOUSD
Previous Month Low (PML) is holding strong.
Previous Week Low (PWL) remains unbroken.
Previous Day Low (PDL) is respected.
Daily Bearish Fair Value Gap (FVG) is acting as resistance.
Monthly Bearish FVG is also being respected.
4H Bearish FVG is holding.
4H Swing High is capping price action.
4H Swing Low is holding as a short-term support, but may break down soon.
Trade Management
Risk-Reward Ratio (RR): 2
Stop-Loss (SL): Placed near the 4H FVG to protect against upward moves.
Take-Profit (TP): Targeting the swing low (SSL). Although price could extend lower, securing profits in this zone ensures gains in case of a rebound.
Risk: 3%

XRP Wait for the HUGE opportunity🔻 Tough week for $XRP. The price has been a rollercoaster 🎢, leaving investors exhausted.
💡 Opportunity: The next time the market picks up momentum, we could see a major breakout. I'm looking to go long in the marked zone.
⚠️ Advice: Don't rush in expecting a bounce. Save liquidity and stay patient until the right opportunity comes. Patience pays 💰.
BINANCE:XRPUSDT

ARB/USDT 15m / D BB & FVG / ELLIOT / LIQUIDATIONS / FIBOAccording to higher timeframes, the market sentiment is bullish. We are moving within an ascending channel with the potential to rise to 0.7416. To increase the probability of this outcome, the price needs to establish itself above the ascending channel.
Locally, within the range of the daily breaker block (D BB) and the daily imbalance (D FVG), three potential entry points are visible:
1. Liquidity grab (Sellside liquidity)
2. 0.5 Fibo
3. 0.618 Fibo / bottom of the ascending channel
4. The target is the local high, which is at the midline of the channel.
Locally, based on the EFIATR oscillator, volume, and liquidation levels, there is a likelihood of growth. According to Elliott Wave theory, a 5-wave pattern and an ABC correction in the 4th wave are visible, which further increases the probability of upward movement.

BTCUSD: The Rally Is Just Beginning, Probability Confirms6M: BITSTAMP:BTCUSD
3M: BITSTAMP:BTCUSD
1M: BITSTAMP:BTCUSD
2W: BITSTAMP:BTCUSD
1W: BITSTAMP:BTCUSD
3D: BITSTAMP:BTCUSD
1D: BITSTAMP:BTCUSD
If you have any questions, need further clarification, or would like to share your own insights, feel free to leave a comment below!
The information provided is for educational purposes only and should not be considered financial advice. Trading involves risk, and you may lose some or all of your investment. Always conduct your own research and consult a licensed financial advisor before making any trading decisions.

58.55% Probability of USOIL Bullish Continuation This Week!Based on a mechanical top-down structural analysis from higher to lower timeframes, there's a strong probability (58.55%) of a bullish continuation in USOIL this week.
This analysis, combined with hourly timeframe probabilities , suggests a favorable outlook for price movement.
Follow me with the detailed top-down analyses linked below to see the key factors contributing to this bullish projection on FX:USOIL
12M:
6M:
3M:
1M:
2W:
1H:
2H - Entry:
Take a look at these analyses to see the details behind this trade idea.
If you have any questions or want to discuss further, feel free to ask.
Let's make this a great trading week!

TSLA: Short-term Probability Analysis | 57.35% Reversal!Short-term analysis of NASDAQ:TSLA indicates that the price is most likely to head to trade above +$200 in the coming days/weeks.
Breaking down the reason behind the current setup and why we should be expecting new mid-term highs:
Feel free to share your thoughts or any feedback you have on the analysis.
Also, if you're interested in analyzing the probabilities directly on your charts make sure to check out the Free Public Indicator that I've published recently!

ETHUSD: Bouncing back to ATH | 66.67% Probability!COINBASE:ETHUSD has been getting a lot of attention in the crypto world lately.
It recently went through a big drop in price (-25%) , but now it's showing signs that it might be bouncing back and heading bullish again.
Here's what you need to know:
ETH's price dropped a lot over the past 2-3 months, and it's been consolidating since then. According to my Free Probability Indicator , there's a good chance that ETH's price could hit a new high. Around 66% chance on the 3D chart and 62% on the daily chart which is a pretty high number!
This drop in price could actually be a good thing because it's created a big opportunity to buy ETH at a lower price. Right now, it's about 38% cheaper than its highest price ever.
If you're thinking about trading ETH, here's what you should consider:
Entry:
Wait for clear signs that the price is going up again, like breaking through certain price levels or seeing strong positive movements on the daily chart.
Once you're confident the trend is changing, you could think about buying ETH.
I'm currently looking at 4H Equilibrium to get position
Exit:
To protect yourself from losses, you might want to set a "trailing stop-loss." This means if the price starts dropping again after you buy, your sell order will automatically trigger to limit secure your running profits.
Risk Management:
Make sure you're not risking more money than you can afford to lose.
Only invest what you're comfortable with, and consider how much you're willing to lose if things don't go as planned.
This isn't any financial advice. It's just some insights to help you make informed decisions.
Always do your own research before investing in anything.

SOLUSD: Snapping Back to $210 | 70.70% Probability!BINANCE:SOLUSD has been drawing a lot of attention in the crypto space in the past few days due to its integration with NASDAQ:PYPL
Let's have a technical analysis breakdown:
BINANCE:SOLUSD According to my Free Probability Indicator , There's a 70.00% chance it could climb back over $210 and beyond, which is pretty much encouraging!
If you're thinking about trading LINK, here's what you should consider:
Entry:
Wait for clear signs that the price is going up again.
Once you're confident the trend is changing, consider buying LINK.
I'm currently looking at the 8H Equilibrium to get positioned.
Exit:
To protect yourself from drawdowns, consider setting a "trailing stop-loss." This will automatically trigger a sell order if the price starts dropping again after you buy, securing your running profits.
Risk Management:
Ensure you're not risking more money than you can afford to lose.
Only invest what you're comfortable with and consider how much you're willing to lose if things don't go as planned.
This isn't financial advice, just some insights to help you make informed decisions. Always do your own research before investing in anything.

LINKUSD: Rallying Back to $20 | 72.73% Confidence!COINBASE:LINKUSD has been drawing a lot of attention in the crypto space in the past few days. It experienced a significant drop in price (-47%), but now it's starting to show signs of a potential rebound and might be heading bullish again.
Here's the breakdown:
COINBASE:LINKUSD price took a major hit over the past 2-3 months and has been consolidating since. According to my Free Probability Indicator , There's a 72.73% chance it could climb back over $20, which is pretty much encouraging!
This price drop might actually be beneficial as it presents a great opportunity to buy LINK at a lower price.
If you're thinking about trading LINK, here's what you should consider:
Entry:
Wait for clear signs that the price is going up again, like huge up-move candle showing strong positive movements on the daily chart.
Once you're confident the trend is changing, consider buying LINK.
I'm currently looking at the 4H Equilibrium to get positioned.
Exit:
To protect yourself from drawdowns, consider setting a "trailing stop-loss." This will automatically trigger a sell order if the price starts dropping again after you buy, securing your running profits.
Risk Management:
Ensure you're not risking more money than you can afford to lose.
Only invest what you're comfortable with and consider how much you're willing to lose if things don't go as planned.
This isn't financial advice, just some insights to help you make informed decisions. Always do your own research before investing in anything.

BTCUSD: The Game of Probabilities | New ATH? 65.28% Chance!Medium-term analysis of COINBASE:BTCUSD indicates that the price is poised to surge towards new all-time highs, with a probability of 65.28%!
Let's get into the underlying reasons for this:
1. The current status on the "1D" timeframe is "Active," indicating that the price has already reached and touched the 50% equilibrium level on the current timeframe.
2. Since the price has reached the equilibrium level of the daily timeframe, our focus now shifts to determining which liquidity side presents higher probabilities compared to the other.
3. In this scenario, the 1D/BSL (Buyside liquidity) indicates a 65.28% probability of the price reaching the 73835.57 level again.
More details:
Feel free to share your thoughts or any feedback you have on the analysis.
Also, if you're interested in analyzing the probabilities directly on your charts make sure to check out the Free Public Indicator that I've published recently!

GBPAUD POTENTIAL FOR THE UPSIDE Price has potential for the upside from the IRal to ERL move testing the daily OB. Targeting Previous daily highs as liquidity. Look for lower timeframe price action to confirm the move.

GBPAUD POTENTIAL FOR THE UPSIDE Potential IRL to ERL move, from the test of the daily OB and 4H FVG.Expecting Buyside Liquidity to be targeted. Wait for 1H structure shift and M5 MMBM to confirm the move.

TRADING FOUNDATION: WHY DOES PRICE MOVE (PART 1 - LIQUIDITY)WHY DOES PRICE MOVE IN THE FOREX MARKET?
A simple answer to this question is... price moves for 2 major reasons
To take liquidity
To fill imbalances or price inefficiencies
I will break this into two parts and discuss Liquidity first.
What is Liquidity in Forex Trading?
Liquidity is the presence of orders at specific prices in the market, ensuring that transactions can take place without disruptions. When traders talk about liquidity, they are usually referring to the resting orders in the market. These orders can be absorbed or targeted by banks and financial institutions (BFIs) to influence the patterns of price movement. Liquidity can be found throughout the market, although certain areas may have higher levels than others. The good news is that it is indeed possible to learn how to identify and recognize liquidity patterns.
Liquidity comprises a variety of orders that gather in the market, including limit orders, stop loss orders, and stop limit orders. These orders come into play when prices reach specific levels of supply or demand in the market. Understanding liquidity is essential in comprehending how prices move.
Why do you need to understand Liquidity?
Liquidity is crucial for predicting price movements. Analyzing liquidity, along with market structure, supply and demand, and order flow, provides insights into potential price directions. It's important to consider liquidity alongside trend analysis and supply and demand to understand market conditions effectively. Highly liquid markets can be manipulated by large banks or institutions, leading to liquidity shortages, price slippage, and poor trade execution. Recognizing liquidity pools during slow sideways price movements is key.
What are the main types of Liquidity in Forex trading?
1. Buy-side liquidity (see chart for example)
Buy-side liquidity refers to the accumulation of orders above a range or high, including buy-stop limits and stop losses placed by sellers and breakout traders. Banks and financial institutions (BFIs) may target these orders to fuel temporary or sustained bullish price movements.
Buy-side liquidity can be divided into 3
a. Relatively equal highs liquidity
b. Previous high liquidity
c. Trendline liquidity
a. Relatively equal highs: This is when the price fails to break a level within a minimum of two tries. When this happens, there is a high tendency that orders will be above that level i.e. stop-losses or buy-stop orders. Due to this, large institutions will target that level to liquidate their orders or fill new orders. see the example below.
b. Previous high: A previous high is the top of a level or range from which a retracement in price started. Every high in the market holds liquidity. Usually not as appealing at the relatively equal highs. see the example below.
c. Trendline: This liquidity setup is usually as appealing as the relatively equal highs as it provides enough liquidity in the market to liquidate orders of large funds or fill in more orders. Anytime you notice a buy-side trendline liquidity building up, expect that price will move radically fast towards it. see example below
2. Sell-side liquidity (see chart for example)
Sell-side liquidity refers to the collection of orders situated below a range or low, including sell-stop limits and stop losses placed by buyers and breakout traders. Banks and financial institutions (BFIs) can target these orders to generate temporary or sustained bearish price movements. Similar to buy-side liquidity, sell-side liquidity serves a crucial role in the market dynamics.
Sell-side liquidity can be divided into 3
a. Relatively equal lows liquidity
b. Previous low liquidity
c. Trendline liquidity
a. Relatively equal lows: This is when the price fails to break a level within a minimum of two tries. When this happens, there is a high tendency that orders will be below that level i.e. stop-losses or sell-stop orders. Due to this, large institutions will target that level to liquidate their orders or fill new orders. see the example below.
b. Previous low: A previous low is simply put at the top of a level or range from which a retracement in price started. Every low in the market holds liquidity. Usually not as appealing at the relatively equal lows. see the example below.
c. Trendline: This liquidity setup is usually as appealing as the relatively equal lows as it provides enough liquidity in the market to liquidate orders of large funds or fill in more orders. Anytime you notice a sell-side trendline liquidity building up, expect that price will move radically fast towards it. see example below
Note : This does not mean you should just trade based on where you see liquidity, you should also do a proper multi-timeframe analysis, and if your narrative aligns with where liquidity is resting, there is a higher chance for it to go there.
I will make a post on the Part 2 - Imbalances.
Ensure to follow so you see what it is and how to make good use of it.
Cheers,
Jabari

LINK/USDT Long Trade Setup ⬆️Hello Everyone 🙋🏽♂️
RSI +Demand zone + Sellside liquidity
🟠 EP 14.225
🔴 SL 13.806
🟢 TP1 14.679⚠️( Close 33% of the trade and Set the SL on EP )⚠️
🟢 TP2 15.071⚠️ ( Close 33% of the trade )⚠️
🟢 TP3 15.516🔥 ( Final result)🔥
We are not responsible of any losses for anyone, our trades are profitable more for long terms and we take losses as everyone,
manage your lot size as well and your SL and TP and my opinion is 0.01 lot for each 500 $.
Don't forget to hit the like bottom and write a comment to support us.
Follow us for more 🙋🏻♂️
Best Regard / EMA Trading .
Disclaimer:
----------------
It's not a financial advise, As everyone we take losses sometime but for long term trading we are profitable traders, so manage your account well with SL and TP and your lot size to keep your account safe and stay in the market
