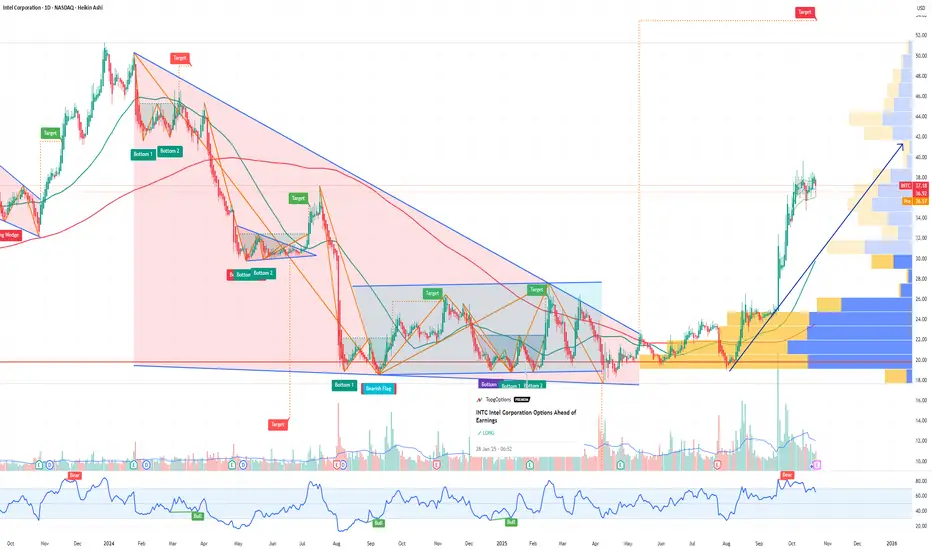
Intel Corporation | INTC | Long at $44.26Entered Intel NASDAQ:INTC after-hours at $44.26. The US government is too heavily invested in this one to let it truely slide. The earnings / EPS projections show a likely major turnaround. Any dips are purely programmatic for entry (watch insiders and politicians . I may sound like a conspiracy theorist here, but a $8.9 billion investment from the US government is absolutely going to lead to major returns by 2028/2029. There is a major price gap a lot of people aren't seeing all the way back to the year 2000 between $71.38 and $73.44. That's my main target. And, like dot-com crash, it may go further until.... So, in the near-term, there could be weakness and a dip to retouch the historical average band ($30's - another entry). But my outlook is longer. And, given the need for chips and the government wanting a major return on their investment, I suspect this one is going to lead to a solid return.
Targets into 2029
$60.00 (+35.6%)
$73.00 (+64.9%)
Semiconductors

[LOI] - SK Hynix - SK Hynix
Key Points :
Bullish Outlook on SK Hynix : The company dominates the high-bandwidth memory (HBM) market with over 50% share, driven by AI demand from clients like NVIDIA. Record 2025 profits suggest continued growth in 2026, with analysts forecasting undervaluation and potential 20-50% stock upside amid a memory supercycle.
CHIPS Act Benefits : SK Hynix secured up to $458M in direct grants and $500M in loans, plus 25% tax credits, supporting its $3.87B Indiana investment. This funding accelerates U.S.-based AI chip packaging, enhancing domestic supply chains.
On-Shoring Advantages : The West Lafayette facility marks SK Hynix's first U.S. advanced packaging plant, creating 1,000 jobs and reducing reliance on Asian production. It aligns with U.S. efforts to bolster national security and AI leadership.
Company Overview :
SK Hynix Inc. (KRX: 000660), a top-tier South Korean semiconductor firm, focuses on DRAM, NAND flash, and HBM chips essential for AI, data centers, and consumer devices. As of January 2026, it holds about 33% global DRAM market share and 21% in NAND, with a market cap around $383B and stock at ~$554. Recent developments include launching a U.S.-based "AI Company" in February 2026, showcasing 16-layer HBM4 at CES, and investing $13B in a new South Korean packaging plant.
Notes on how I personally use my charts/NFA:
Each level L1-L3 and TP1-TP3 (Or S1-S3) has a deployment percentage. The idea is to flag these levels so I can buy 11% at L1 , 28% at L2 and if L3 deploy 61% of assigned dry powder. The same in reverse goes for TP. TP1: 61%, TP2:28% and TP3:11%. If chart pivots between TP's, in-between or in Between Sell levels these percentages are still respected. I like to use the trading range to accumulate by using this tactic.
Just my personal way of using this. This is not intended or made to constitute any financial advice.
This is not intended or made to constitute any financial advice.
NOT INVESTMENT ADVICE
I am not a financial advisor.
The Content in this TradingView Idea is for informational purposes only, you should not construe any such information or other material as legal, tax, investment, financial, or other advice. Nothing contained within this idea constitutes a solicitation, recommendation, endorsement, or offer to buy or sell any securities or other financial instruments in this or in in any other jurisdiction in which such solicitation or offer would be unlawful under the securities laws of such jurisdiction.
All Content on this idea post is information of a general nature and does not address the circumstances of any particular individual or entity. Nothing in the idea/post constitutes professional and/or financial advice, nor does any information on the idea/post constitute a comprehensive or complete statement of the matters discussed or the law relating thereto. You alone assume the sole responsibility of evaluating the merits and risks associated with the use of any information or other Content on the idea/post before making any decisions based on such information.
Sir. Galahad - QUANT
Disclaimer
The information and publications are not meant to be, and do not constitute, financial, investment, trading, or other types of advice or recommendations supplied or endorsed by.

[LOI] - WolfSpeed - WolfSpeed Inc.
Key Points:
Bullish Outlook on Wolfspeed : Research suggests Wolfspeed is well-positioned for growth in silicon carbide (SiC) demand, driven by EVs, AI data centers, and renewables, with potential margin expansion as new fabs ramp up. However, financial risks like debt and dilution temper absolute confidence.
CHIPS Act Benefits : Wolfspeed has secured significant support, including nearly $700M in tax refunds received and up to $750M in grants, enabling U.S. expansions that enhance domestic supply chains.
On-Shoring Advantages : U.S. semiconductor reshoring efforts align with Wolfspeed's investments in North Carolina and New York facilities, potentially bolstering national security and economic resilience amid global competition.
Key bearish insiders :
- November 14, 2025: Soros Fund Management added new put positions in NYSE:WOLF , part of a portfolio update including other hedges like NASDAQ:SMH puts.
Notes on how I personally use my charts/NFA:
Each level L1-L3 and TP1-TP3 (Or S1-S3) has a deployment percentage. The idea is to flag these levels so I can buy 11% at L1 , 28% at L2 and if L3 deploy 61% of assigned dry powder. The same in reverse goes for TP. TP1: 61%, TP2:28% and TP3:11%. If chart pivots between TP's, in-between or in Between Sell levels these percentages are still respected. I like to use the trading range to accumulate by using this tactic.
Just my personal way of using this. This is not intended or made to constitute any financial advice.
This is not intended or made to constitute any financial advice.
NOT INVESTMENT ADVICE
I am not a financial advisor.
The Content in this TradingView Idea is for informational purposes only, you should not construe any such information or other material as legal, tax, investment, financial, or other advice. Nothing contained within this idea constitutes a solicitation, recommendation, endorsement, or offer to buy or sell any securities or other financial instruments in this or in in any other jurisdiction in which such solicitation or offer would be unlawful under the securities laws of such jurisdiction.
All Content on this idea post is information of a general nature and does not address the circumstances of any particular individual or entity. Nothing in the idea/post constitutes professional and/or financial advice, nor does any information on the idea/post constitute a comprehensive or complete statement of the matters discussed or the law relating thereto. You alone assume the sole responsibility of evaluating the merits and risks associated with the use of any information or other Content on the idea/post before making any decisions based on such information.
Sir. Galahad - QUANT
Disclaimer
The information and publications are not meant to be, and do not constitute, financial, investment, trading, or other types of advice or recommendations supplied or endorsed by.

Ultra Clean Holdings | UCTT | Long at $27.32Like Ichor Holdings NASDAQ:ICHR , Ultra Clean Holdings NASDAQ:UCTT is a prominent developer and supplier of critical subsystems, high-purity components, and specialized services, primarily for the semiconductor industry. I believe this is a very undervalued area in the semiconductor industry.
Growth
Earnings per share expected to more than triple between 2025 and 2028 and revenue is expected to be on the rise.
Health
Debt-to-equity: 0.9x (healthy)
Quick Ratio: 1.9 (great)
Altman's Z Score: 2.7 (good)
Action
Unless the semiconductor market implodes (or the company), the future looks bright for NASDAQ:UCTT in the next 2-3 years. It may dip into the low $20's in the near-term to close a few price gaps, but with a float of 44 million, it may get interesting at some point soon. Thus, at $27.32, NASDAQ:UCTT is in a personal buy zone.
Targets into 2029
$35.00 (+64.7%)
$60.00 (+119.6%)

Ichor Holdings | ICHR | Long at $20.41Ichor Holdings NASDAQ:ICHR is a major supplier in the semiconductor industry, specifically focused on the semiconductor capital equipment sector rather than directly manufacturing chips themselves. I believe this is a very undervalued area in the semiconductor industry. The other major competitor is Ultra Clean Technologies NASDAQ:UCTT .
Insiders
Buying between $14 and $17 share.
Growth
Earnings per share expected to more than double between 2026 and 2028 and revenue on the rise.
Health
Debt-to-equity: 0.2x (healthy)
Quick Ratio: 1.3 (good)
Altman's Z Score: 2.8 (good)
Action
Unless the semiconductor market implodes (or the company), the future looks bright for NASDAQ:ICHR in the next 2-3 years. With a float of 32 million, it may get interesting at some point soon. Thus, at $20.41, NASDAQ:ICHR is in a personal buy zone.
Targets into 2029
$32.00 (+56.8%)
$42.00 (+105.8%)

INTC Intel Corporation Options Ahead of EarningsIf you haven`t bought the dip on INTC:
Now analyzing the options chain and the chart patterns of INTC Intel Corporation prior to the earnings report this week,
I would consider purchasing the 48usd strike price Calls with
an expiration date of 2026-3-20,
for a premium of approximately $2.75.
If these options prove to be profitable prior to the earnings release, I would sell at least half of them.
AMD: entering mid-term resistance levelNASDAQ:AMD price followed through from the support zone into the important mid-term resistance outlined in the October updates.
One of the strongest structures and setups on the market. And while there’s still potential for a move into the higher resistance area at 260–277, I expect selling pressure to start building over the next few weeks, leading to a pullback and potential consolidation phase.
Breaking out above 277 will force me to reconsider the trend suggested trend structure.
Chart:
Previously:
• On resistance zone (Oct 13):
• Upside potential (Oct 7):
see in weekly review
Previously this year:
• On macro resistance (Jul 29):
• On resistance & bounce potential (Aug 6):
• On macro bottoming potential (Apr 25):

MPWR: The High-Conviction AI Power PlayMonolithic Power Systems (MPWR) is now a critical lynchpin in the global AI infrastructure race. Market expectations have shifted upward, with revised price targets significantly exceeding previous levels. Investors must look beyond the headline numbers to understand the deep structural advantages driving this valuation.
Industry Trends and Technology
Artificial Intelligence runs on power as data centers scale to support next-generation GPU and XPU platforms, and energy consumption skyrockets. Experts identify MPWR as a compelling AI infrastructure bet for this exact reason. The company dominates high-density power delivery. Their integrated circuits (ICs) solve the twin challenges of energy efficiency and heat dissipation. In the high-stakes world of AI training, thermal management is not just a feature; it is a physics-defined necessity.
Business Models and Innovation
MPWR differentiates itself through relentless specialization. Unlike broad-market chipmakers, they focus exclusively on high-performance power solutions. This "sniper" approach allows them to capture high-margin segments in computing, automotive, and industrial markets. Their business model relies on solving complex engineering problems that competitors avoid. This culture of engineering excellence creates a formidable moat. By reducing total energy consumption, they provide direct cost savings to hyperscalers, making their products indispensable.
Geopolitics and Geostrategy
AI dominance is the new nuclear arms race. Nations and corporations compete desperately for computational supremacy. This geopolitical friction drives demand for the most efficient hardware available. MPWR sits at a strategic choke point in this supply chain. Without advanced power management, the world’s fastest chips cannot operate at peak performance. Consequently, MPWR’s technology becomes a strategic asset, insulating it somewhat from standard consumer cycle fluctuations.
Macroeconomics and Economics
The macroeconomic environment remains uncertain, yet AI spending shows resilience. Corporations prioritize AI investment to drive future productivity, ignoring short-term headwinds. This divergence creates a multibillion-dollar potential for MPWR. While other sectors contract, the data center power market expands. This economic decoupling allows MPWR to outperform broader indices. Smart capital flows toward infrastructure plays that underpin the entire digital economy.
Patent Analysis and Science
MPWR’s dominance rests on hard science and intellectual property. Their patent portfolio covers novel methods for reducing heat dissipation in integrated circuits. This is not merely design; it is material science innovation. Protecting these advancements prevents commoditization. Competitors struggle to replicate MPWR’s efficiency metrics without infringing on their IP. This legal and technical barrier secures their market share against cheaper, generic alternatives.
Conclusion
Monolithic Power Systems represents more than a chip stock. It is a foundational infrastructure play for the AI era. Management executes a clear vision, leveraging technical superiority to command pricing power. For investors seeking high-conviction exposure to the AI boom without picking a single software winner, MPWR offers a compelling solution.

NVTS: Uptrend from April lows may be complete Putting my late‑October NVTS update into a separate idea.
From the way the corrective structure off the October highs is developing, it increasingly looks like the entire advance from the April lows may be complete, with price likely having formed a mid‑term top. The ideal macro support zone to complete this full corrective cycle sits at 5.20–3.90.
In the near term, a move into the 6.97–5.70 area has a high probability of generating a bounce, but that bounce would most likely only create a larger‑degree lower high before the final leg down into macro support finishes the correction.
Chart:
Previously:
For my prior structure analysis from Aug–Oct, see the previous idea:

LRCX mid-term TALam Research is in bullish mode, the volumes accumulation and the trend strength are strictly bullish. It's getting a little bit overextended on daily with a possible short-term pullback but the long-term uptrend remains intact.

TSM mid-term TATaiwan Semiconductor is in strict bullish mode on daily and weekly frame as well, currently there's no significant change in trend direction, the volumes and trend strength are strictly bullish.

Direxion Semiconductor 3x Bull | SOXL | Long at $30.00So many semiconductor companies... which one to choose? Enter AMEX:SOXL - not for the faint of heart. Losses and gains triple compared to most semiconductor ETFs, so stay away if high-risk plays aren't your thing. The top three holdings are NASDAQ:AMD , NASDAQ:AVGO , and NASDAQ:NVDA - two of which are at all-time highs...
I wouldn't be shocked if AMEX:SOXL enters the low $20's to test the base of my historical simple moving average area, but I don't think we are done hearing about AI and the semi demand. There are large gaps to fill above and below the current price and we are at the 50/50 stage (i.e. historical simple moving average zone) for a price move up or down.
My bet is up, especially with the new presidential administration. If politicians start dumping semis, I'm out. Thus, at $30.00 AMEX:SOXL is in a personal buy zone.
Target #1 = $35
Target #2 = $40
Target #3 = $50
Target #4 = $60

ASE Technology (ASX) — Advanced Packaging Tailwind from AI & HPCCompany Overview
ASE Technology NYSE:ASX is a global leader in semiconductor packaging & testing, leveraged to rising chip complexity and outsourcing across AI, HPC, automotive, and communications.
Key Catalysts
Revenue Momentum: Nov ’25 sales +15.5% YoY (~$1.9B) on accelerating demand for AI-related assembly and advanced test.
LEAP Platform: LEAP advanced packaging is a growing mix & margin driver as heterogeneous integration (chiplets, 2.5D/3D) becomes essential for next-gen AI silicon.
Scale Advantage: Broad customer base + leading OSAT scale support capacity, yield, and time-to-market advantages versus smaller peers.
Auto/Comms Upside: Content-per-vehicle and RF/optical upgrades add durable, non-AI legs to growth.
Investment Outlook
Bullish above: $13.50–$14.00
Target: $20.00–$21.00 — supported by AI/HPC packaging demand, LEAP margin expansion, and continued test outsourcing.
#ASX #Semiconductors #AdvancedPackaging #AI #HPC #Chiplets

Can Gold's Transformation Justify a $7,000 Price Target?The global gold market is experiencing a fundamental paradigm shift as the metal transitions from a passive portfolio hedge to a strategic necessity across multiple domains. With U.S. national debt exceeding $38 trillion and a debt-to-GDP ratio above 124%, the report argues that sovereign debt debasement has become mathematically inevitable, forcing central banks into implicit yield curve control and perpetual currency dilution. Simultaneously, geopolitical fractures exemplified by the January 2026 capture of Venezuelan President Maduro and escalating Arctic tensions over Greenland are driving nations to diversify away from their reliance on weaponized dollar reserves. The BRICS alliance's launch of a 40% gold-backed "Unit" currency in October 2025, combined with record central bank purchases of 220 tonnes in Q3 2025 alone, signals a coordinated global effort to remonetize gold as the ultimate neutral reserve asset.
Beyond monetary dynamics, gold is becoming indispensable to the technological infrastructure of the future. The AI revolution creates inelastic industrial demand, with gold-tin solder and gold wire bonding proving essential for thermal management in high-performance chips, such as NVIDIA's B200 GPU and High-Bandwidth Memory (HBM3E) systems. This "AI tax" on gold supply permanently removes metal from circulation as it becomes embedded in data centers and semiconductor packages. Basel III regulatory reforms have further catalyzed demand by elevating allocated physical gold to Tier 1 asset status, incentivizing banks to swap paper assets for physical metal, and exposing the leverage in the paper gold market. Additionally, emerging applications in quantum computing, nanomedicine, and space infrastructure, including China's planned deployment of 200,000+ satellites for 6G networks, create entirely new sources of consumption.
The convergence of these structural forces creates what the report calls a "supply squeeze" amid declining ore grades, rising production costs, and potential export restrictions by major producers. With global debt approaching $346 trillion and cyber warfare risks underscoring gold's unique status as an "analog hedge" immune to digital manipulation, the report projects $7,000 per ounce not as speculation but as a rational repricing of a strategic asset facing unprecedented convergent demand. The thesis holds that gold has evolved from a "nice-to-have" portfolio diversifier into a "must-have" strategic material for central banks seeking neutrality, technology companies requiring conductivity, and investors needing protection against systemic collapse. The authors conclude that supply constraints can be resolved only through price adjustment, making the path to $7,000 "paved with necessity."

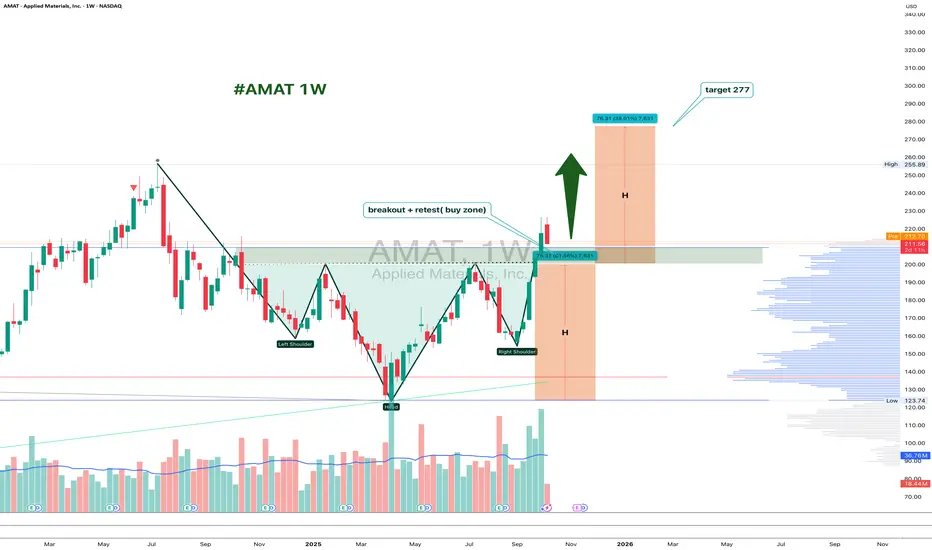
AMAT 1W: Retesting the Neckline Before the Next Move?On the weekly chart, Applied Materials (AMAT) has completed a clean inverted head and shoulders breakout around $226, and is now pulling back to retest the neckline zone near $200–211.
This area acts as strong support. If buyers defend it, the bullish pattern stays valid, with a projected target around $277, matching the 1.618 Fibonacci extension.
From a fundamental perspective, AMAT remains a key semiconductor player, benefiting from ongoing demand for chip-making equipment. The pullback looks more like a healthy pause than weakness - a classic chance for latecomers to re-enter.
Funny enough, the “head and shoulders” pattern, known for signaling tops, is doing the exact opposite here - apparently, even the market likes a good plot twist.
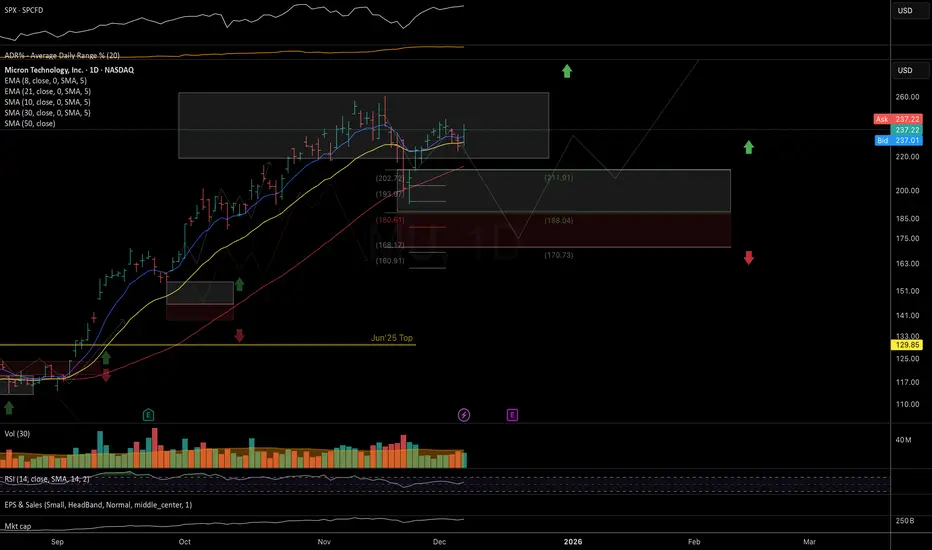
MU: one more leg down potential I would prefer to see one more leg down into the deeper mid-term support zone at 180–170, as long as price remains below the December highs.
Chart:
Previous analysis on NASDAQ:MU trend structure (Jul-Oct):
Can Oxygen Absorption Forge a Wireless Revolution?Peraso Inc. (NASDAQ: PRSO) operates at the intersection of geopolitics, physics, and semiconductor innovation in the 60GHz millimeter-wave spectrum. As Western governments dismantle Chinese telecommunications infrastructure through "Rip and Replace" initiatives, Peraso emerges as a strategic beneficiary—offering North American-designed silicon fabricated through TSMC that meets "Clean Network" standards. The company's technology leverages a peculiar quirk of atmospheric physics: oxygen molecules absorb 60GHz signals within 1-2 kilometers, creating both a limitation and a strategic advantage. This phenomenon enables spatial isolation for frequency reuse and inherent physical-layer security, positioning Peraso's solutions as ideal for dense urban wireless networks, military tactical communications, and next-generation VR/AR devices requiring multi-gigabit wireless bandwidth.
The company's leadership, veterans of the Intellon-to-Atheros-to-Qualcomm acquisition chain, brings proven expertise in standardizing emerging connectivity technologies. Peraso holds nine Standard Essential Patents for IEEE 802.11ay (WiGig), creating licensing leverage across any manufacturer building compliant high-speed wireless devices. Despite Q3 2025 revenue reaching $3.2 million (up 45% sequentially) and expanding gross margins by 56%, the stock remains deeply undervalued, as evidenced by Mobix Labs' hostile $1.30/share takeover attempt, which represents a 53% premium. The company has successfully transitioned from its legacy MoSys memory business to become a pure-play 60GHz specialist, securing design wins in defense applications and partnerships with major fixed wireless access providers.
Peraso's investment thesis is based on three pillars: geopolitical tailwinds that are forcing Western infrastructure operators toward trusted suppliers, the irreplaceable physics of 60GHz in solving spectrum congestion, and a patent portfolio that positions the company as either a future licensing powerhouse or an attractive acquisition target. The primary risks include aggressive cash burn requiring frequent dilution, execution challenges in reaching fragmented WISP customers, and the inherent volatility of micro-cap semiconductor stocks. For investors seeking asymmetric exposure to the "Wireless Fiber" revolution, where capital-efficient mmWave bridges replace expensive fiber deployments, Peraso represents a contrarian deep-tech opportunity in an overlooked corner of the connectivity market.

Mobileye 2026: Reclaiming the ADAS Throne with EyeQ6HMobileye (MBLY) kicked off 2026 with a decisive victory, securing a massive production deal with a top-10 U.S. automaker. This agreement integrates Mobileye’s "Surround ADAS" into millions of vehicles as standard equipment. The market responded immediately, sending shares up 7% in early January trading. This win signals a strategic pivot for the industry, prioritizing scalable safety over elusive fully autonomous dreams.
Geostrategy: Balancing the US-China Tech Divide
Global regulatory pressures are accelerating the adoption of Advanced Driver Assistance Systems (ADAS). Europe’s latest mandates for automatic braking and driver monitoring have forced automakers to seek rapid, reliable solutions. While Chinese OEMs lead in urban "Navigation on Autopilot," Western manufacturers are now fighting back. By securing a major U.S. player, Mobileye reinforces its position as the preferred partner for "Eyes-on, Hands-off" highway technology across North America and Europe.
Technology: The Efficiency of Heterogeneous Computing
The EyeQ6H chip is the crown jewel of this new partnership. Unlike competitors who focus solely on raw "TOPS" (Tera Operations Per Second), Mobileye emphasizes power efficiency and hardware-software co-design. The EyeQ6H utilizes a specialized architecture, including Vector Microcode Processors (VMP) and Deep Learning Accelerators (XNN). This design allows a single chip to process data from up to 11 sensors, enabling highway speeds of 81 mph (130 kph) with minimal power draw.
Business Model: ECU Consolidation and Cost Leadership
Automakers are currently struggling with the rising complexity of vehicle electronics. Mobileye’s "Surround ADAS" offers a way to simplify this architecture. By consolidating multiple driving and safety functions onto a single Electronic Control Unit (ECU), manufacturers can significantly reduce production costs. This business model appeals directly to mass-market brands needing to offer premium features without premium price tags. The current deal targets 9 million units, proving that Mobileye’s "democratization of safety" is finally scaling.
Macroeconomics: Navigating the Post-Shutdown Recovery
The 43-day U.S. government shutdown in late 2025 created a vacuum in regulatory approvals and economic data. As federal agencies resume operations, the automotive sector is bracing for a wave of new safety certifications. Mobileye’s proven track record—with over 200 million vehicles already using its technology—gives it an edge in this "bottleneck" environment. Investors view this new contract as a high-visibility revenue bridge that offsets previous concerns about slower robotaxi deployments.
Innovation and Patent Moats: The REM Advantage
Mobileye’s true competitive moat lies in its Road Experience Management (REM) data. Over 8 million vehicles currently harvest anonymized, crowdsourced mapping data globally. This patented approach allows Mobileye-equipped cars to "see" the road with centimeter-level precision without expensive LiDAR. This scientific advantage in localization and mapping makes their systems easier to deploy at scale than "vision-only" or "LiDAR-heavy" alternatives.

MICRON scripted blue-print. More than -50% sell-off expected.Micron Technology (MU) is on an amazing long-term rally since the April 2025 Low, currently on the 6th straight green month (1M candle) and 8th in the last 9 months. Its historic price action however shows that this remarkable uptrend may be coming to an end as the price is approaching the top of its 17-year Channel Up (started after the 2008 U.S. Housing Crisis).
Technically, this post April 2025 rally, is the Bullish Leg of this Channel Up and it already broke above the 0.786 Channel Fibonacci, a level that has only broken 3 times in total, with the last being in June 2018.
At the same time, it is close to completing a +601.35% rise, which despite being unusually high, Micron has done such rally 3 times in the past. The remarkable feat is that all those rallies where exactly +601.35%!
Last but not least, the 1M RSI is massively overbought and is approaching Resistance 2 (89.00), which was last seen on the June 2014 High.
All those factors collectively, force a huge bearish dynamic long-term. At best, we may see this rally exhaust near $440 on the short-term, thus fulfilling the +601.35% Bullish Leg blue-print but on the long-term the value of selling give much higher return.
And as far as a potential Target for this upcoming Bear Cycle is concerned, the 0.236 Channel Fibonacci level is the strongest candidate as virtually all major corrections since 2011 have hit that trend-line before the market bottomed. As this chart shows, the 0.236 Fib level has been touched 6 times since 2011, with the market hitting at least its 1M MA50 (blue trend-line) in the process on a minimum -50% decline. The 1M MA100 (green trend-line) has been its true long-term Support since July 2016.
As a result, it is highly probable that Micron drops below the 1M MA50 and hits the 0.236 Fib at around $140 before the market bottoms and turns into a long-term Buy again. At the same time, it is useful to keep an eye on the 1M RSI and Support Zone 1. This has given the last 3 major Buy Signals since December 2018. As a result, if the stock hits that level before reaching $140, we will turn into long-term buyers regardless of the price.
---
** Please LIKE 👍, FOLLOW ✅, SHARE 🙌 and COMMENT ✍ if you enjoy this idea! Also share your ideas and charts in the comments section below! This is best way to keep it relevant, support us, keep the content here free and allow the idea to reach as many people as possible. **
---
💸💸💸💸💸💸
👇 👇 👇 👇 👇 👇

Can Mobileye Turn a 19M-Unit Win Into Market Dominance?Mobileye Global Inc. has secured a transformative 19-million-unit pipeline through two major deals: 9 million EyeQ6H chips for a top-10 US automaker's next-generation ADAS and a previous Volkswagen commitment. This achievement comes during a challenging period marked by a 50% stock decline in 2025, yet it signals a fundamental shift in the company's business model. The transition from selling basic safety chips at $40–$50 per unit to offering a comprehensive "Surround ADAS" platform at $150–$200 per vehicle represents a tripling of revenue potential, establishing Mobileye as a software-centric platform provider rather than merely a component supplier.
The technical foundation of this strategy rests on the EyeQ6H chip, a 7nm processor capable of handling data from 11 sensors, while deliberately excluding the more expensive LiDAR technology. This cost-conscious design enables hands-free highway driving up to 130 km/h for mass-market vehicles, consolidating multiple functions into a single ECU and simplifying automaker production. The company's proprietary Road Experience Management (REM™) technology, which crowdsources data from millions of vehicles to create high-definition maps, provides a substantial intellectual property moat against competitors like Tesla and Nvidia. Over-the-air update capabilities ensure the platform remains current throughout a vehicle's lifecycle.
However, Mobileye faces significant headwinds that temper investor enthusiasm. With 3,000 of 4,300 employees based in Israel, geopolitical uncertainty affects valuation and operations, prompting a recent 5% workforce reduction of 200 employees. Competition from Chinese rivals like Huawei and Xpeng, who are developing in-house solutions, represents an existential threat to market share. The company characterizes 2025 as a "transition year" plagued by inventory challenges, but the massive order pipeline and improved revenue model position 2026 as potentially pivotal. Success hinges on flawless execution of product launches and the ability to maintain technological leadership while navigating both geopolitical tensions and intensifying competition in the autonomous driving space.

AVGO next moveWhite fib from 2024 hit all targets,Yellow fib for 2025.
Green box is an accumulation once exceeds 2024 last target 335 i see a distribution under 414 which is 3rd target for 2025 and form a disjoint channel
Also i see a strong selling area 360-370 last friday was a rejection.
MACD went to the negative zone could lead to area 309-240.
If selling area keep controlled by bears then can't hold for longer.
it's healthy for next target area 518-583


BABA trade ideaI think entry area between 125-140 if falling wedge broken, its strong support there with 200ma and MACD, PT +200.
