FacebookI have this going to the 290's. I like the Financials. Charts looks nice. Check Multiple Time Frames. I used the Daily, 4 Hour, and 1 Hour. I confirmed on the 5 or 15min. Check for yourself.
What do you think?
Setups

The Ski Mask is on......AlbamarleI see a quick drop in price before the continuation of a tested resistance. I really like this company as they are the largest company within the lithium industry which will be in high demand for the auto industry. Going through a covid phase. They should be ok as the financials are still in ok enough shape to me for growth and long term value. I think price bounces off of $160.38 and shooting up towards resistance and above down the line.
What do you think?

The Ski Mask is on......BLNKI like blink charging for a long term hold. Obviously we are headed into the EV age and I like how this company no only participates in making vehicles, but also dealing with charging stations was a big plus for me. I like the commercial value of this company down the line. Price is in a support zone look for it to test resistance since mac d and rsi are on the bottom side meaning that price could be oversold.
What do you think?

The Ski Mask is on......ViciThis is a nice covid play for me. Financials look good. Reputable REIT. Fresh. Entertainment based. I like it for growth.

Stocks To Watch This WeekThe Bull Market is strong. This week I tried to pick the absolute best names that present exceptional reward/risk. Some of these charts still need to confirm their price action. This video is my watchlist. Most of these names are at or near all time highs or multi year highs. There are 13 total stocks on this list. I add an additional 6 stocks that are on my potential short squeeze watch list. Many of these have IPO'd in the last few years and still have a growth story ahead of them. Know your time frame and risk tolerance. Know your earnings dates! I go through these quickly so grab a pencil and paper and jot down the names that look interesting to you and then make the trade your own. Good Luck!

AUDCAD BuyHello traders, here is my analysis on AUD/CAD on the 15 minute time frame. I labeled all the LL and LH. I want to see price retrace from the imbalance candle once again then rise up. ***trade at your own risk***

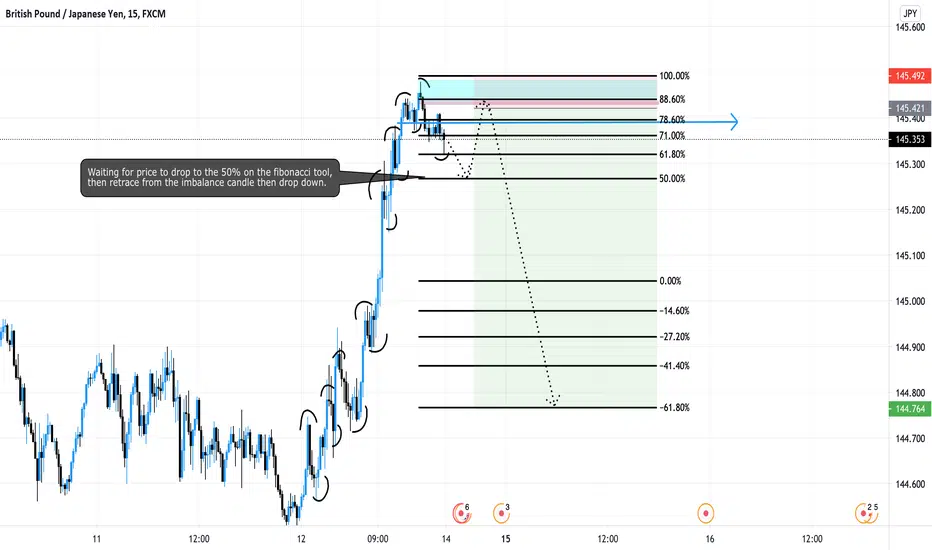
GBPJPY SellHello traders and welcome to my analysis on GBPJPY. There is a clear break of structure so I am currently waiting for price to fall to the 50 % on the fib tool and then see price rise up and retrace from the imbalance candle and then see price fall.
***trade at your own risk***
T.Rowe Price Bullish -Ski MaskTarget Price: $168.00 and up.
Technical Analysis: I expect price to retrace the previous low (green, bottom of mac d: $160.23-$154.56). Once this price retraces, price should test what would be the current high and above (orange on top of macd: $165-$168 and above.) The stochastic rsi is on the bottom of the box which means price is over sold. However, I need it to match up to the mac d before going to a lower time frame for entry.
Fundamental Analysis: Price to earnings ratio is under 20-25. Which I heard means there is room for reasonable growth. Net Margin % is increasing. Impressive History.
Let me know what you think?
Follow, Like, Agree, Disagree!
Look, I'm just an average guy that needs this market to change his life. Keep in tune and let's help each other grow and learn!
"A Bad Idea may lead you in the wrong direction. No Idea leads you nowhere. A Good Idea is a reflection of the Bad Idea."


USDCAD BuyHello traders, this is my analysis on USDCAD
on the 2 hour time frame.
There is a clear break of structure. I want to
see price rise up once it retraces from the
imbalance candle. ***please trade at your own risk***

Please ClickHello traders, this is my analysis on USDJPY. Looking at the four hour timeframe I can see if there is a clear break of structure. I want to see price rise up to the imbalance candle and then drop down. Please trade at your own risk. If you agree with my analysis please give this chart a thumbs up and give me a follow for future post.

Waiting for a good confirmation to go short. Clear break of structure on the 30 minute time frame. Going short...

waiting for price to break structure CURRENTLY WAITING FOR PRICE TO FALL DOWN TO
KEY LEVEL PRICE 0.86990 AND THEN MOVE UPWARDS TO BREAK
STRUCTURE AND DROP TO RETRACE THEN MOVING UPWARDS...

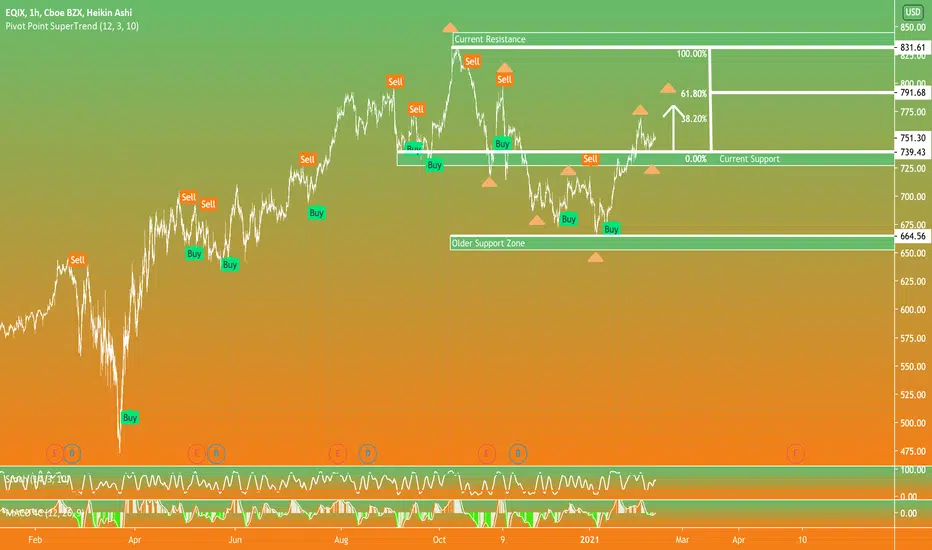
Equinix Call?Strike Price: $791.68
Price seems to be bouncing off of a support zone....I have it retracing the previous high at least 61.80% or more. hopefully it breaks past the new resistance.
Let me know what you think!
Like, Follow, Agree, Disagree!
Public Storage Put?Price is currently testing a resistance zone. Looking for a retracement of previous low up to 61% of fibonnaci. On the 4 hour I see a W pattern that is finishing up hopefully which would trigger a pullback.
Strike Price: $230.34
What do you think?
Like, Follow, Agree, Disagree!

Prologis Call?Potential W pattern forming. Price is in support zone. Resistance is there to be retraced! Financials look ok but not great. Price rejects the $107.53 support zone twice... will watch at market open.
Let me know what you think!
Like, Follow, Agree, Disagree?
Strike Price: $108.36 and beyond.

Brookfield Asset Management Put?Financials haven't been so great. Some consolidation going on. Price is currently at a resistance zone. Looking for a retracement of the previous low before it may continue up....IF IT DOES. Used pivot points (orange triangles) to show pattern and relationship from resistance to support.
Let me know what you think
Like, Agree, Disagree, Follow!
Strike Price: $39.27

Bitcoin Hype is real!We all know bitcoin will continue the upwards trend....after this dip. Hopefully it reject the current support zone and moves upward. I personally have it surpassing 50's.....but to be humble about it.
Strike price: $45700 and beyond.
Lmk what you think!
Like, Follow, Agree, Disagree!
-Amateur Robinhood Trader lol

MJ...no not Michael Jordan! Call!Sorry, in class and can't give full analysis. Everyone likes weed. COVID sucks, and I just saved a bunch of money on my car insurance by switching to geico....
Strike Price: $33.40
Price should test the new resistance zone. Which was an all time high a few years ago. We see where the world is today...I think it'll surpass the resistance. Unfortunately, my contract expired 2/19....
lmk what you think?
like, follow, agree, disagree?
-Amatuer Robinhood Trader

bitcoin BTC long and short Intraday levels and triggersIf L3/P bounces. Long with target of H3 and higher and stop loss at L4
If L4 is lost. short with target of L5 and stop loss at L3

The Ski Mask is on......TwitterKind of tired tonight. Sorry for the lazy analysis but the deed has to be done for the sake of humanity. Twitter is OP. Struck a new resistance and hoping for it to reach a new world full of consolidations and breakouts to the upside!
Strike Price: $60-$64
Like, Follow, Agree, Disagree!
-The Ski'd Mask

EOS long+short intraday setupsLose H3 to trigger short. (target L3/pivot SL H4)
Break H4 to trigger long. (target H5+H6 SL H3)

XAG silver. long+short intraday setupsBreak H4 to trigger long. Lose H3 to trigger short. It should be said I favor the long on more macro targets and timeframe
