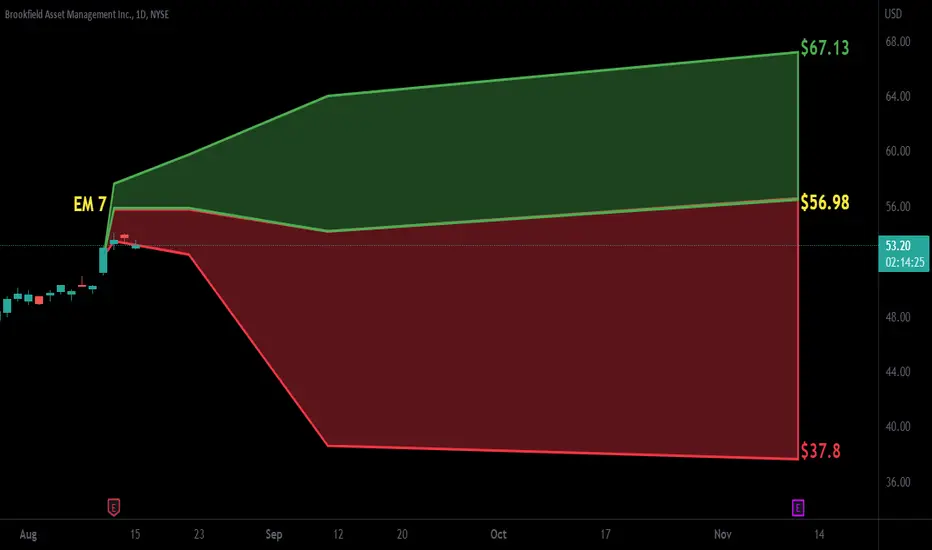
$BAM with a Bullish outlook following its earnings #Stocks The PEAD projected a Bullish outlook for $BAM after a Positive Under reaction following its earnings release placing the stock in drift C with an expected accuracy of 50%.
Next report date
—
Report period
—
EPS estimate
—
Revenue estimate
—
4.67USD
1.87 BUSD
4.14 BUSD
347.16 M
About Brookfield Asset Management Inc
Sector
Industry
CEO
James Bruce Flatt
Website
Headquarters
Toronto
Founded
2022
FIGI
BBG01BPHNXZ3
Brookfield Asset Management Ltd. provides alternative asset management services across renewable power and transition, infrastructure, private equity, real estate, and credit industry. It invests client capital for the long term with a focus on real assets and essential service businesses. The company was founded on July 4, 2022, and is headquartered in Vancouver, Canada.
Brookfield must have run out of assets. BAMGoals 200, 179. Invalidation at 262 .
We are not in the business of getting every prediction right, no one ever does and that is not the aim of the game. The Fibonacci targets are highlighted in purple with invalidation in red. Fibonacci goals, it is prudent to suggest, are nothing more than mere f

$BAM with a Bullish outlook following its earnings #Stocks The PEAD projected a Bullish outlook for $BAM after a Negative over reaction following its earnings release placing the stock in drift C with an expected accuracy of 66.67%.

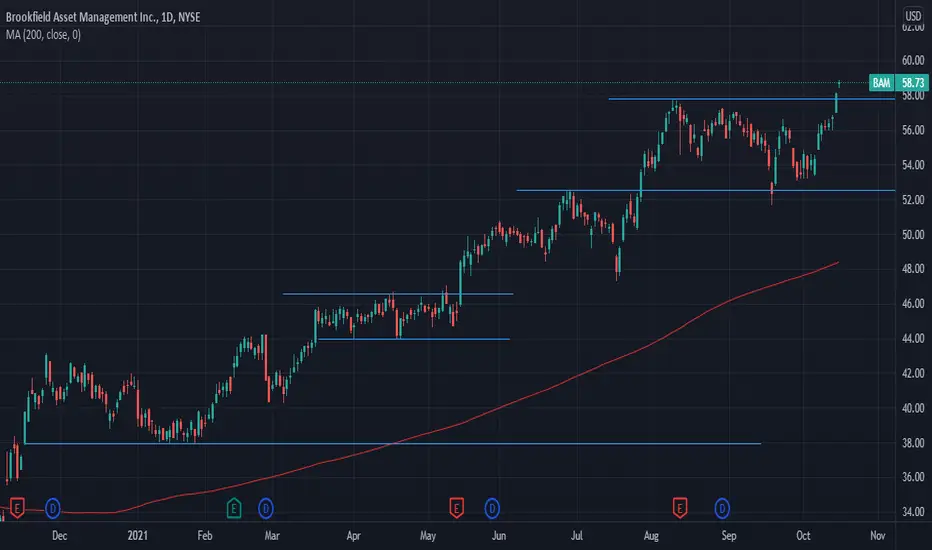
BAM - GIANT Rising WedgeA giant rising wedge can be observed on BAM
This is the weekly timeframe and completion of the wedge is evident
Normally Rising Wedges act bearishly but one of this magnitude hodls bullish potential, which is also evident with the breakout
A support retest of the upper trend line and then further u

$BAM with a Bullish outlook following its earnings #Stocks The PEAD projected a Bullish outlook for $BAM after a Positive over reaction following its earnings release placing the stock in drift B with an expected accuracy of 75%.

$BAM with a Bullish outlook following its earnings #Stocks The PEAD projected a Bullish outlook for $BAM after a Positive over reaction following its earnings release placing the stock in drift B with an expected accuracy of 66.67%.
If you would like to see the Drift for another stock please message us. Also click on the Like Button if this was useful a

BAM Breaking out againBAM made another breakout
Price is in solid uptrend
Nothing much to do other than riding the wave
Pays out dividends
BAM; a solid asset management company! (Request by Ralph_Prime) 1st off, this is an asset management company. I think it calls for more fundamental analysis than technical analysis when it comes to such companies.
Nonetheless, the consistent uptrend since inception is phenomenal! I will never short this company.
From technical analysis point of view, look at h

Brookfield Asset Management Put?Financials haven't been so great. Some consolidation going on. Price is currently at a resistance zone. Looking for a retracement of the previous low before it may continue up....IF IT DOES. Used pivot points (orange triangles) to show pattern and relationship from resistance to support.
Let me kno

BAM vs SPX 5 yearsThis compares BAM's performance with SPX.
At its peak, you see BAM was up about 160% vs SPX at 79%
Also there are signs of BAM moving independently of SPX. Lacks correlation. We need to find what is the correlation between the two.

See all ideas
Trade directly on the supercharts through our supported, fully-verified and user-reviewed brokers.


Frequently Asked Questions
The current price of BAM is 39.60 USD — it has increased by 1.20% in the past 24 hours. Watch Brookfield Asset Management Inc stock price performance more closely on the chart.
Depending on the exchange, the stock ticker may vary. For instance, on NYSE exchange Brookfield Asset Management Inc stocks are traded under the ticker BAM.
Brookfield Asset Management Inc is going to release the next earnings report on May 8, 2024. Keep track of upcoming events with our Earnings Calendar.
BAM stock is 1.73% volatile and has beta coefficient of 1.48. Track Brookfield Asset Management Inc stock price on the chart and check out the list of the most volatile stocks — is Brookfield Asset Management Inc there?
BAM earnings for the last quarter are 0.37 USD per share, whereas the estimation was 0.34 USD resulting in a 7.18% surprise. The estimated earnings for the next quarter are 0.34 USD per share. See more details about Brookfield Asset Management Inc earnings.
Brookfield Asset Management Inc revenue for the last quarter amounts to 1.15 B USD despite the estimated figure of 1.15 B USD. In the next quarter revenue is expected to reach 1.13 B USD.
Yes, you can track Brookfield Asset Management Inc financials in yearly and quarterly reports right on TradingView.
BAM stock has fallen by 0.93% compared to the previous week, the month change is a 2.94% fall, over the last year Brookfield Asset Management Inc has showed a 25.52% increase.
BAM net income for the last quarter is 384.34 M USD, while the quarter before that showed 487.73 M USD of net income which accounts for −21.20% change. Track more Brookfield Asset Management Inc financial stats to get the full picture.
Today Brookfield Asset Management Inc has the market capitalization of 16.20 B, it has decreased by 2.17% over the last week.
Yes, BAM dividends are paid quarterly. The last dividend per share was 0.38 USD. As of today, Dividend Yield (TTM)% is 3.40%. Tracking Brookfield Asset Management Inc dividends might help you take more informed decisions.
Brookfield Asset Management Inc dividend yield was 3.26% in 2023, and payout ratio reached 27.21%. The year before the numbers were 1.12% and 7.16% correspondingly. See high-dividend stocks and find more opportunities for your portfolio.
Like other stocks, BAM shares are traded on stock exchanges, e.g. Nasdaq, Nyse, Euronext, and the easiest way to buy them is through an online stock broker. To do this, you need to open an account and follow a broker's procedures, then start trading. You can trade Brookfield Asset Management Inc stock right from TradingView charts — choose your broker and connect to your account.
Investing in stocks requires a comprehensive research: you should carefully study all the available data, e.g. company's financials, related news, and its technical analysis. So Brookfield Asset Management Inc technincal analysis shows the neutral today, and its 1 week rating is buy. Since market conditions are prone to changes, it's worth looking a bit further into the future — according to the 1 month rating Brookfield Asset Management Inc stock shows the buy signal. See more of Brookfield Asset Management Inc technicals for a more comprehensive analysis.
If you're still not sure, try looking for inspiration in our curated watchlists.
If you're still not sure, try looking for inspiration in our curated watchlists.
We've gathered analysts' opinions on Brookfield Asset Management Inc future price: according to them, BAM price has a max estimate of 52.95 USD and a min estimate of 28.97 USD. Watch BAM chart and read a more detailed Brookfield Asset Management Inc stock forecast: see what analysts think of Brookfield Asset Management Inc and suggest that you do with its stocks.
EBITDA measures a company's operating performance, its growth signifies an improvement in the efficiency of a company. Brookfield Asset Management Inc EBITDA is 2.59 B USD, and current EBITDA margin is 62.63%. See more stats in Brookfield Asset Management Inc financial statements.