GBPNZD: Bearish Continuation & Short Trade
GBPNZD
- Classic bearish pattern
- Our team expects retracement
SUGGESTED TRADE:
Swing Trade
Sell GBPNZD
Entry - 2.3248
Stop - 2.3287
Take - 2.3187
Our Risk - 1%
Start protection of your profits from lower levels
Disclosure: I am part of Trade Nation's Influencer program and receive a monthly fee for using their TradingView charts in my analysis.
❤️ Please, support our work with like & comment! ❤️
Short!!!!

USD/JPY - Multi Timeframe Analysis🚀 USD/JPY Forecast: Breaking Out of the Wedge! 🚀
Hey traders! 👀 The USD/JPY is looking like it’s gearing up for a big move, so let’s dive into the charts and break it down.
🔍 4-Hour Chart (Top Left):
We’ve got an Ascending Wedge Formation on our hands! Price has been creeping up towards key resistance, but it’s been bouncing off this trendline like a pinball. Look at the Entry Zone right here — we could see a breakout soon, either to the upside or downside. Are we going to push higher, or is this the calm before the storm? ⚡
🎯 Target Levels:
Target 1: First stop if the breakout happens is just above 155.00.
Target 2 : After that, we’re eyeing 156.00, which could be a major resistance zone.
📅 Daily Chart (Middle):
On the daily, we’re still seeing that wedge formation play out. The pressure is building, and it's almost time for the price to make its move. Will the bulls keep charging, or will we see a shift in momentum? That strong support below might just give us a push if we drop back down.
📊 Weekly Chart (Bottom Right):
Looking at the long-term picture, USD/JPY is in an upward trend, breaking through key resistance levels over the last few months. We’ve already seen a Break of Structure (BOS) at 151.00, and now we’re breaking above 154.00! This could signal the continuation of the uptrend as we eye 156.00 next.
💥 Key Levels to Watch:
Resistance: 156.00 (Eyes on this level — it could be the next big hurdle!)
Support : 152.00 (Look for a possible retracement here if we see a pullback)
Next Target: If we break 156.00, we could see USD/JPY heading even higher towards 160.00 in the coming months!
🔥 What’s Next?
The squeeze is real! Will USD/JPY break higher, or are we about to see a sharp reversal? Either way, there’s plenty of action to look forward to in the coming days. Make sure you’re ready!
💬 How are you planning to trade USD/JPY right now? Drop your thoughts below and let’s discuss the setup!

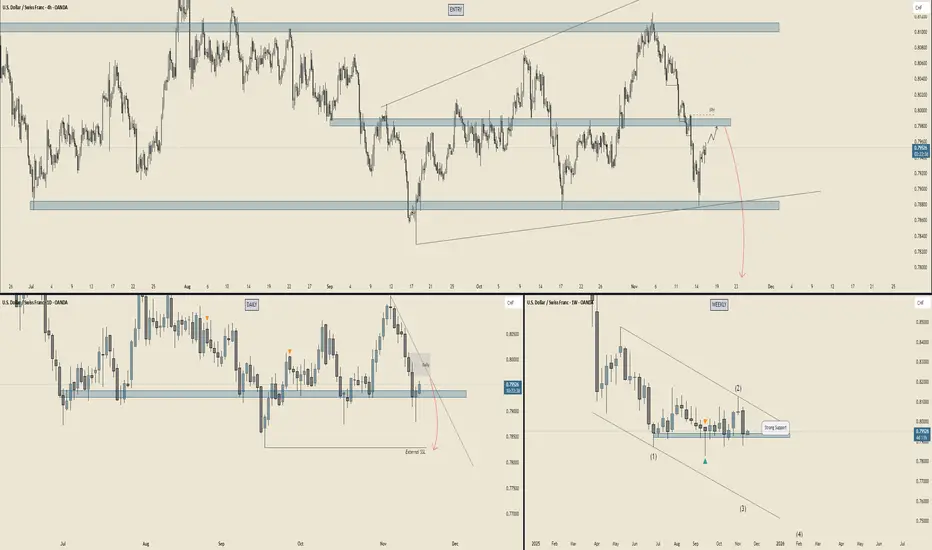
USD/CHF - Multi Timeframe Analysis🚨 USD/CHF Forecast: The Next Move is Almost Here! 🚨
Hey traders, check out this detailed analysis of USD/CHF on the 4-hour, Daily, and Weekly charts. A lot's going on, so let's break it down!
🔍 4-Hour Chart (Top Left):
We’re seeing price testing major support and resistance levels (highlighted in blue). The market looks ready to make a move! We’re keeping a close eye on the Entry Zone at the top, where we might see a continuation of the trend. If we see price action confirming this, it’s game time! ⚡
📅 Daily Chart (Middle Left):
Price has been in a downward trend, but notice that crucial support zone forming below. The trend seems like it could be ready for a bounce back. Will the support hold, or are we headed for a deeper pullback? The next few days will be key! 💡
📊 Weekly Chart (Bottom Right):
Big picture time! This looks like the beginning of something exciting. The longer-term trend is in a clear downward channel (marked by those diagonal lines). That strong support at 0.7800 could be our lifeline. If it holds, we might see the pair shoot up in the coming weeks. 📈✨
💥 Key Levels to Watch:
Resistance : 0.8100 (Keep your eyes on this! It’s a major barrier to break).
Support : 0.7800 (This is where things could get interesting).
Next Target : If the support holds, we could see a move higher toward 0.8000, and potentially test the resistance zone again.
🌟 What’s Next?
The battle between the bulls and bears is heating up! Will USD/CHF rebound off this support level, or will it break lower? Stay tuned for confirmation of the move and prepare for action. 📉📈
SILVER BEARS WILL DOMINATE THE MARKET|SHORT
SILVER SIGNAL
Trade Direction: short
Entry Level: 5,103.6
Target Level: 4,498.0
Stop Loss: 5,504.6
RISK PROFILE
Risk level: medium
Suggested risk: 1%
Timeframe: 1D
Disclosure: I am part of Trade Nation's Influencer program and receive a monthly fee for using their TradingView charts in my analysis.
✅LIKE AND COMMENT MY IDEAS✅

CHF/JPY SENDS CLEAR BEARISH SIGNALS|SHORT
CHF/JPY SIGNAL
Trade Direction: short
Entry Level: 194.825
Target Level: 191.430
Stop Loss: 197.075
RISK PROFILE
Risk level: medium
Suggested risk: 1%
Timeframe: 12h
Disclosure: I am part of Trade Nation's Influencer program and receive a monthly fee for using their TradingView charts in my analysis.
✅LIKE AND COMMENT MY IDEAS✅

NZD/JPY BEARS ARE GAINING STRENGTH|SHORT
Hello, Friends!
NZD-JPY uptrend evident from the last 1W green candle makes short trades more risky, but the current set-up targeting 86.923 area still presents a good opportunity for us to sell the pair because the resistance line is nearby and the BB upper band is close which indicates the overbought state of the NZ/JPY pair.
Disclosure: I am part of Trade Nation's Influencer program and receive a monthly fee for using their TradingView charts in my analysis.
✅LIKE AND COMMENT MY IDEAS✅

CAD/JPY SELLERS WILL DOMINATE THE MARKET|SHORT
Hello, Friends!
CAD/JPY pair is in the uptrend because previous week’s candle is green, while the price is clearly rising on the 1D timeframe. And after the retest of the resistance line above I believe we will see a move down towards the target below at 108.605 because the pair overbought due to its proximity to the upper BB band and a bearish correction is likely.
Disclosure: I am part of Trade Nation's Influencer program and receive a monthly fee for using their TradingView charts in my analysis.
✅LIKE AND COMMENT MY IDEAS✅

AUD/CHF BEARISH BIAS RIGHT NOW| SHORT
Hello, Friends!
AUD/CHF is trending down which is clear from the red colour of the previous weekly candle. However, the price has locally surged into the overbought territory. Which can be told from its proximity to the BB upper band. Which presents a great trend following opportunity for a short trade from the resistance line above towards the demand level of 0.519.
Disclosure: I am part of Trade Nation's Influencer program and receive a monthly fee for using their TradingView charts in my analysis.
✅LIKE AND COMMENT MY IDEAS✅

NZDCAD: Weak Market & Bearish Forecast
Remember that we can not, and should not impose our will on the market but rather listen to its whims and make profit by following it. And thus shall be done today on the NZDCAD pair which is likely to be pushed down by the bears so we will sell!
Disclosure: I am part of Trade Nation's Influencer program and receive a monthly fee for using their TradingView charts in my analysis.
❤️ Please, support our work with like & comment! ❤️

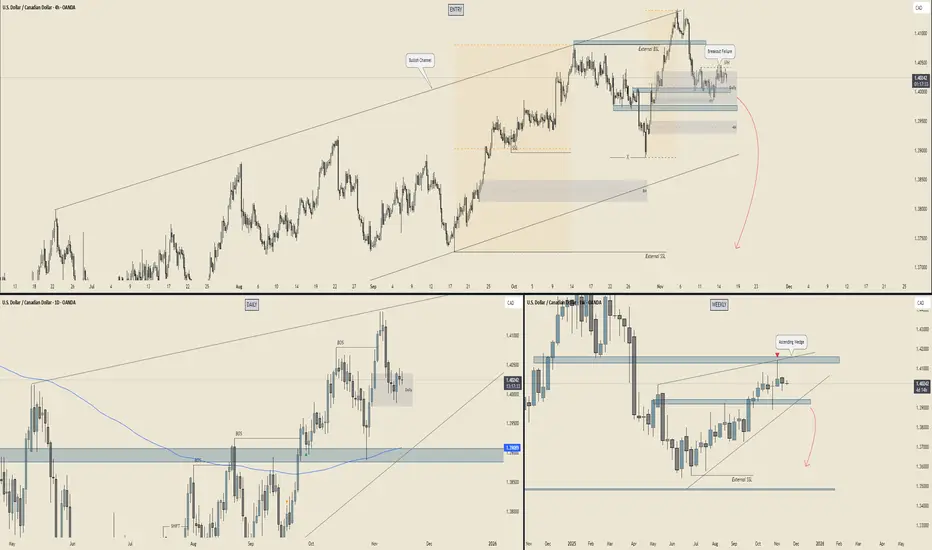
USD/CAD - Multi Timeframe Analysis🧱 WEEKLY – The Big Dog View
Bias: 🐻 Bearish pressure building
Why:
Price is pushing into that massive weekly supply while sitting inside an ascending wedge — textbook distribution energy.
The wedge resistance + supply block is basically a double whammy ceiling.
Reaction wicks show buyers getting tired… sellers warming up.
Beneath current price? A HUGE vacuum of clean, unmitigated price action → easy liquidity to the downside.
🎯 Weekly Target Zones:
1.3900–1.3850 = first stop (mid-range demand)
1.3650–1.3550 = main deep target
External SSL much lower = long-term magnet
👉 Weekly says: “Yo… down only unless we get a breakout above supply.”
📆 DAILY – Internal Structure Rolling Over
Bias : 🐻 Turning bearish
Why : Daily BOS formed on the drop → clear bearish intent.
Price pulled back into a fresh daily supply, reacted cleanly, and is now stalling.
Daily is coiling under resistance = distribution micro-pattern.
As long as the daily mitigation block holds, rallies are just liquidity grabs.
🔥 Daily Key Levels:
Hold below 1.4070 = bearish continuation
Break below 1.3950 = flush into 1.3900
Lose 1.3900 = full send toward 1.38 → 1.37
👉 Daily is setting up the breakdown leg.
⏳ 4H – The Execution Chart (The Juice)
Bias : 🐻 Bearish retest + roll
Why : The 4H bullish channel got broken → structure shift.
We even have a breakout failure at the top = classic “trap the buyers then nuke it.”
4H supply stacking beautifully (Daily + 4H combo).
Price trapped sideways waiting for a trigger → likely a fake-out pop then drop, or a straight collapse.
📌 4H Key Areas:
4H supply: 1.4030–1.4060 = Sell zone
4H support: 1.3950 = Break this → waterfall
Next demand: 1.3880 then the huge imbalance to 1.3800
🎯 4H Targets:
Short-term: 1.3950
Medium: 1.3880
Main: 1.3800
🚀 SUMMARY – USD/CAD Forecast
🔥 Overall Bias: BEARISH (Weekly + Daily + 4H aligned)
🔽 Direction: Expect downside continuation
🎯 Main Target: 1.3800
🧯 Invalidation: Clean daily close above 1.4070 (rare unless oil nukes or USD goes parabolic)
✨ The Likely Path:
Small 4H pullback into supply
Break of 1.3950 internal floor
Fast slide into 1.3880
Larger drop toward 1.3800–1.3750
GBPJPY Trading Opportunity! SELL!
My dear followers,
This is my opinion on the GBPJPY next move:
The asset is approaching an important pivot point 203.70
Bias - Bearish
Safe Stop Loss - 203.93
Technical Indicators: Supper Trend generates a clear short signal while Pivot Point HL is currently determining the overall Bearish trend of the market.
Goal - 203.35
About Used Indicators:
For more efficient signals, super-trend is used in combination with other indicators like Pivot Points.
Disclosure: I am part of Trade Nation's Influencer program and receive a monthly fee for using their TradingView charts in my analysis.
———————————
WISH YOU ALL LUCK

EURAUD What Next? SELL!
My dear friends,
EURAUD looks like it will make a good move, and here are the details:
The market is trading on 1.7810 pivot level.
Bias - Bearish
Technical Indicators: Supper Trend generates a clear short signal while Pivot Point HL is currently determining the overall Bearish trend of the market.
Goal - 1.7730
About Used Indicators:
Pivot points are a great way to identify areas of support and resistance, but they work best when combined with other kinds of technical analysis
Disclosure: I am part of Trade Nation's Influencer program and receive a monthly fee for using their TradingView charts in my analysis.
———————————
WISH YOU ALL LUCK

USDJPY Breakout and Potential RetraceHey Traders, in today's trading session we are monitoring USDJPY for a selling opportunity around 154.700 zone, USDJPY was trading in a downtrend and successfully managed to break it out. Currently is in a correction phase in which it is approaching the retrace area at 154.700 support and resistance zone.
Trade safe, Joe.

GOLD Will Go Lower From Resistance! Sell!
Here is our detailed technical review for GOLD.
Time Frame: 4h
Current Trend: Bearish
Sentiment: Overbought (based on 7-period RSI)
Forecast: Bearish
The market is on a crucial zone of supply 4,085.57.
The above-mentioned technicals clearly indicate the dominance of sellers on the market. I recommend shorting the instrument, aiming at 3,997.50 level.
P.S
The term oversold refers to a condition where an asset has traded lower in price and has the potential for a price bounce.
Overbought refers to market scenarios where the instrument is traded considerably higher than its fair value. Overvaluation is caused by market sentiments when there is positive news.
Like and subscribe and comment my ideas if you enjoy them!

DXY Will Go Lower! Short!
Please, check our technical outlook for DXY.
Time Frame: 5h
Current Trend: Bearish
Sentiment: Overbought (based on 7-period RSI)
Forecast: Bearish
The market is approaching a significant resistance area 99.554.
Due to the fact that we see a positive bearish reaction from the underlined area, I strongly believe that sellers will manage to push the price all the way down to 99.097 level.
P.S
We determine oversold/overbought condition with RSI indicator.
When it drops below 30 - the market is considered to be oversold.
When it bounces above 70 - the market is considered to be overbought.
Like and subscribe and comment my ideas if you enjoy them!

GBPCHF: Short Signal Explained
GBPCHF
- Classic bearish setup
- Our team expects bearish continuation
SUGGESTED TRADE:
Swing Trade
Short GBPCHF
Entry Point - 1.0454
Stop Loss - 1.0473
Take Profit - 1.0423
Our Risk - 1%
Start protection of your profits from lower levels
Disclosure: I am part of Trade Nation's Influencer program and receive a monthly fee for using their TradingView charts in my analysis.
❤️ Please, support our work with like & comment! ❤️

USDJPY Will Move Lower! Short!
Take a look at our analysis for USDJPY.
Time Frame: 1D
Current Trend: Bearish
Sentiment: Overbought (based on 7-period RSI)
Forecast: Bearish
The market is approaching a key horizontal level 154.543.
Considering the today's price action, probabilities will be high to see a movement to 151.281.
P.S
The term oversold refers to a condition where an asset has traded lower in price and has the potential for a price bounce.
Overbought refers to market scenarios where the instrument is traded considerably higher than its fair value. Overvaluation is caused by market sentiments when there is positive news.
Like and subscribe and comment my ideas if you enjoy them!

AUD/JPY BEST PLACE TO SELL FROM|SHORT
Hello, Friends!
AUD/JPY pair is trading in a local uptrend which we know by looking at the previous 1W candle which is green. On the 1D timeframe the pair is going up too. The pair is overbought because the price is close to the upper band of the BB indicator. So we are looking to sell the pair with the upper BB line acting as resistance. The next target is 99.105 area.
Disclosure: I am part of Trade Nation's Influencer program and receive a monthly fee for using their TradingView charts in my analysis.
✅LIKE AND COMMENT MY IDEAS✅

GBP/USD - Multi Timeframe Analysis GBP/USD – Top-Down Breakdown 🏦💷
WEEKLY 📆 (Big Boss View)
Price is chilling inside a large ascending channel, still respecting the long-term bullish structure.
We’ve tapped into that external sell-side liquidity (the grey zone) and reacted.
Structure still looks corrective, not impulsive.
As long as we hold that monthly demand support, GBP/USD looks like it wants a bigger upside swing toward the 1.3800+ zone 🏹.
Expectation: Sweep → Reversal → Push to the top of the range.
Weekly Bias :
🔻 Short-term weakness
🔺 Long-term bullish continuation (big swing wave 3 incoming)
DAILY 📅 (The Supervisor)
The daily structure is walking itself down in a corrective pullback, respecting the trendline from below.
We’re heading into the daily demand zone + lower swing range boundary.
Liquidity below has been taken previously but not fully mitigated — one more sweep is likely.
After that?
Big rocket-launch potential to form the next higher-timeframe leg up 🚀.
Daily Expectation:
➡️ Dip into daily demand
➡️ One more sweep
➡️ Then reversal toward 1.38
8H / 4H / Intraday (The Workers)
Inside a falling channel, clean bearish flow.
Price is tapping into small demand pockets, causing bounces — but not enough to break structure yet.
Clear BH (bearish high) + SH (swing high) levels show liquidity resting above.
Expect either:
A) Retrace to premium zone → Sell continuation
B) Flush into demand → Hard reversal
Intraday Bias:
Bearish until that higher-timeframe daily/weekly zone hits.
Overall Summary ⚡
GBP/USD is basically doing the classic play:
“Short-term bearish snack → Long-term bullish main meal.”
🍫➡️🥩
HTF (Weekly/Daily): Preparing for a major bullish leg
STF (8H/4H): Still bearish, likely to sweep lows before reversing
Key target on reversal: 1.3700 → 1.3800+

GBPUSD Is Going Down! Sell!
Take a look at our analysis for GBPUSD.
Time Frame: 4h
Current Trend: Bearish
Sentiment: Overbought (based on 7-period RSI)
Forecast: Bearish
The price is testing a key resistance 1.317.
Taking into consideration the current market trend & overbought RSI, chances will be high to see a bearish movement to the downside at least to 1.308 level.
P.S
Please, note that an oversold/overbought condition can last for a long time, and therefore being oversold/overbought doesn't mean a price rally will come soon, or at all.
Like and subscribe and comment my ideas if you enjoy them!

GBP/CAD SHORT FROM RESISTANCE
Hello, Friends!
We are targeting the 1.832 level area with our short trade on GBP/CAD which is based on the fact that the pair is overbought on the BB band scale and is also approaching a resistance line above thus going us a good entry option.
Disclosure: I am part of Trade Nation's Influencer program and receive a monthly fee for using their TradingView charts in my analysis.
✅LIKE AND COMMENT MY IDEAS✅

GBP/JPY BEARS WILL DOMINATE THE MARKET|SHORT
Hello, Friends!
GBP/JPY is making a bullish rebound on the 12H TF and is nearing the resistance line above while we are generally bearish biased on the pair due to our previous 1W candle analysis, thus making a trend-following short a good option for us with the target being the 201.580 level.
Disclosure: I am part of Trade Nation's Influencer program and receive a monthly fee for using their TradingView charts in my analysis.
✅LIKE AND COMMENT MY IDEAS✅

US30 BEST PLACE TO SELL FROM|SHORT
US30 SIGNAL
Trade Direction: short
Entry Level: 48,294.2
Target Level: 47,472.1
Stop Loss: 48,842.3
RISK PROFILE
Risk level: medium
Suggested risk: 1%
Timeframe: 4h
Disclosure: I am part of Trade Nation's Influencer program and receive a monthly fee for using their TradingView charts in my analysis.
✅LIKE AND COMMENT MY IDEAS✅
