AUDCAD Is Going Down! Short!
Here is our detailed technical review for AUDCAD.
Time Frame: 2h
Current Trend: Bearish
Sentiment: Overbought (based on 7-period RSI)
Forecast: Bearish
The market is testing a major horizontal structure 0.920.
Taking into consideration the structure & trend analysis, I believe that the market will reach 0.916 level soon.
P.S
We determine oversold/overbought condition with RSI indicator.
When it drops below 30 - the market is considered to be oversold.
When it bounces above 70 - the market is considered to be overbought.
Like and subscribe and comment my ideas if you enjoy them!
Short!!!!

BTCUSDT Breakdown Ahead: Sellers Eye $108K SupportHello everyone, here is my breakdown of the current Bitcoin setup.
Market Analysis
BTCUSDT has been consolidating within a well-defined range, facing multiple rejections from the $121,700 Resistance Zone. After several failed breakout attempts above this area, the market shifted into a bearish phase, confirming sellers’ dominance. The structure now forms a descending triangle pattern, a classic bearish continuation signal. We can see multiple breakouts and retests throughout the move, with price respecting both the Triangle Resistance Line and Support Line. The most recent rejection from the upper boundary of the triangle shows that buyers are losing momentum, while sellers are gradually regaining control.
Currently, BTCUSDT is approaching the Triangle Support Zone around $110,000–$108,800, a crucial level where previous reactions occurred. A clean break below this support area could accelerate the downside move, confirming a continuation toward the lower Support Zone near $105,000–$103,000.
My Scenario & Strategy
In my view, BTC remains in a vulnerable technical position. If the price closes below the $108,800 level, this would likely trigger a fresh bearish impulse, leading to deeper declines. Until a confirmed breakout happens, short-term traders may look for retest entries after breakdowns for better risk-to-reward setups.
However, if BTC finds strong support and rebounds from this level, we could see a short-term correction toward $114,000–$116,000, which would act as a retest of the Triangle Resistance Line before further decline. For now, my bias remains bearish, expecting continuation to the downside as long as price stays below the $114,000–$116,000 resistance zone.
That's the setup I'm tracking. Thank you for your attention, and always manage your risk.

AUDCAD: Bears Will Push Lower
The recent price action on the AUDCAD pair was keeping me on the fence, however, my bias is slowly but surely changing into the bearish one and I think we will see the price go down.
Disclosure: I am part of Trade Nation's Influencer program and receive a monthly fee for using their TradingView charts in my analysis.
❤️ Please, support our work with like & comment! ❤️

NZDUSD: Bearish Continuation & Short Trade
NZDUSD
- Classic bearish formation
- Our team expects pullback
SUGGESTED TRADE:
Swing Trade
Short NZDUSD
Entry - 0.5800
Sl - 0.5808
Tp - 0.5786
Our Risk - 1%
Start protection of your profits from lower levels
Disclosure: I am part of Trade Nation's Influencer program and receive a monthly fee for using their TradingView charts in my analysis.
❤️ Please, support our work with like & comment! ❤️

XAUUSD Short: Selling the Bounce Within the Descending ChannelHello, traders! The price action for Gold (XAUUSD) has been dominated by a bearish structure since the breakout below the ascending channel and rejection from the SUPPLY ZONE 2 near 4250. This move initiated a clear downtrend, forming a descending channel that has guided the market lower through a sequence of impulsive declines and short corrective rebounds.
Currently, the price is testing the Demand Line of this descending channel, located just above the Demand Zone around 3867. This zone represents a key area of potential buying interest that previously acted as a reaction point during earlier phases of the uptrend. In my view, the market is now entering a critical stage. A temporary corrective rally towards the upper boundary of the channel (near the Supply Zone 1 at 3950–4100) is likely before sellers may step in again to resume the broader downtrend.
My scenario anticipates that this corrective bounce will be limited, with sellers defending the Supply Zone 1, leading to another move downward toward the Demand Zone and potentially lower levels. A confirmed reversal signal in this area, however, could offer a long opportunity for a larger bullish impulse later on. Manage your risk!

BTCUSD Short: Sellers Aiming for a Pullback Toward 109,600Hello, traders! Bitcoin (BTCUSD) continues to trade within a broader corrective structure after losing momentum from its previous bullish phase inside the Ascending Channel. The breakdown from the channel shifted the short-term sentiment from bullish to neutral-bearish, with sellers now defending the upper boundary of the current Supply Zone. After the strong rejection from the 118K–116K region, BTC entered a range-bound phase between 109,600 (Demand Zone) and 116K (Supply Line). This range represents a period of accumulation or distribution — depending on how the price reacts at its edges.
Recently, the price retested the upper boundary of the Supply Zone, where a fake breakout occurred, followed by selling pressure — a clear sign that supply remains dominant. Now, the market is showing early signs of potential correction back toward the Demand Line near 109,600, where buyers previously stepped in to defend the trend.
If the bearish momentum continues, I expect a move down toward the Demand Zone around 109,600–107,700. This area aligns with both a key pivot point and the ascending demand line, which could act as a springboard for another bullish rebound. Conversely, a confirmed breakout above 116K would invalidate the short-term bearish outlook and signal a possible continuation toward higher resistance levels. For now, my bias remains bearish-to-neutral, anticipating a short-term correction before a potential bullish reaction from the demand area. Manage your risk!

EURCHF: Bearish Continuation is Expected! Here is Why:
It is essential that we apply multitimeframe technical analysis and there is no better example of why that is the case than the current EURCHF chart which, if analyzed properly, clearly points in the downward direction.
Disclosure: I am part of Trade Nation's Influencer program and receive a monthly fee for using their TradingView charts in my analysis.
❤️ Please, support our work with like & comment! ❤️

NZDJPY: Short Signal with Entry/SL/TP
NZDJPY
- Classic bearish pattern
- Our team expects retracement
SUGGESTED TRADE:
Swing Trade
Sell NZDJPY
Entry - 88.098
Stop - 88.203
Take - 87.884
Our Risk - 1%
Start protection of your profits from lower levels
Disclosure: I am part of Trade Nation's Influencer program and receive a monthly fee for using their TradingView charts in my analysis.
❤️ Please, support our work with like & comment! ❤️

CADJPY Is Very Bearish! Sell!
Please, check our technical outlook for CADJPY.
Time Frame: 1D
Current Trend: Bearish
Sentiment: Overbought (based on 7-period RSI)
Forecast: Bearish
The market is trading around a solid horizontal structure 109.243.
The above observations make me that the market will inevitably achieve 107.474 level.
P.S
The term oversold refers to a condition where an asset has traded lower in price and has the potential for a price bounce.
Overbought refers to market scenarios where the instrument is traded considerably higher than its fair value. Overvaluation is caused by market sentiments when there is positive news.
Like and subscribe and comment my ideas if you enjoy them!

GOLD SELLERS WILL DOMINATE THE MARKET|SHORT
GOLD SIGNAL
Trade Direction: short
Entry Level: 4,027.15
Target Level: 3,890.12
Stop Loss: 4,118.76
RISK PROFILE
Risk level: medium
Suggested risk: 1%
Timeframe: 2h
Disclosure: I am part of Trade Nation's Influencer program and receive a monthly fee for using their TradingView charts in my analysis.
✅LIKE AND COMMENT MY IDEAS✅

AUD/CAD BEARISH BIAS RIGHT NOW| SHORT
AUD/CAD SIGNAL
Trade Direction: short
Entry Level: 0.919
Target Level: 0.903
Stop Loss: 0.931
RISK PROFILE
Risk level: medium
Suggested risk: 1%
Timeframe: 1D
Disclosure: I am part of Trade Nation's Influencer program and receive a monthly fee for using their TradingView charts in my analysis.
✅LIKE AND COMMENT MY IDEAS✅

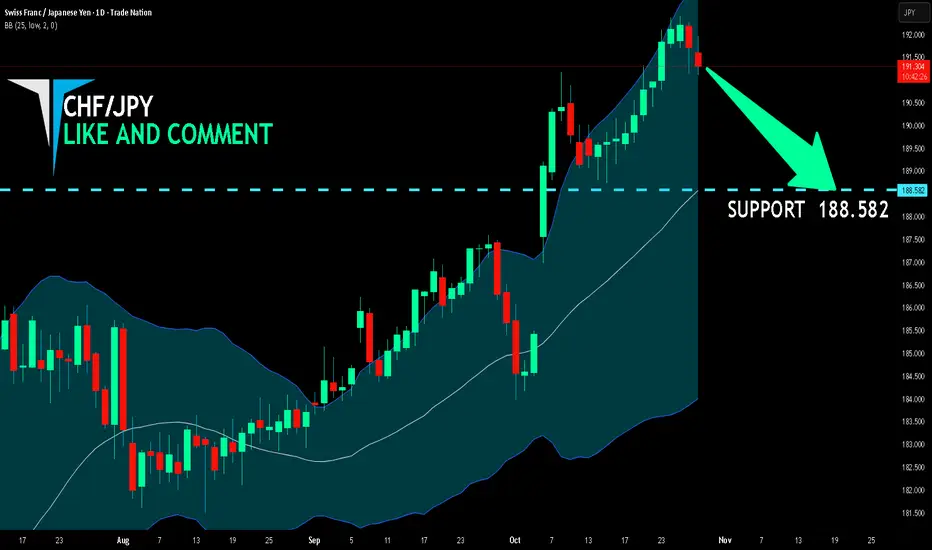
CHF/JPY BEST PLACE TO SELL FROM|SHORT
Hello, Friends!
CHF-JPY uptrend evident from the last 1W green candle makes short trades more risky, but the current set-up targeting 188.582 area still presents a good opportunity for us to sell the pair because the resistance line is nearby and the BB upper band is close which indicates the overbought state of the CHF/JPY pair.
Disclosure: I am part of Trade Nation's Influencer program and receive a monthly fee for using their TradingView charts in my analysis.
✅LIKE AND COMMENT MY IDEAS✅
NZD/JPY BEARS ARE STRONG HERE|SHORT
Hello, Friends!
NZD/JPY pair is in the uptrend because previous week’s candle is green, while the price is evidently rising on the 1H timeframe. And after the retest of the resistance line above I believe we will see a move down towards the target below at 87.841 because the pair overbought due to its proximity to the upper BB band and a bearish correction is likely.
Disclosure: I am part of Trade Nation's Influencer program and receive a monthly fee for using their TradingView charts in my analysis.
✅LIKE AND COMMENT MY IDEAS✅

NZD/CHF BEARS ARE GAINING STRENGTH|SHORT
Hello, Friends!
NZD/CHF is making a bullish rebound on the 2H TF and is nearing the resistance line above while we are generally bearish biased on the pair due to our previous 1W candle analysis, thus making a trend-following short a good option for us with the target being the 0.456 level.
Disclosure: I am part of Trade Nation's Influencer program and receive a monthly fee for using their TradingView charts in my analysis.
✅LIKE AND COMMENT MY IDEAS✅

EURUSD: Buyers Gaining Momentum Near Key Support ZoneHello everyone, here is my breakdown of the current Euro setup.
Market Analysis
EURUSD has been moving within a clear downward channel, forming consistent lower highs and lower lows over the past few weeks. Each attempt to break above the resistance line has resulted in a fake breakout, confirming that sellers have maintained control through most of this structure.
Recently, the pair found strong buyer support near 1.1550, a key support zone that has held multiple times in the past. After testing this level, the price bounced upward, breaking the channel’s upper boundary and forming a triangle structure — signaling that market momentum is shifting from bearish to corrective. Currently, EURUSD is testing the Triangle Resistance Line around 1.1670–1.1700, an important resistance area where previous rallies have stalled. The overall structure suggests that the market might face renewed selling pressure from this zone.
My Scenario & Strategy
From my perspective, EURUSD could see a short-term pullback from the resistance area before any potential breakout confirmation. A rejection here would likely push price back toward the Triangle Support Line or even the 1.1580–1.1550 support zone, where buyers could reenter.If, however, the pair manages to break and hold above 1.1700, it would indicate growing bullish momentum, possibly targeting 1.1750 — the top of the previous resistance area.
Until such confirmation appears, I expect a corrective move downward within the triangle formation as part of a broader consolidation phase.
That's the setup I'm tracking. Thank you for your attention, and always manage your risk.

EURUSD Breakdown Looms: Sellers Target 1.1560 Support ZoneHello traders, I want to share my opinion about the current EURUSD setup. After an extended bearish movement, EURUSD continues to trade within a descending channel, clearly defined by a Resistance Line connecting recent lower highs and a Support Line connecting the local lows. This structure outlines the ongoing corrective trend that has been developing over the past weeks. Recently, the price made a moderate bullish correction after rebounding from the Buyer Zone (1.15600–1.15800) — a key demand area where strong buying activity had previously emerged. However, this rebound brought EURUSD back into the Seller Zone, aligning with the upper boundary of the descending channel and the Resistance Level near 1.16600. At this stage, the market is showing early signs of bearish pressure from this confluence area. If sellers continue to hold the upper boundary, a rejection from the Resistance Line would confirm the continuation of the descending trend structure. I expect the price to rotate back down toward the Buyer Zone near 1.15600, which remains the main local support area. A confirmed breakdown below this level could trigger further momentum toward lower support targets, while a strong rebound could indicate the start of a potential accumulation phase. As of now, my scenario favors a short-term bearish continuation from resistance toward the 1.15600 target zone (TP1). Please share this idea with your friends and click Boost 🚀

ETH Short Setup🚨 ETH Short Setup
Ethereum just confirmed a Break of Structure (BOS) after failing to hold above both EMAs. This rejection — together with a liquidity sweep near 4230 — signals potential continuation to the downside.
🎯 Trade Plan Overview:
Entry: 4020–4050
Stop: 4100–4120
Targets: 3960 → 3840
Risk/Reward: 1:3
📊 Key zones:
EMA short attention zone ✅
Support: 3920–3960 equilibrium
Watch for bullish divergence before reversal
🔔 Subscribe for daily ETH and BTC market updates, crypto trading strategies, and AI-powered technical analysis!

EUR/USD - Sell Trade setup🔥 EUR/USD 1H Forecast – Bears Back in Control! 🔥
Alright, traders — buckle up 😎
🧠 Market Structure
Price just tapped into that 1H supply zone around 1.16500, rejected hard, and is now breaking short-term structure to the downside. The clean liquidity sweep above highs flipped into bearish momentum — classic distribution setup 👇
You can clearly see a lower-high forming under the trendline, confirming HTF bearish order flow still dominates.
💣 Technical Breakdown
🧱 Supply Zone (Entry Zone): 1.1645 – 1.1660
🎯 Target Zone (Demand): 1.1550 – 1.1560
📉 Internal Structure: Break of short-term demand + retest = continuation leg
🧭 Trendline: Dynamic resistance still holding from previous swing highs
⚡ Momentum: Strong bearish candles + clean imbalance below
🩸 Game Plan
If price retests the minor 1.1630–1.1640 pocket, that’s a potential re-entry short zone for continuation toward the daily demand sitting near 1.1550.
Stops ideally above the 1.1660 wick, aiming for a 1 : 4 R-R toward the next liquidity pool.
🧩 Bias
🔻 Bearish — HTF confirms downside control, with lower-timeframe structure following through.
🧠 Quick Take
The bulls had their snack stop 🍪 at 1.1650 — now it’s time for bears to eat. If we get a clean retest, expect momentum to drive EUR/USD toward that 1.1550 low sweep before any potential bounce.

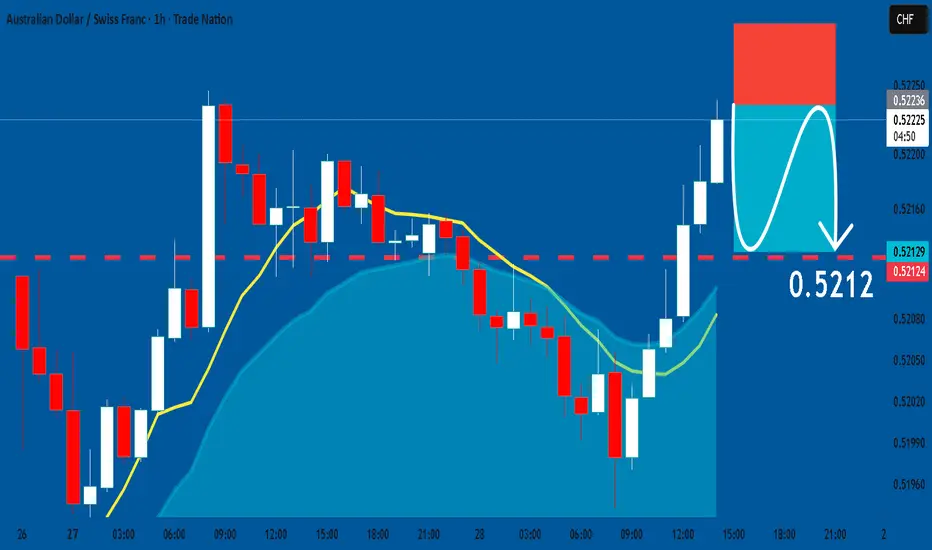
AUDCHF: Short Signal Explained
AUDCHF
- Classic bearish formation
- Our team expects fall
SUGGESTED TRADE:
Swing Trade
Sell AUDCHF
Entry Level - 0.5223
Sl - 0.5229
Tp - 0.5212
Our Risk - 1%
Start protection of your profits from lower levels
Disclosure: I am part of Trade Nation's Influencer program and receive a monthly fee for using their TradingView charts in my analysis.
❤️ Please, support our work with like & comment! ❤️
AUDNZD Technical Analysis! SELL!
My dear friends,
Please, find my technical outlook for AUDNZD below:
The price is coiling around a solid key level - 1.1374
Bias - Bearish
Technical Indicators: Pivot Points Low anticipates a potential price reversal.
Super trend shows a clear sell, giving a perfect indicators' convergence.
Goal - 1.1347
About Used Indicators:
The pivot point itself is simply the average of the high, low and closing prices from the previous trading day.
Disclosure: I am part of Trade Nation's Influencer program and receive a monthly fee for using their TradingView charts in my analysis.
———————————
WISH YOU ALL LUCK

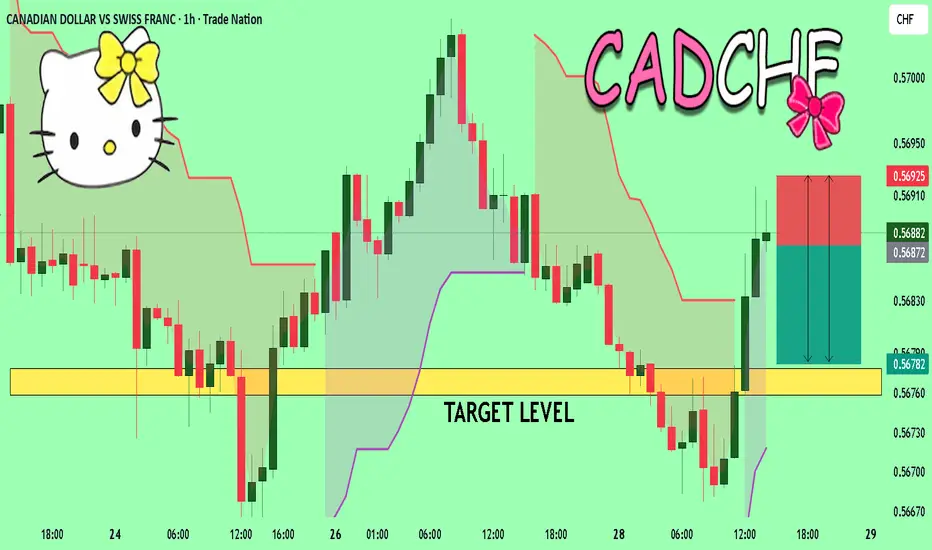
CADCHF A Fall Expected! SELL!
My dear followers,
I analysed this chart on CADCHFand concluded the following:
The market is trading on 0.5687 pivot level.
Bias - Bearish
Technical Indicators: Both Super Trend & Pivot HL indicate a highly probable Bearish continuation.
Target -0.5677
Safe Stop Loss - 0.5692
About Used Indicators:
A super-trend indicator is plotted on either above or below the closing price to signal a buy or sell. The indicator changes color, based on whether or not you should be buying. If the super-trend indicator moves below the closing price, the indicator turns green, and it signals an entry point or points to buy.
Disclosure: I am part of Trade Nation's Influencer program and receive a monthly fee for using their TradingView charts in my analysis.
———————————
WISH YOU ALL LUCK
BTC Enters Breakdown Area — Volume Could Push Back Below $110KBTC Enters Breakdown Area — Volume Could Push Back Below $110K ⚠️
The previous volume that took BTC before 101K has some trends of this volume, which has a manipulation views, the volume before that did took BTC below 101K ended with a fakeout.
Bitcoin has entered the breakdown area, showing early weakness as price struggles to hold momentum near $115K.
The recent volume spike looks more like distribution pressure than accumulation, signaling that a correction phase could be forming.
📉 Current outlook:
Breakdown zone between $116.3K – $109.7K is active.
Volume is rising, but without strong upward continuation — a sign of selling absorption.
If this pattern holds, BTC could retest the $110K zone or drop slightly below in the next move.
📊 Observation:
The market is testing the upper side of the breakdown range but lacks follow-through.
A close back under $114K would confirm weakness and invite further downside momentum.
💬 Summary:
BTC is inside its breakdown area, and current volume suggests pressure may build to drive price back below $110K if buyers fail to reclaim control soon.

SILVER Will Go Lower From Resistance! Sell!
Please, check our technical outlook for SILVER.
Time Frame: 15m
Current Trend: Bearish
Sentiment: Overbought (based on 7-period RSI)
Forecast: Bearish
The market is approaching a significant resistance area 4,652.6.
Due to the fact that we see a positive bearish reaction from the underlined area, I strongly believe that sellers will manage to push the price all the way down to 4,606.3 level.
P.S
Please, note that an oversold/overbought condition can last for a long time, and therefore being oversold/overbought doesn't mean a price rally will come soon, or at all.
Like and subscribe and comment my ideas if you enjoy them!
