TESLA Set To Fall! SELL!
My dear friends,
TESLA looks like it will make a good move, and here are the details:
The market is trading on 440.30 pivot level.
Bias - Bearish
Technical Indicators: Supper Trend generates a clear short signal while Pivot Point HL is currently determining the overall Bearish trend of the market.
Goal - 432.72
Recommended Stop Loss - 444.15
About Used Indicators:
Pivot points are a great way to identify areas of support and resistance, but they work best when combined with other kinds of technical analysis
Disclosure: I am part of Trade Nation's Influencer program and receive a monthly fee for using their TradingView charts in my analysis.
———————————
WISH YOU ALL LUCK
Short!!!!

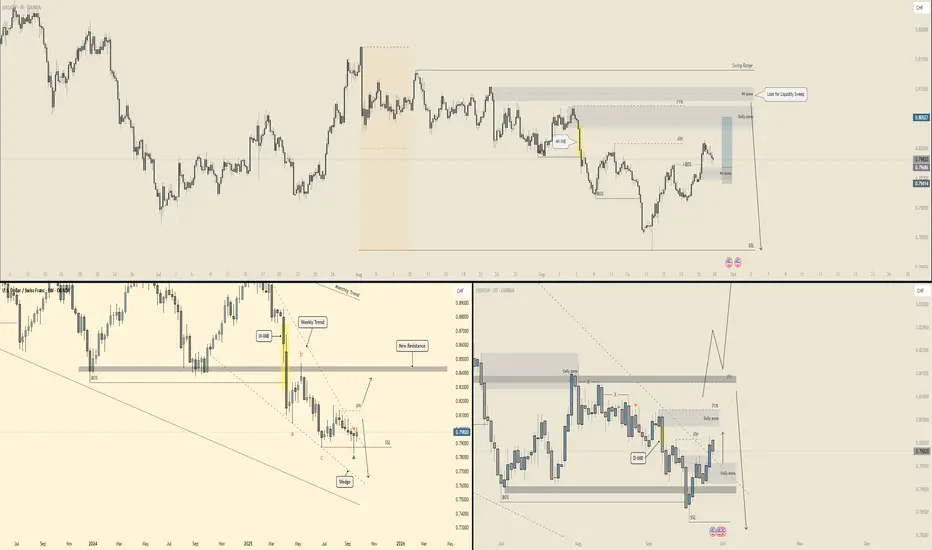
USD/CHF - Multi Timeframe Analysis (Trade setup)📉 USD/CHF – Forecast Breakdown 📉
Time to dissect this one across the charts 👇
🕰 Weekly View
The weekly chart is still in a bearish trend. Price rejected from the monthly/weekly trendline and printed a clean lower-high setup. Structure suggests continuation down unless buyers can flip resistance near 0.83. For now → bias leans bearish, with space to revisit 0.76–0.75 demand.
📅 Daily Structure
Daily shows a swing range with:
BOS south ✅
Liquidity sweep below SSL (sell-side liquidity)
Market retracing toward 0.805–0.81 (daily + 71% zone)
This looks like a setup for a liquidity grab into premium pricing before sellers potentially take control again. The daily zone at 0.805–0.81 is the hot spot to watch for bearish reactions.
⏱ 4H Breakdown
On the 4H:
Price already made a BOS down, confirming short-term bearishness.
Currently pushing back into a 4H + daily supply overlap (0.805–0.81).
Ideal scenario → a sweep of that zone before the next bearish leg, targeting 0.79 → 0.785.
🎯 Summary
Weekly : Bearish, trend pointing lower 📉
Daily : Retrace likely into 0.805–0.81 before rejection ⚔️
4H : Watching for liquidity sweep + reversal confirmation 👀
Bias → Bearish, unless bulls flip above 0.815. Short opportunities favored around the supply zone, targeting 0.79 → 0.785, with deeper extension possible toward 0.76 if momentum holds.
⚠️ Risk note: USD/CHF can grind slowly — patience is key; avoid chasing entries.
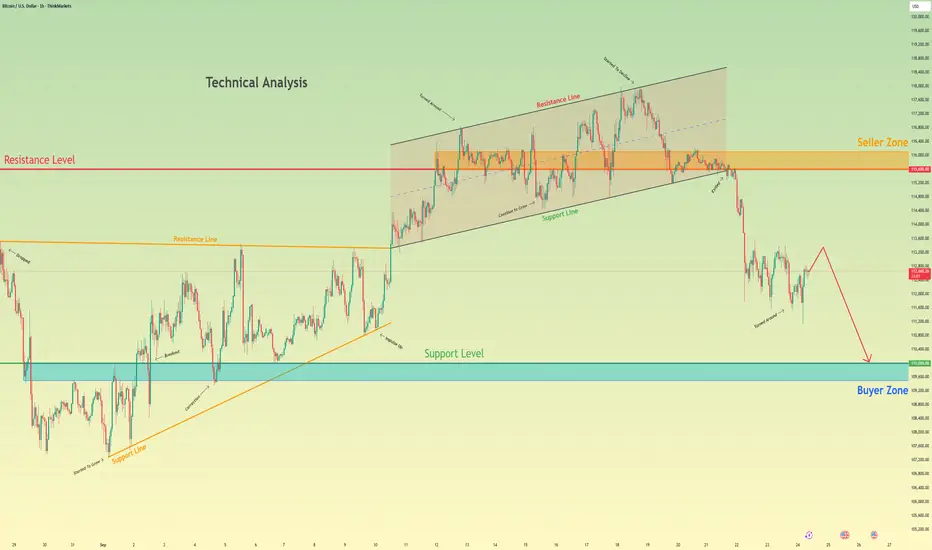
BTCUSD Short: Fading the Rally in a Bear ChannelHello, traders! The price auction for BTCUSD has been in a clear bearish phase since its rejection from the SUPPLY ZONE 2 near 115200. This has established a well-defined descending channel that has been guiding the price lower through a series of impulsive declines and corrective rallies, confirming that sellers have the initiative.
Currently, after testing the lower support line of the channel, the price is in the midst of a corrective bounce. This upward move is carrying the auction towards the upper boundary of the channel, which represents a major area of dynamic resistance.
My scenario for the development of events is that this corrective rally will fail upon testing the channel's resistance line, which aligns with the SUPPLY ZONE around the 111000 level. I expect this area to hold as strong resistance, causing a rejection and a continuation of the primary downtrend. The take-profit is therefore set at 107000, targeting a new lower low within the channel. Manage your risk!

GBP/JPY - Multi timeframe Analysis (We are ready to sell off)🔥 GBP/JPY – Forecast Breakdown 🔥
Alright traders, let’s slice this beast up 👇
🕰 Weekly View
We’re chilling right inside that weekly supply zone after sweeping the BSL. Price already showed signs of exhaustion here, and the structure screams: "Yo, we might dip." If sellers hold this fort, the swing could correct toward the mid-190s — right where demand is waiting.
📅 Daily Structure
Daily chart shows price running liquidity above 200/201 and tapping into resistance. BOS candles already printed earlier in the leg up, so this could be the last stop hunt before a deeper pullback. Daily demand sits 197 – 196, prime snack zone 🍫 for buyers to reload.
⏱ 4H Breakdown
On the 4H, we’ve got:
71% fib reaction ✅
BOS and liquidity sweep above 200.5
Market tapping into a 4H supply zone
That’s textbook SMC (smart money concepts) for a reversal play. Expectation? A possible short run back into 198 – 197, lining up with the daily zone.
🎯 Summary
Weekly : Tapped supply, sellers flexing 💪
Daily : Liquidity grab above 200, correction eyed
4H : 71% retrace + supply reaction, bearish pressure building
Bias → Short-term bearish targeting 198 – 197. Watch for rejections at current levels, but if buyers somehow break above 202, then the short idea is invalidated.
⚠️ Risk note: Stay nimble, this pair moves like a rocket 🚀 and can hunt stops fast.

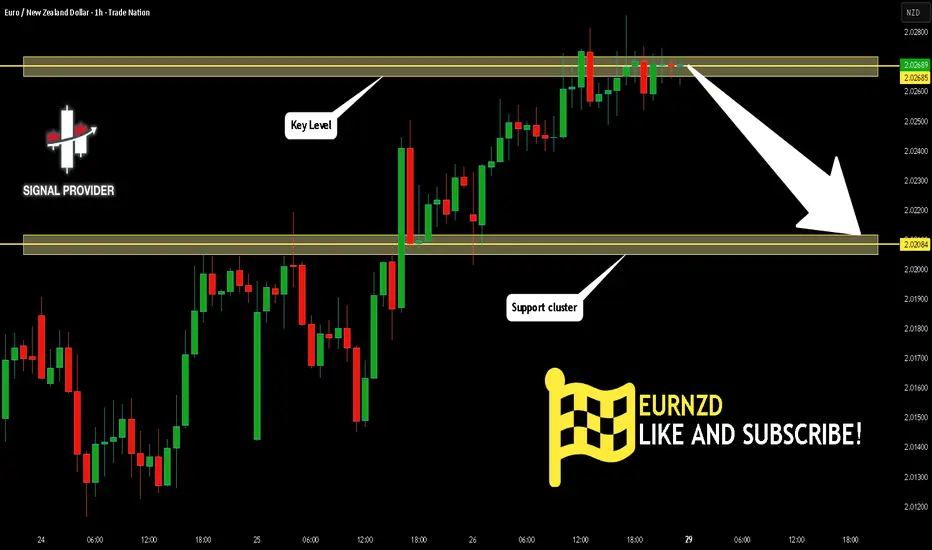
EURNZD Will Fall! Short!
Please, check our technical outlook for EURNZD.
Time Frame: 1h
Current Trend: Bearish
Sentiment: Overbought (based on 7-period RSI)
Forecast: Bearish
The market is trading around a solid horizontal structure 2.026.
The above observations make me that the market will inevitably achieve 2.020 level.
P.S
Overbought describes a period of time where there has been a significant and consistent upward move in price over a period of time without much pullback.
Like and subscribe and comment my ideas if you enjoy them!
GBP/NZD SENDS CLEAR BEARISH SIGNALS|SHORT
Hello, Friends!
We are targeting the 0.978 level area with our short trade on GBP/NZD which is based on the fact that the pair is overbought on the BB band scale and is also approaching a resistance line above thus going us a good entry option.
Disclosure: I am part of Trade Nation's Influencer program and receive a monthly fee for using their TradingView charts in my analysis.
✅LIKE AND COMMENT MY IDEAS✅

USDCHF: Bearish Forecast & Bearish Scenario
The charts are full of distraction, disturbance and are a graveyard of fear and greed which shall not cloud our judgement on the current state of affairs in the USDCHF pair price action which suggests a high likelihood of a coming move down.
Disclosure: I am part of Trade Nation's Influencer program and receive a monthly fee for using their TradingView charts in my analysis.
❤️ Please, support our work with like & comment! ❤️

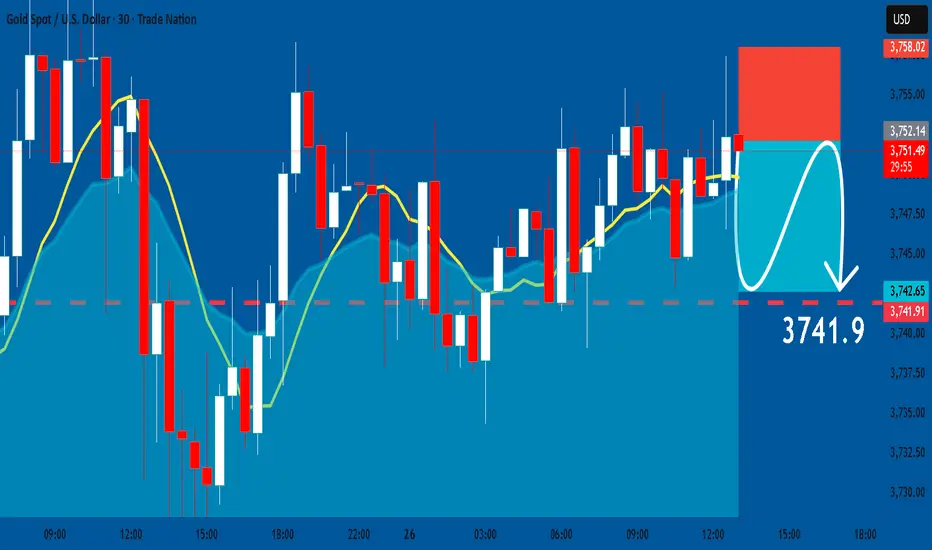
GOLD: Short Signal Explained
GOLD
- Classic bearish formation
- Our team expects fall
SUGGESTED TRADE:
Swing Trade
Sell GOLD
Entry Level - 3752.2
Sl - 3758.0
Tp - 3741.9
Our Risk - 1%
Start protection of your profits from lower levels
Disclosure: I am part of Trade Nation's Influencer program and receive a monthly fee for using their TradingView charts in my analysis.
❤️ Please, support our work with like & comment! ❤️
GBPJPY The Target Is DOWN! SELL!
My dear friends,
Please, find my technical outlook for GBPJPY below:
The price is coiling around a solid key level - 200.13
Bias - Bearish
Technical Indicators: Pivot Points Low anticipates a potential price reversal.
Super trend shows a clear sell, giving a perfect indicators' convergence.
Goal - 199.95
Safe Stop Loss - 200.24
About Used Indicators:
The pivot point itself is simply the average of the high, low and closing prices from the previous trading day.
Disclosure: I am part of Trade Nation's Influencer program and receive a monthly fee for using their TradingView charts in my analysis.
———————————
WISH YOU ALL LUCK

GOLD Massive Short! SELL!
My dear subscribers,
GOLD looks like it will make a good move, and here are the details:
The market is trading on 3754.4 pivot level.
Bias - Bearish
My Stop Loss - 3761.8
Technical Indicators: Both Super Trend & Pivot HL indicate a highly probable Bearish continuation.
Target - 3741.3
About Used Indicators:
The average true range (ATR) plays an important role in 'Supertrend' as the indicator uses ATR to calculate its value. The ATR indicator signals the degree of price volatility.
Disclosure: I am part of Trade Nation's Influencer program and receive a monthly fee for using their TradingView charts in my analysis.
———————————
WISH YOU ALL LUCK

USDCHF Buyers In Panic! SELL!
My dear subscribers,
My technical analysis for USDCHF is below:
The price is coiling around a solid key level - 0.8002
Bias - Bearish
Technical Indicators: Pivot Points Low anticipates a potential price reversal.
Super trend shows a clear sell, giving a perfect indicators' convergence.
Goal - 0.79766
About Used Indicators:
By the very nature of the supertrend indicator, it offers firm support and resistance levels for traders to enter and exit trades. Additionally, it also provides signals for setting stop losses
Disclosure: I am part of Trade Nation's Influencer program and receive a monthly fee for using their TradingView charts in my analysis.
———————————
WISH YOU ALL LUCK

MSTR - Here comes #5 at the CenterlineRemember when I said, I do it again Sam?
Nothing changed. Only the price in the consolidation at P4.
This will temporarily end at P5 (Yellow Count), where I'll take my profit. With a little pressure, price will even make it to the L-MLH.
Then I'll relax and watch, how the Chickens run around and create new opportunity. 🐔🐓
Don't be a Chicken, be the 🦊 Fox 🦊, be clever and have patience.
Happy new week all §8-)

M-USDT SHORTHello friends 💖
💁♂️ I have chosen a cryptocurrency to put on my watchlist
👉 M-USDT
It may be a good opportunity for a short position
I suggest you have this currency on your watchlist and enter with the structure and trigger at the right place
I think the price of this currency has grown too much and we should wait for a price correction gradually
In any case, I will not enter without seeing the structure and I will not take a short position on this currency
💁♂️ Signs of trend weakness:
The slope of the tops is decreasing
The tops are getting closer
The chart's movement angle is also decreasing and becoming negative
Lower tops are forming
Lower bottoms are forming
⚠️ None of the analysis is a recommendation to buy or sell, but simply my personal opinions on the charts. You can use the charts and choose any that interest you and take a position if you wish.

GBPUSD Will Go Down! Sell!
Here is our detailed technical review for GBPUSD.
Time Frame: 6h
Current Trend: Bearish
Sentiment: Overbought (based on 7-period RSI)
Forecast: Bearish
The market is on a crucial zone of supply 1.336.
The above-mentioned technicals clearly indicate the dominance of sellers on the market. I recommend shorting the instrument, aiming at 1.326 level.
P.S
Overbought describes a period of time where there has been a significant and consistent upward move in price over a period of time without much pullback.
Like and subscribe and comment my ideas if you enjoy them!

EUR/NZD BEST PLACE TO SELL FROM|SHORT
Hello, Friends!
It makes sense for us to go short on EUR/NZD right now from the resistance line above with the target of 1.988 because of the confluence of the two strong factors which are the general downtrend on the previous 1W candle and the overbought situation on the lower TF determined by it’s proximity to the upper BB band.
Disclosure: I am part of Trade Nation's Influencer program and receive a monthly fee for using their TradingView charts in my analysis.
✅LIKE AND COMMENT MY IDEAS✅

EUR/CAD BEARS WILL DOMINATE THE MARKET|SHORT
EUR/CAD SIGNAL
Trade Direction: short
Entry Level: 1.632
Target Level: 1.625
Stop Loss: 1.636
RISK PROFILE
Risk level: medium
Suggested risk: 1%
Timeframe: 9h
Disclosure: I am part of Trade Nation's Influencer program and receive a monthly fee for using their TradingView charts in my analysis.
✅LIKE AND COMMENT MY IDEAS✅

EUR/USD SENDS CLEAR BEARISH SIGNALS|SHORT
Hello, Friends!
We are now examining the EUR/USD pair and we can see that the pair is going up locally while also being in a uptrend on the 1W TF. But there is also a powerful signal from the BB upper band being nearby, indicating that the pair is overbought so we can go short from the resistance line above and a target at 1.173 level.
Disclosure: I am part of Trade Nation's Influencer program and receive a monthly fee for using their TradingView charts in my analysis.
✅LIKE AND COMMENT MY IDEAS✅

CADJPY: Bearish Forecast & Outlook
The price of CADJPY will most likely collapse soon enough, due to the supply beginning to exceed demand which we can see by looking at the chart of the pair.
Disclosure: I am part of Trade Nation's Influencer program and receive a monthly fee for using their TradingView charts in my analysis.
❤️ Please, support our work with like & comment! ❤️

EURGBP: Short Trade with Entry/SL/TP
EURGBP
- Classic bearish formation
- Our team expects pullback
SUGGESTED TRADE:
Swing Trade
Short EURGBP
Entry - 0.8649
Sl - 0.8755
Tp - 0.8738
Our Risk - 1%
Start protection of your profits from lower levels
Disclosure: I am part of Trade Nation's Influencer program and receive a monthly fee for using their TradingView charts in my analysis.
❤️ Please, support our work with like & comment! ❤️

Bitcoin can Continue to Decline to Support LevelHello traders, I want share with you my opinion about Bitcoin. The market structure for Bitcoin has recently shifted to a bearish bias following a significant breakdown from its prior upward channel. After a complex consolidation within a triangle, the price of BTC made a final push to the highs near the 115600 seller zone before being strongly rejected, which led to the failure of the channel's support. This structural break initiated a new bearish phase, causing a sharp decline to a recent low of 111600. Currently, the asset is in a small consolidation, attempting a minor corrective bounce after the significant fall. In my mind, this consolidation is simply a pause before the next wave of selling pressure resumes. I expect that this small upward movement will soon be exhausted and that the price will continue its bearish movement downwards. A failure to produce a strong rally from these levels confirms that sellers remain in control of the market. Therefore, I have placed my TP for this trend-continuation scenario at the major 110000 support level. This target is a logical objective, as it represents the next significant area of historical support and aligns with the 110000 - 109500 buyer zone. Please share this idea with your friends and click Boost 🚀
Disclaimer: As part of ThinkMarkets’ Influencer Program, I am sponsored to share and publish their charts in my analysis.
GBP/USD - Sell side Liquidity Available (4H forecast) 🔥 GBP/USD – 4H Forecast 💷💵
Cable’s chart is serving us some spicy structure — let’s break it down 👇
🕰 Market Context
Price rejected hard from that RSL (Resistance Supply Level) at the top of the range.
We’ve since seen a BOS (Break of Structure) to the downside — bears flexing their muscles. 💪🐻
Market reacted cleanly from a daily demand zone earlier, but momentum is stalling.
📉 Bearish Flow
Clear shift in market structure (SHoF) confirmed.
We’re chilling inside a 4H supply zone, which already pushed price down once.
Internal range showing liquidity being swept → fuel for a possible continuation lower.
⚡ Key Levels
Support zones:
1.3400–1.3410 (extreme range support)
1.3350–1.3370 (internal range demand)
Resistance :
1.3500–1.3520 → sell-side zone of interest.
🎯 Forecast Path
Expect a reaction bounce into the 4H supply (1.3490–1.3520) 📈.
If supply holds, watch for continuation down toward 1.3350–1.3370 🕳.
Breaking below that → opens the door to 1.3150 strong support (next liquidity magnet).
📝 Trade Idea
Bias : Bearish until market proves otherwise.
Plan : Look for shorts on pullbacks into 1.3490–1.3520 zone.
Targets : 1.3400 → 1.3350 range.
Invalidation : Break & close above 1.3550 kills the bearish play.
📌 Summary : GBP/USD is in bearish flow after the RSL rejection & BOS. Supply zones are respected, liquidity is building below — shorts into demand are the play until 1.3550 breaks

USDCHF Will Fall! Short!
Please, check our technical outlook for USDCHF.
Time Frame: 12h
Current Trend: Bearish
Sentiment: Overbought (based on 7-period RSI)
Forecast: Bearish
The market is approaching a significant resistance area 0.795.
Due to the fact that we see a positive bearish reaction from the underlined area, I strongly believe that sellers will manage to push the price all the way down to 0.786 level.
P.S
Please, note that an oversold/overbought condition can last for a long time, and therefore being oversold/overbought doesn't mean a price rally will come soon, or at all.
Like and subscribe and comment my ideas if you enjoy them!

GBPUSD Will Go Down! Sell!
Please, check our technical outlook for GBPUSD.
Time Frame: 15m
Current Trend: Bearish
Sentiment: Overbought (based on 7-period RSI)
Forecast: Bearish
The market is trading around a solid horizontal structure 1.346.
The above observations make me that the market will inevitably achieve 1.345 level.
P.S
Overbought describes a period of time where there has been a significant and consistent upward move in price over a period of time without much pullback.
Like and subscribe and comment my ideas if you enjoy them!
