EURUSD: Bearish Forecast & Outlook
The price of EURUSD will most likely collapse soon enough, due to the supply beginning to exceed demand which we can see by looking at the chart of the pair.
Disclosure: I am part of Trade Nation's Influencer program and receive a monthly fee for using their TradingView charts in my analysis.
❤️ Please, support our work with like & comment! ❤️
Short!!!!

NZDCAD: Short Trade Explained
NZDCAD
- Classic bearish formation
- Our team expects fall
SUGGESTED TRADE:
Swing Trade
Sell NZDCAD
Entry Level - 0.8230
Sl - 0.8235
Tp - 0.8221
Our Risk - 1%
Start protection of your profits from lower levels
Disclosure: I am part of Trade Nation's Influencer program and receive a monthly fee for using their TradingView charts in my analysis.
❤️ Please, support our work with like & comment! ❤️

#024: Short Investment Opportunity on NZD/CHF
In recent days, NZD/CHF has shown a technical recovery after the late summer decline. However, the rebound stalled at a medium-term dynamic resistance line, coinciding with the main moving average, where the price began to show signs of exhaustion. Hello, I'm Andrea Russo, an independent Forex trader and prop trader with $200,000 in capital under management. Thank you in advance for your time.
The latest 8-hour candlesticks show upper shadows and declining volume, typical signs of a loss of buyer strength. On the intermarket front, the New Zealand dollar remains weakened by the RBNZ's more cautious outlook, while the Swiss franc continues to benefit from its safe-haven status amid global uncertainty.
Market sentiment remains unbalanced: most retail traders remain opposed to the prevailing trend, reinforcing the hypothesis that institutional pressure could foster further selling. Futures and options data also show a bearish bias, with order concentrations just below the current resistance area.
Expected scenario: an extension of the corrective move toward underlying support, likely confirmed in the next few candles. Any short-term spikes above recent levels should be interpreted as false breakouts designed to raise liquidity before a new bearish impulse.
In summary, NZD/CHF is at a crucial point: either the pullback leaves room for a resumption of the underlying downtrend, or the market will have to decisively break through the current resistance to invalidate the scenario.

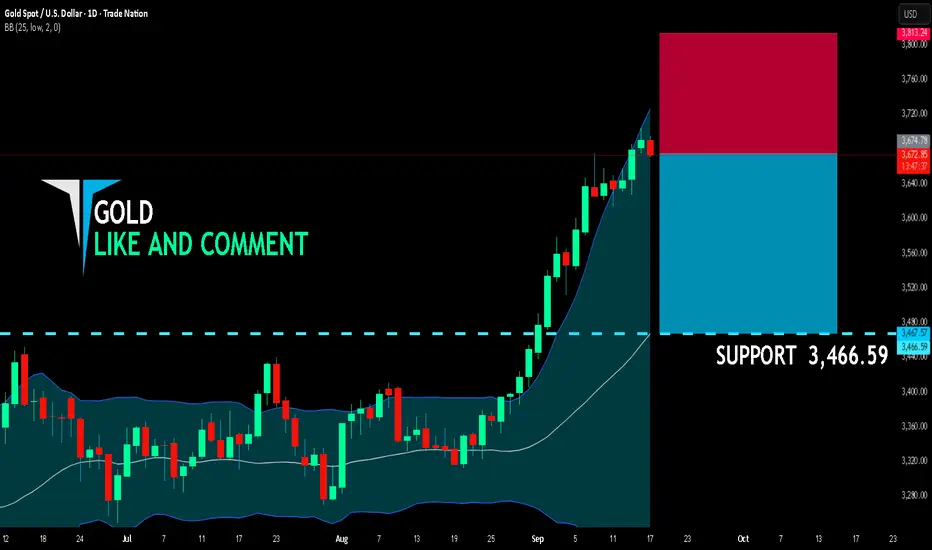
GOLD BEARISH BIAS RIGHT NOW| SHORT
GOLD SIGNAL
Trade Direction: short
Entry Level: 3,674.78
Target Level: 3,466.59
Stop Loss: 3,813.24
RISK PROFILE
Risk level: medium
Suggested risk: 1%
Timeframe: 1D
Disclosure: I am part of Trade Nation's Influencer program and receive a monthly fee for using their TradingView charts in my analysis.
✅LIKE AND COMMENT MY IDEAS✅
GBP/AUD BEST PLACE TO SELL FROM|SHORT
GBP/AUD SIGNAL
Trade Direction: short
Entry Level: 2.043
Target Level: 2.034
Stop Loss: 2.050
RISK PROFILE
Risk level: medium
Suggested risk: 1%
Timeframe: 3h
Disclosure: I am part of Trade Nation's Influencer program and receive a monthly fee for using their TradingView charts in my analysis.
✅LIKE AND COMMENT MY IDEAS✅

GBPJPY Will Go Lower! Short!
Here is our detailed technical review for GBPJPY.
Time Frame: 3h
Current Trend: Bearish
Sentiment: Overbought (based on 7-period RSI)
Forecast: Bearish
The market is testing a major horizontal structure 199.845.
Taking into consideration the structure & trend analysis, I believe that the market will reach 199.284 level soon.
P.S
Please, note that an oversold/overbought condition can last for a long time, and therefore being oversold/overbought doesn't mean a price rally will come soon, or at all.
Like and subscribe and comment my ideas if you enjoy them!

GBPUSD: Price Action & Swing Analysis
Our strategy, polished by years of trial and error has helped us identify what seems to be a great trading opportunity and we are here to share it with you as the time is ripe for us to sell GBPUSD.
Disclosure: I am part of Trade Nation's Influencer program and receive a monthly fee for using their TradingView charts in my analysis.
❤️ Please, support our work with like & comment! ❤️


EURJPY: Short Trading Opportunity
EURJPY
- Classic bearish formation
- Our team expects pullback
SUGGESTED TRADE:
Swing Trade
Short EURJPY
Entry - 173.72
Sl - 173.84
Tp - 173.44
Our Risk - 1%
Start protection of your profits from lower levels
Disclosure: I am part of Trade Nation's Influencer program and receive a monthly fee for using their TradingView charts in my analysis.
❤️ Please, support our work with like & comment! ❤️

EURNZD : Will Start Falling! Here is Why:
The recent price action on the EURNZD pair was keeping me on the fence, however, my bias is slowly but surely changing into the bearish one and I think we will see the price go down.
Disclosure: I am part of Trade Nation's Influencer program and receive a monthly fee for using their TradingView charts in my analysis.
❤️ Please, support our work with like & comment! ❤️

EURUSD Trading Opportunity! SELL!
My dear followers,
I analysed this chart on EURUSD and concluded the following:
The market is trading on 1.1809 pivot level.
Bias - Bearish
Technical Indicators: Both Super Trend & Pivot HL indicate a highly probable Bearish continuation.
Target - 1.1749
About Used Indicators:
A super-trend indicator is plotted on either above or below the closing price to signal a buy or sell. The indicator changes color, based on whether or not you should be buying. If the super-trend indicator moves below the closing price, the indicator turns green, and it signals an entry point or points to buy.
Disclosure: I am part of Trade Nation's Influencer program and receive a monthly fee for using their TradingView charts in my analysis.
———————————
WISH YOU ALL LUCK

SILVER BEARS WILL DOMINATE THE MARKET|SHORT
SILVER SIGNAL
Trade Direction: short
Entry Level: 4,275.6
Target Level: 4,185.4
Stop Loss: 4,335.0
RISK PROFILE
Risk level: medium
Suggested risk: 1%
Timeframe: 3h
Disclosure: I am part of Trade Nation's Influencer program and receive a monthly fee for using their TradingView charts in my analysis.
✅LIKE AND COMMENT MY IDEAS✅

EUR/NZD SENDS CLEAR BEARISH SIGNALS|SHORT
EUR/NZD SIGNAL
Trade Direction: short
Entry Level: 1.972
Target Level: 1.961
Stop Loss: 1.979
RISK PROFILE
Risk level: medium
Suggested risk: 1%
Timeframe: 3h
Disclosure: I am part of Trade Nation's Influencer program and receive a monthly fee for using their TradingView charts in my analysis.
✅LIKE AND COMMENT MY IDEAS✅

EUR/CAD SELLERS WILL DOMINATE THE MARKET|SHORT
Hello, Friends!
We are now examining the EUR/CAD pair and we can see that the pair is going up locally while also being in a uptrend on the 1W TF. But there is also a powerful signal from the BB upper band being nearby, indicating that the pair is overbought so we can go short from the resistance line above and a target at 1.597 level.
Disclosure: I am part of Trade Nation's Influencer program and receive a monthly fee for using their TradingView charts in my analysis.
✅LIKE AND COMMENT MY IDEAS✅

USDJPY Is Bearish! Sell!
Here is our detailed technical review for USDJPY.
Time Frame: 1D
Current Trend: Bearish
Sentiment: Overbought (based on 7-period RSI)
Forecast: Bearish
The market is on a crucial zone of supply 146.990.
The above-mentioned technicals clearly indicate the dominance of sellers on the market. I recommend shorting the instrument, aiming at 144.781 level.
P.S
Overbought describes a period of time where there has been a significant and consistent upward move in price over a period of time without much pullback.
Like and subscribe and comment my ideas if you enjoy them!

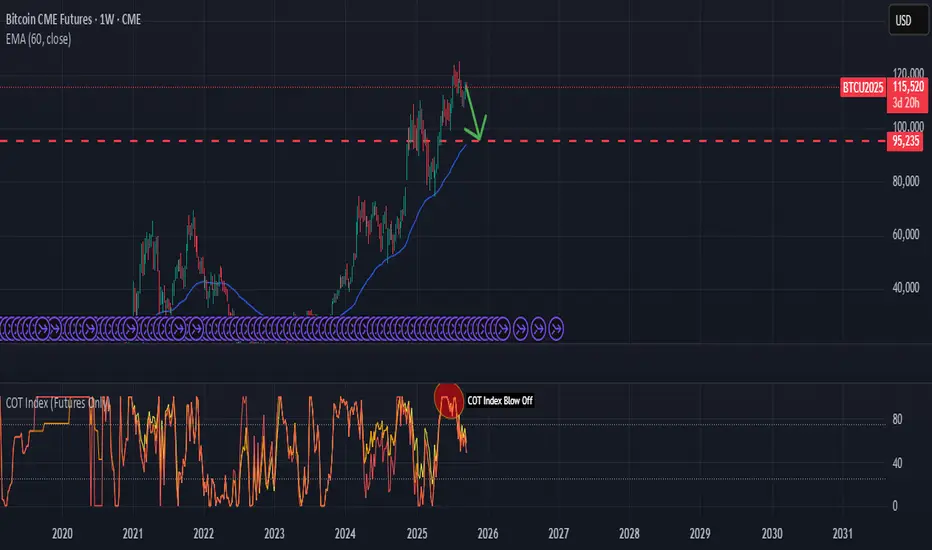
Bitcoin Blow-Off TopBitcoin is showing signs of exhaustion after a strong rally into the $120k region. On the weekly timeframe, several signals point toward a potential corrective leg lower:
📊 Key Technicals
Major Supply Zone: $115k–$120k area has acted as resistance, with sellers defending this level.
Trend Structure: Price has broken momentum after the blow-off move and is now trading below recent highs.
EMA Support: Price is extended above the EMA 60 (94k), leaving room for mean reversion.
COT Data: Commercials are heavily net short with a COT Index blow-off signal, indicating distribution from strong hands to weak hands.
🎯 Trade Thesis
The risk-reward favors the short side from current levels.
Initial downside target sits at the $95k region (prior resistance turned support + EMA alignment).
A break of that level could open the door toward the $80k handle in the medium term.
📌 Plan
Entry: 114k–116k
Stop: Above 120k
Targets:
TP1: 95k
TP2: 80k
💡 This setup combines market structure, supply zone rejection, and institutional positioning via COT. The technical picture suggests Bitcoin is vulnerable to a deeper pullback before any further sustainable rally.