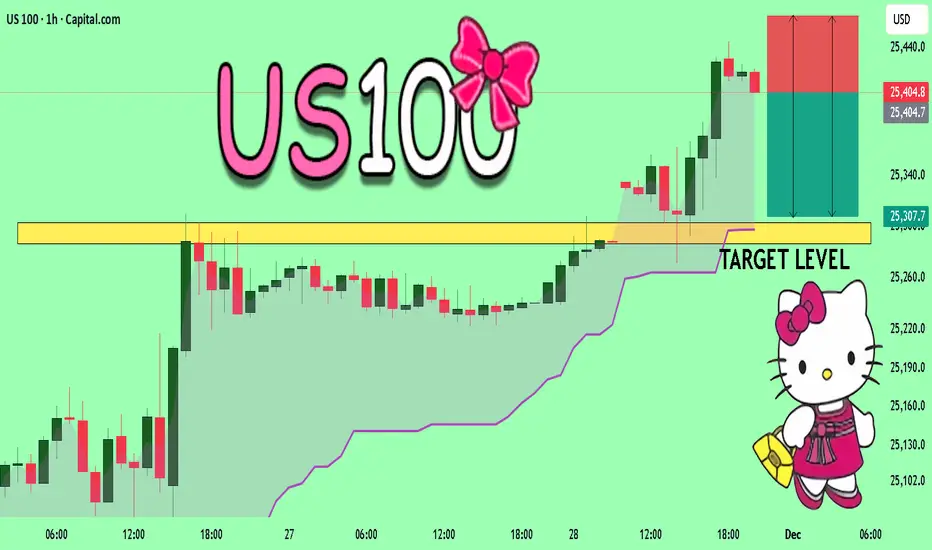
US100: Short Signal Explained
US100
- Classic bearish pattern
- Our team expects retracement
SUGGESTED TRADE:
Swing Trade
Sell US100
Entry - 25404
Stop - 25436
Take - 25348
Our Risk - 1%
Start protection of your profits from lower levels
Disclosure: I am part of Trade Nation's Influencer program and receive a monthly fee for using their TradingView charts in my analysis.
❤️ Please, support our work with like & comment! ❤️
Short!!!!

QQQ: Market of Sellers
Looking at the chart of QQQ right now we are seeing some interesting price action on the lower timeframes. Thus a local move down seems to be quite likely.
Disclosure: I am part of Trade Nation's Influencer program and receive a monthly fee for using their TradingView charts in my analysis.
❤️ Please, support our work with like & comment! ❤️

APPLE The Target Is DOWN! SELL!
My dear subscribers,
This is my opinion on the APPLE next move:
The instrument tests an important psychological level 278.82
Bias - Bearish
Technical Indicators: Supper Trend gives a precise Bearish signal, while Pivot Point HL predicts price changes and potential reversals in the market.
Target - 274.28
About Used Indicators:
On the subsequent day, trading above the pivot point is thought to indicate ongoing bullish sentiment, while trading below the pivot point indicates bearish sentiment.
Disclosure: I am part of Trade Nation's Influencer program and receive a monthly fee for using their TradingView charts in my analysis.
———————————
WISH YOU ALL LUCK

SPY Buyers In Panic! SELL!
My dear followers,
This is my opinion on the SPY next move:
The asset is approaching an important pivot point 683.34
Bias - Bearish
Safe Stop Loss - 688.64
Technical Indicators: Supper Trend generates a clear short signal while Pivot Point HL is currently determining the overall Bearish trend of the market.
Goal - 674.67
About Used Indicators:
For more efficient signals, super-trend is used in combination with other indicators like Pivot Points.
Disclosure: I am part of Trade Nation's Influencer program and receive a monthly fee for using their TradingView charts in my analysis.
———————————
WISH YOU ALL LUCK

SILVER Massive Short! SELL!
My dear friends,
Please, find my technical outlook for SILVER below:
The price is coiling around a solid key level - 56.402
Bias - Bearish
Technical Indicators: Pivot Points High anticipates a potential price reversal.
Super trend shows a clear sell, giving a perfect indicators' convergence.
Goal - 54.067
About Used Indicators:
The pivot point itself is simply the average of the high, low and closing prices from the previous trading day.
Disclosure: I am part of Trade Nation's Influencer program and receive a monthly fee for using their TradingView charts in my analysis.
———————————
WISH YOU ALL LUCK

NG1! SENDS CLEAR BEARISH SIGNALS|SHORT
NG1! SIGNAL
Trade Direction: short
Entry Level: 4.849
Target Level: 4.149
Stop Loss: 5.315
RISK PROFILE
Risk level: medium
Suggested risk: 1%
Timeframe: 1D
Disclosure: I am part of Trade Nation's Influencer program and receive a monthly fee for using their TradingView charts in my analysis.
✅LIKE AND COMMENT MY IDEAS✅

AUD/USD BEARS ARE GAINING STRENGTH|SHORT
Hello, Friends!
We are now examining the AUD/USD pair and we can see that the pair is going up locally while also being in a uptrend on the 1W TF. But there is also a powerful signal from the BB upper band being nearby, indicating that the pair is overbought so we can go short from the resistance line above and a target at 0.649 level.
Disclosure: I am part of Trade Nation's Influencer program and receive a monthly fee for using their TradingView charts in my analysis.
✅LIKE AND COMMENT MY IDEAS✅

EURUSD Downside Outlook: Price Eyes Retest of 1.1540 Buyer ZoneHello traders! Here’s my technical outlook on EUR/USD based on the current market structure. After testing the Seller Zone near 1.16000–1.16200, the price once again faced rejection, forming a fake breakout around the descending Resistance Line. This confirms that sellers are still defending this area and keeping the pair inside a broader bearish structure. From there, EUR/USD pulled back toward the Buyer Zone, located between 1.15400–1.15000, which has acted as a reliable support area multiple times. The market is now moving inside a corrective pattern, showing weakening bullish momentum as it approaches support. As long as the pair trades below the Seller Zone and the descending trendline, bearish pressure remains dominant. The chart suggests a likely continuation toward the TP1 target at 1.15400, where buyers previously stepped in and produced notable recoveries. A clean bounce from this zone may trigger another short-term bullish correction — but without a breakout above 1.16000, any upside is likely to remain limited. A breakdown below 1.15400 could open the way for deeper declines toward lower support levels, while a confirmed breakout above the Seller Zone would shift short-term sentiment. Please share this idea with your friends and click Boost 🚀

SILVER: Forecast & Trading Plan
Remember that we can not, and should not impose our will on the market but rather listen to its whims and make profit by following it. And thus shall be done today on the SILVER pair which is likely to be pushed down by the bears so we will sell!
Disclosure: I am part of Trade Nation's Influencer program and receive a monthly fee for using their TradingView charts in my analysis.
❤️ Please, support our work with like & comment! ❤️

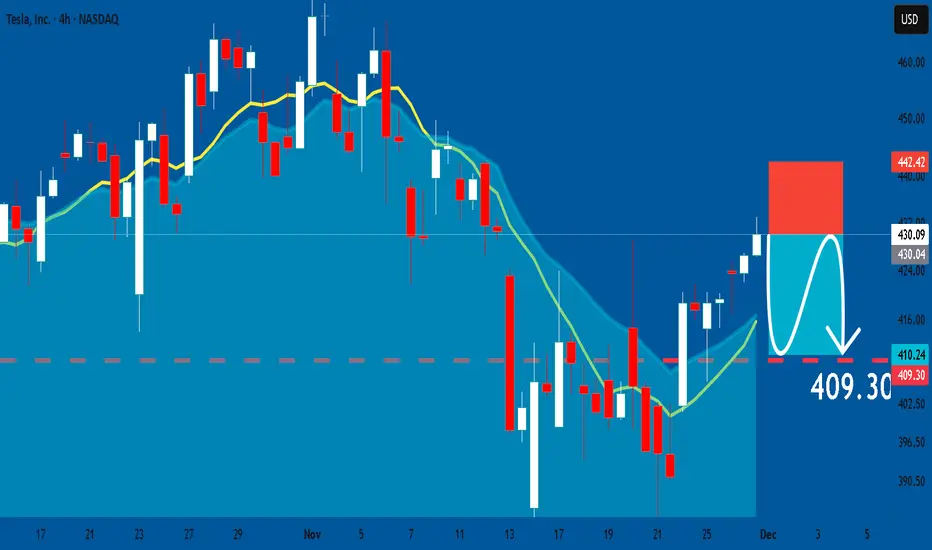
TESLA: Short Signal with Entry/SL/TP
TESLA
- Classic bearish setup
- Our team expects bearish continuation
SUGGESTED TRADE:
Swing Trade
Short TESLA
Entry Point - 430.09
Stop Loss - 442.42
Take Profit - 409.30
Our Risk - 1%
Start protection of your profits from lower levels
Disclosure: I am part of Trade Nation's Influencer program and receive a monthly fee for using their TradingView charts in my analysis.
❤️ Please, support our work with like & comment! ❤️
SPY: Will Keep Falling! Here is Why:
Balance of buyers and sellers on the SPY pair, that is best felt when all the timeframes are analyzed properly is shifting in favor of the sellers, therefore is it only natural that we go short on the pair.
Disclosure: I am part of Trade Nation's Influencer program and receive a monthly fee for using their TradingView charts in my analysis.
❤️ Please, support our work with like & comment! ❤️

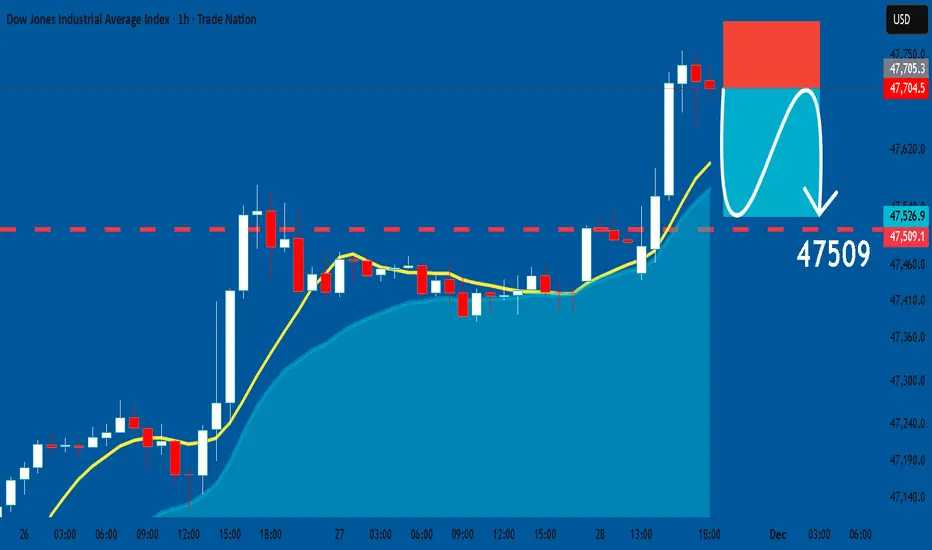
US30: Short Trade with Entry/SL/TP
US30
- Classic bearish formation
- Our team expects fall
SUGGESTED TRADE:
Swing Trade
Sell US30
Entry Level - 47705
Sl - 47798
Tp - 47509
Our Risk - 1%
Start protection of your profits from lower levels
Disclosure: I am part of Trade Nation's Influencer program and receive a monthly fee for using their TradingView charts in my analysis.
❤️ Please, support our work with like & comment! ❤️
US100 Technical Analysis! SELL!
My dear followers,
I analysed this chart on US100 and concluded the following:
The market is trading on 25404 pivot level.
Bias - Bearish
Technical Indicators: Both Super Trend & Pivot HL indicate a highly probable Bearish continuation.
Target - 25303
Safe Stop Loss - 25465
About Used Indicators:
A super-trend indicator is plotted on either above or below the closing price to signal a buy or sell. The indicator changes color, based on whether or not you should be buying. If the super-trend indicator moves below the closing price, the indicator turns green, and it signals an entry point or points to buy.
Disclosure: I am part of Trade Nation's Influencer program and receive a monthly fee for using their TradingView charts in my analysis.
———————————
WISH YOU ALL LUCK
EURUSD A Fall Expected! SELL!
My dear subscribers,
EURUSD looks like it will make a good move, and here are the details:
The market is trading on 1.1596 pivot level.
Bias - Bearish
Technical Indicators: Both Super Trend & Pivot HL indicate a highly probable Bearish continuation.
Target - 1.1559
About Used Indicators:
The average true range (ATR) plays an important role in 'Supertrend' as the indicator uses ATR to calculate its value. The ATR indicator signals the degree of price volatility.
Disclosure: I am part of Trade Nation's Influencer program and receive a monthly fee for using their TradingView charts in my analysis.
———————————
WISH YOU ALL LUCK

QQQ Trading Opportunity! SELL!
My dear friends,
QQQlooks like it will make a good move, and here are the details:
The market is trading on 619.15 pivot level.
Bias - Bearish
Technical Indicators: Supper Trend generates a clear short signal while Pivot Point HL is currently determining the overall Bearish trend of the market.
Goal - 609.75
Recommended Stop Loss - 623.82
About Used Indicators:
Pivot points are a great way to identify areas of support and resistance, but they work best when combined with other kinds of technical analysis
Disclosure: I am part of Trade Nation's Influencer program and receive a monthly fee for using their TradingView charts in my analysis.
———————————
WISH YOU ALL LUCK

AAPL SELLERS WILL DOMINATE THE MARKET|SHORT
AAPL SIGNAL
Trade Direction: short
Entry Level: 278.86
Target Level: 262.87
Stop Loss: 289.53
RISK PROFILE
Risk level: medium
Suggested risk: 1%
Timeframe: 6h
Disclosure: I am part of Trade Nation's Influencer program and receive a monthly fee for using their TradingView charts in my analysis.
✅LIKE AND COMMENT MY IDEAS✅

NZD/USD BEARISH BIAS RIGHT NOW| SHORT
Hello, Friends!
The BB upper band is nearby so NZD-USD is in the overbought territory. Thus, despite the uptrend on the 1W timeframe I think that we will see a bearish reaction from the resistance line above and a move down towards the target at around 0.554.
Disclosure: I am part of Trade Nation's Influencer program and receive a monthly fee for using their TradingView charts in my analysis.
✅LIKE AND COMMENT MY IDEAS✅

GBP/USD BEST PLACE TO SELL FROM|SHORT
Hello, Friends!
Previous week’s green candle means that for us the GBP/USD pair is in the uptrend. And the current movement leg was also up but the resistance line will be hit soon and upper BB band proximity will signal an overbought condition so we will go for a counter-trend short trade with the target being at 1.297.
Disclosure: I am part of Trade Nation's Influencer program and receive a monthly fee for using their TradingView charts in my analysis.
✅LIKE AND COMMENT MY IDEAS✅

EURCHF Is Going Down! Short!
Please, check our technical outlook for EURCHF.
Time Frame: 4h
Current Trend: Bearish
Sentiment: Overbought (based on 7-period RSI)
Forecast: Bearish
The market is approaching a significant resistance area 0.932.
Due to the fact that we see a positive bearish reaction from the underlined area, I strongly believe that sellers will manage to push the price all the way down to 0.929 level.
P.S
We determine oversold/overbought condition with RSI indicator.
When it drops below 30 - the market is considered to be oversold.
When it bounces above 70 - the market is considered to be overbought.
Like and subscribe and comment my ideas if you enjoy them!

RESOLV LAST UPDATE FULLTARGETHello friends 😍
I hope you are well 👌😊
💁♂️ First of all, thank you for clicking the "boost button" to give me a thumbs up. ❤️
💁♂️ Let's go for last update on the RESOLV - USDT cryptocurrency
💁♂️ The RESOLV cryptocurrency also reached its last short-term target and fell 67% in a short time. 🔥
🤔 Did you use this analysis?
😊 Share your comments with me
⚠️The analysis may not reach the final target, so at each target, if you make a good profit and see signs of a trend change, you can exit the trade or manage your capital.
⚠️ None of the analysis is a recommendation to buy or sell, but simply my personal opinions on the charts. You can use the charts and choose any that interest you and take a position if you wish.
To support me, I would appreciate it if you boost the analysis and share it with your friends so that I can analyze it with more energy for you, my dears. Thank you all. 💖

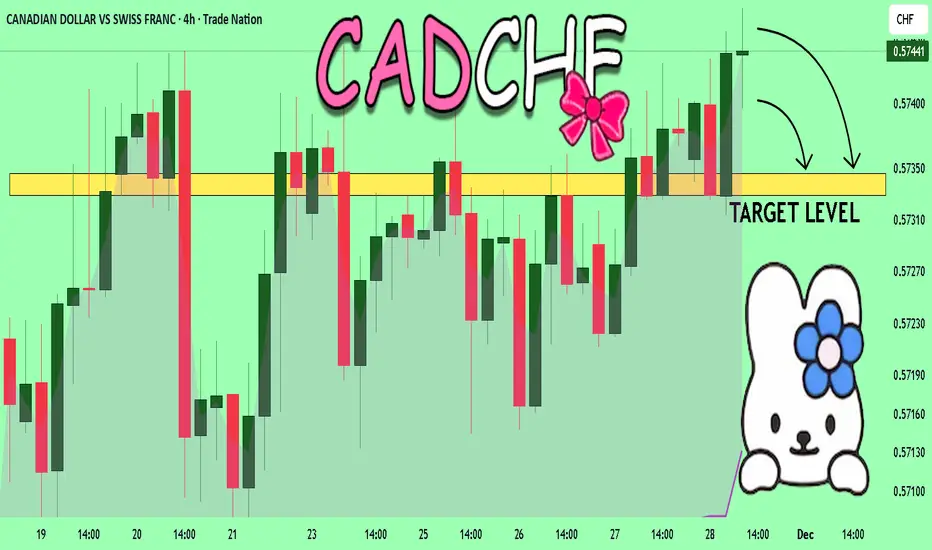
CADCHF What Next? SELL!
My dear friends,
Please, find my technical outlook for CADCHF below:
The instrument tests an important psychological level 0.5744
Bias - Bearish
Technical Indicators: Supper Trend gives a precise Bearish signal, while Pivot Point HL predicts price changes and potential reversals in the market.
Target - 0.5734
About Used Indicators:
Super-trend indicator is more useful in trending markets where there are clear uptrends and downtrends in price.
Disclosure: I am part of Trade Nation's Influencer program and receive a monthly fee for using their TradingView charts in my analysis.
———————————
WISH YOU ALL LUCK
USDCAD Potential DownsidesHey Traders, in today's trading session we are monitoring USDCAD for a selling opportunity around 1.30600 zone, USDCAD is trading in a downtrend and currently is in a correction phase in which it is approaching the trend at 1.30600 support and resistance area.
Trade safe, Joe.

GOLD BEARS ARE STRONG HERE|SHORT
GOLD SIGNAL
Trade Direction: short
Entry Level: 4,173.52
Target Level: 3,864.42
Stop Loss: 4,378.26
RISK PROFILE
Risk level: medium
Suggested risk: 1%
Timeframe: 1D
Disclosure: I am part of Trade Nation's Influencer program and receive a monthly fee for using their TradingView charts in my analysis.
✅LIKE AND COMMENT MY IDEAS✅
