XAUUSD (GOLD) – 4-Hour Timeframe Tradertilki AnalysisGuys,
I have prepared a XAUUSD-Gold analysis for you on the 4-hour timeframe.
My friends, the levels of 4657.0 and 4599.0 are the best buy entry points.
When price reaches these levels, I will definitely open a buy position and aim for the following targets:
My targets:
1st Target: 4690.0
2nd Target: 4730.0
3rd Target: 4790.0
My friends, since the U.S. president has recently imposed tariffs on Europe, there is currently strong buying volume in XAUUSD-Gold. From a fundamental perspective, this is the biggest reason for gold’s upward movement.
NOTE – Since the U.S. president has not lifted these tariffs regarding Greenland and has opened a trade war against European countries, XAUUSD-Gold may rise even from these levels and reach my 3 targets.
My friends, I share these analyses thanks to each like I receive from you. Your likes increase my motivation and encourage me to support you in this way.🙏
Thank you to all my friends who support me with their likes.❤️
Short-long

ETH Is Holding the Key Support — Break Higher or Deeper PullbackOn the ETHUSD H1 timeframe, price is currently in a post-impulse consolidation phase following a strong bullish expansion. The impulsive leg upward created a clear market imbalance, after which ETH pulled back and is now reacting precisely at the former breakout zone around 3,280–3,290, an area that previously acted as resistance and has now flipped into structural support. This behavior is technically healthy and fully aligned with trend continuation dynamics.
From a market structure perspective, the overall trend remains bullish as long as price continues to defend this key support. The recent rejection from higher levels appears corrective rather than impulsive, suggesting sellers are taking profit while buyers are absorbing supply. The moving average beneath price is rising and converging into the same support area, reinforcing this zone as a high-probability decision point.
Looking ahead, there are two clear scenarios. Primary bullish scenario: if ETH holds above the 3,280 support and forms a higher low, price is likely to rotate higher toward 3,397 → 3,433 → 3,475, continuing the broader uptrend. Alternative scenario: a clean breakdown below 3,280 would signal a loss of short-term structure, opening the door for a deeper retracement toward the 3,180 demand zone, where buyers may step back in. Until that breakdown occurs, the bias remains bullish with pullbacks viewed as corrective, not reversal driven.

GOOGLE WHERE THE MONEY IS### 🚨 GOOG Technical Analysis: Is Google Ready to Blast Off in 2026? 🚀
Hey traders! As of **January 4, 2026**, Alphabet (GOOG) sits at **$315.32** (up ~0.48% recently), fresh off a monster **65% rally in 2025** – its best year since 2009. Your TradingView chart nailed the long-term uptrend perfectly: from 2022 lows around $80-100, through a sharp 2025 dip, to new highs near $328. That green ascending trendline is pure gold, projecting toward **$400+** by 2027 if bulls stay in control.
THAT MEANS, IF YOU POSITION WELL, ARE PATIENT, FOLLOW TRENDS AND INDICATORS, and time it correctly (Which is difficult, meaning watch the numbers and indicators to time the move), you can ride the down wave, into the up wave long. AND MANY TRADES ALONG THE WAY!! This means there is a LOT of money for well placed trades.
But is this the calm before another moonshot... or a sneaky top? Let's break it down **clearly and step-by-step** – no fluff, just actionable insights to hook you in and keep you reading.
#### 1. **Current Price Snapshot** (As of Jan 4, 2026)
- **Price**: $315.32
- **Recent Range**: High ~$328 (Nov 2025), Low ~$310
- **52-Week Range**: ~$143 to $329
- **Market Mood**: Neutral sentiment, but AI hype is strong after 2025's blowout performance.
#### 2. **The Big Trend: Bullish Ascent Intact**
- **Primary Trend**: Strong uptrend since 2022 bear market bottom.
- **Key Driver**: That green ascending support line (from ~$83 in 2022) has held every major dip, including the 2025 pullback to ~$156-210.
- **Current Status**: Price hugging resistance at ~$315-322. Break above = acceleration; hold = consolidation.
- **Projection Match**: Your chart's line points to ~$380-400 by mid-2027 – aligns with optimistic analyst views if AI (Gemini, Cloud) delivers.
#### 3. **Critical Support & Resistance Levels** (Watch These Like a Hawk)
- **Immediate Resistance**: $322 (recent high) → $328-329 (all-time high)
- **Key Resistance**: $340-350 (next upside targets on breakout)
- **Immediate Support**: $310 → Green trendline (~$300 near-term)
- **Major Supports**: $262 (38.2% Fib), $220-240 (prior consolidation), $181 (deeper retrace)
- **Breakdown Risk**: Below $290-300 trendline = potential drop to $262 or lower (bear warning!).
#### 4. **Chart Patterns & Signals**
- **Overall Structure**: Series of higher highs/lows with bullish flags and V-bottom reversals (e.g., 2025 dip).
- **Recent Action**: Zigzag consolidation near highs – possible ascending triangle forming.
- **Earnings Markers**: Mostly green "E" beats in 2025 fueled rallies; watch Feb 3, 2026 report for the next catalyst.
- **Volume Note**: Low volume on recent moves – needs spike for conviction breakout.
#### 5. **Bull Case: Why GOOG Could YOLO to $400+**
- AI dominance (Gemini, Cloud growth >30%)
- Strong fundamentals: Search engagement up, massive Cloud backlog
- Analyst Consensus: Median target ~$330-340 (up 5-8% from here), some as high as $385-400
- Momentum: Best Mag7 performer in 2025 – carryover potential huge
#### 6. **Bear Case: Risks That Could Trigger a Crash Scenario**
- Heavy 2026 capex (~$114B on AI/data centers) pressuring margins
- Antitrust heat & competition (e.g., OpenAI, Bing threats)
- Valuation: ~30x forward P/E – rich if growth slows
- Technical Risk: Failure at $329 high = double-top, potential pullback to $280-300
#### 7. **Quick Trade Ideas**
- **Bullish Play**: Buy dip to green trendline (~$300-310), target $340-350. Stop below $290.
- **Bearish Play**: Short on failed breakout above $329, target $262.
- **Safe Play**: Wait for volume breakout – add alerts on TradingView!
This chart screams **uptrend with upside bias**, but respect the resistance – 2026 could be epic if AI pays off, or choppy if capex bites. What's your take: Moon or correction? Drop your thoughts or another chart – let's discuss! 📈🔥
Ghost feed may not be accurate, please only use as a projected guideline.
*(Not financial advice – DYOR, markets can moon or crater anytime.)*

BITCOIN STUCK in Accumulation ZoneBITSTAMP:BTCUSD remains in a range reaccumulation structure after rejecting the upper 89,800–90,300 resistance zone. The sharp impulse was followed by a pullback into the 87,000–87,500 support, where buyers are defending and price is stabilizing above the EMA cluster. Structure favors consolidation and rotation rather than immediate trend reversal.
As long as support holds, this looks like rebalancing before the next expansion, not distribution.
Resistance: 89,800 – 90,300
Support: 87,000 – 87,500
Range focus: 87,000 – 90,300
➡️ Primary: hold 87k → higher lows → rotation back toward 89.5k–90k.
⚠️ Risk: clean loss of 87k → deeper pullback toward the lower demand zone.

Gold has been moving in a strong bullish channel, but it is now Technical View:
Resistance Zone: The price is climbing towards a significant supply area between 4540.00 and 4633.00 (marked in red).
Channel Top: This resistance zone aligns perfectly with the upper boundary of the ascending channel.
Expectation: As price hits this upper structure, there is a high probability of a rejection or a pullback. I am watching for bearish reactions from this level to potentially correct downwards (as shown by the arrows).
Trade with care and manage your risk.
OANDA:XAUUSD FOREXCOM:XAUUSD ICMARKETS:XAUUSD SAXO:XAUUSD TVC:GOLD FOREXCOM:GOLD

Nasdaq nearing critical balanceIn November, we observed a Hagopian pattern - the market failed to reach the centerline despite the high probability of doing so (see weekly chart left). MACD-V is in divergence since then. A sign to be especially cautious.
This led to the current rally lasting more than ten days without a single close below a prior low. It seems the Plunge Protection Team may be at work.
In any case, we are now approaching the yellow centerline, the market’s point of balance. From there, the market will determine whether we push once more above the yellow centerline toward the white U-MLH, or turn downward, producing a second Hagopian and falling back toward the white centerline.
If the second scenario unfolds, the path toward significantly lower prices would be wide open.
Let’s see what we get for Christmas…

BITCOIN – THE TIDES ARE TURNING Traders,
On November 5 I mapped out a scenario where Bitcoin would push into 107k to 108k and then decline to 98k first and 89k second.
This entire scenario has now played out perfectly to the pixel. We swept 108k, we dumped to 98k, and then we flushed into 89k. Where I expected price to retrace from exactly this level: $88.912
So the real question now is simple. What now? Do we break lower, or do we go up?
Let’s break Bitcoin down cleanly, without bias, and only by reading structure, levels, and order flow.
Levels, Structure and Order Flow
AVWAP at the core of the structure
Bitcoin is currently trading right near the AVWAP from the 06 August 24 anchor. This is the blue line on your chart and the exact level is 90.881. This anchor began with a large volume impulse.
When heavy volume kicks off a leg, the AVWAP from that point becomes a core reference level for the entire future auction. We are now sitting right on top of it, which is exactly where you would expect absorption or a strong reaction.
The market is basically deciding if this AVWAP will hold or break.
AB=CD completion
The full AB=CD measured move has completed exactly into the AVWAP zone. This is a clean harmonic completion and adds confluence to why price reacted here. AB=CD means the downside leg is symmetrical and usually marks exhaustion inside a trend.
Fixed Range Volume Profile
Using a FRVP from the start of the current HTF auction (07 April until now), we see price wicked directly into the LVN that sits inside the weekly FVG. This area had imbalance and low participation. A wick into an LVN inside an FVG often means that the inefficiency is now cleaned and the auction has reached completion for that side of the range.
Wedge breakout
Bitcoin technically broke out of the falling wedge, but the breakout does not look clean.
We are outside the wedge, but momentum on the breakout is weak. True confirmation would come if price re-enters the wedge from the outside and climbs back through the wedge body.
Re-entering the wedge tells you that the breakdown was liquidity and not a structural continuation. If we reclaim it, upside targets become more likely.
Order Flow – What the data shows
Spot and Futures CVD
Across the 15m, 30m and 1h charts, Spot CVD is forming a bullish divergence. Price keeps making lower lows, but Spot CVD is holding higher. This shows that spot buyers are stepping in at the lows and absorbing sell pressure.
Futures CVD on both stablecoin margined and coin margined contracts continues to push lower.
Price is not following these lower lows. This creates hidden bullish divergence and confirms that aggressive sellers are hitting the market while limit buyers are absorbing the pressure.
This is a classic sign of absorption. Selling continues, but the market is refusing to break lower with the same intensity.
Open Interest – A shift
Earlier in the dump, Open Interest was falling. This means positions were being closed.
Most of this was shorts taking profit or exiting the move. When OI drops during a downtrend, continuation becomes harder because the move loses fuel.
Near the end of the screenshots, there is a shift. Both stablecoin margined and coin margined OI start to rise again.
This rise in OI happens while:
CVD continues to make lower lows
Price stops making new lows
Price begins to stabilize
This tells us that new positions are being opened at the lows. Given the CVD behavior, most of these are new shorts entering the market.
When new shorts enter and price does not break, the probability of those shorts becoming trapped increases. If buyers step in, this setup often leads to a short squeeze.
This is how reversals form in a controlled market.
Funding rate – Binance
Funding is positive but very small. This means there is no extreme long pressure. There is no overcrowding on the long side. The market is not stretched. With fresh shorts entering at the lows and funding staying neutral, the market can turn quickly if support holds.
What this means
The combination of:
Spot CVD divergence
Hidden bullish divergence on futures CVD
Rising Open Interest at the lows
Neutral funding
Price refusing to break down - So price needs to hold.
shows that the market is absorbing aggressive selling at a key level. If buyers defend the current level, this can force newly opened shorts to cover, which would fuel the next move up.
Targets
109k
This is the first upside objective.
There is a CME ETH gap resting at this level and gaps of this type tend to get filled.
109k also aligns with the 1.113 Fibonacci extension of the latest wave.
This makes it the first logical level if price continues to hold the AVWAP and absorb selling pressure.
112k
The next major level is 112k.
This area contains single prints on CME and matches an AVWAP level on the BTC CME chart.
112k also lines up with the 1.272 extension of the wave.
From a Fibonacci rotation perspective, 1.272 is the next stop after 1.113 and often acts as a mid-cycle continuation target.
118.800
The final target sits at 118.800.
This is the full 1.618 extension of the wave and mathematically completes the auction.
If the market rotates from AVWAP support, this level becomes the natural endpoint of the move.
As long as price continues to hold the AVWAP at 90.881 and the market keeps absorbing futures selling, all three upside targets remain in play.
Invalidation
The structure changes only if price breaks below 88k. A clean drop under 88k opens the door for the next major high timeframe support at 85k.
85k carries strong confluence. It aligns with the 0.786 Fibonacci retracement on the HTF move and sits directly on a Point of Control zone within the Fixed Range Volume Profile.
Below that level, the auction shifts into a lower structure entirely.
TLDR
Bitcoin completed the downside scenario perfectly.
Price is now sitting directly on the AVWAP at 90.881.
AB=CD is complete.
LVN inside weekly FVG has been cleaned.
Futures CVD is still pressing lower but price is not. That is absorption.
But the key update is OI. OI was dropping earlier on the LTF, but now OI is rising again, and this is happening while CVD continues down and price holds steady.
That means new shorts are entering the market and getting absorbed.
If AVWAP holds, expect a bounce.
Targets:
109k
112k
118.8k
If 88k breaks, 85k is next.
--------
Abbreviation List
AVWAP
Anchored Volume Weighted Average Price. A dynamic support or resistance level based on volume since a chosen anchor.
AB=CD
A harmonic measured move where AB equals CD.
FRVP
Fixed Range Volume Profile. Shows where volume was traded inside a chosen range.
LVN
Low Volume Node. A low interest level where price often rejects strongly.
FVG
Fair Value Gap. An imbalance left by aggressive price moves.
CVD
Cumulative Volume Delta. Tracks buying vs selling pressure.
OI
Open Interest. The amount of open futures positions.
POC
Point of Control. Level with the highest traded volume.
--------
If you like this kind of analysis, drop a like and leave a comment. Everything here is shared for free so more people can cut through the noise and finally see what is actually happening under the surface. No hopium. No fear. Just real data, real structure, and real order flow.
The goal is simple. To help traders stop guessing and start understanding what the market is actually saying.
Stay sharp.
Stay objective.
And remember… the chart whispers long before it speaks.
- ThetaNomad

BTC the way on 89000🔍 What the chart is showing right now
1. Trend Bias:
Bearish Price is below EMA50 and EMA200 → structure still bearish.
Multiple lower highs and strong rejection from descending trendline.
Market is holding below major supply zones (100k–102k, 105k–107k, 109k–111k).
2. Current Area:
Demand reaction zone Price bounced from a blue demand block ~93.0k–94.5k.
Weak bounce so far — no strong volume or bullish displacement.
A lower-timeframe liquidity sweep happened at the bottom → short-term bullish correction possible.
3. Nearest resistance
First big sell zone: 97.8k–99.5k
If price reaches it, sellers will likely hit aggressively.

GBP/USD - Multi Timeframe Analysis GBP/USD – Top-Down Breakdown 🏦💷
WEEKLY 📆 (Big Boss View)
Price is chilling inside a large ascending channel, still respecting the long-term bullish structure.
We’ve tapped into that external sell-side liquidity (the grey zone) and reacted.
Structure still looks corrective, not impulsive.
As long as we hold that monthly demand support, GBP/USD looks like it wants a bigger upside swing toward the 1.3800+ zone 🏹.
Expectation: Sweep → Reversal → Push to the top of the range.
Weekly Bias :
🔻 Short-term weakness
🔺 Long-term bullish continuation (big swing wave 3 incoming)
DAILY 📅 (The Supervisor)
The daily structure is walking itself down in a corrective pullback, respecting the trendline from below.
We’re heading into the daily demand zone + lower swing range boundary.
Liquidity below has been taken previously but not fully mitigated — one more sweep is likely.
After that?
Big rocket-launch potential to form the next higher-timeframe leg up 🚀.
Daily Expectation:
➡️ Dip into daily demand
➡️ One more sweep
➡️ Then reversal toward 1.38
8H / 4H / Intraday (The Workers)
Inside a falling channel, clean bearish flow.
Price is tapping into small demand pockets, causing bounces — but not enough to break structure yet.
Clear BH (bearish high) + SH (swing high) levels show liquidity resting above.
Expect either:
A) Retrace to premium zone → Sell continuation
B) Flush into demand → Hard reversal
Intraday Bias:
Bearish until that higher-timeframe daily/weekly zone hits.
Overall Summary ⚡
GBP/USD is basically doing the classic play:
“Short-term bearish snack → Long-term bullish main meal.”
🍫➡️🥩
HTF (Weekly/Daily): Preparing for a major bullish leg
STF (8H/4H): Still bearish, likely to sweep lows before reversing
Key target on reversal: 1.3700 → 1.3800+

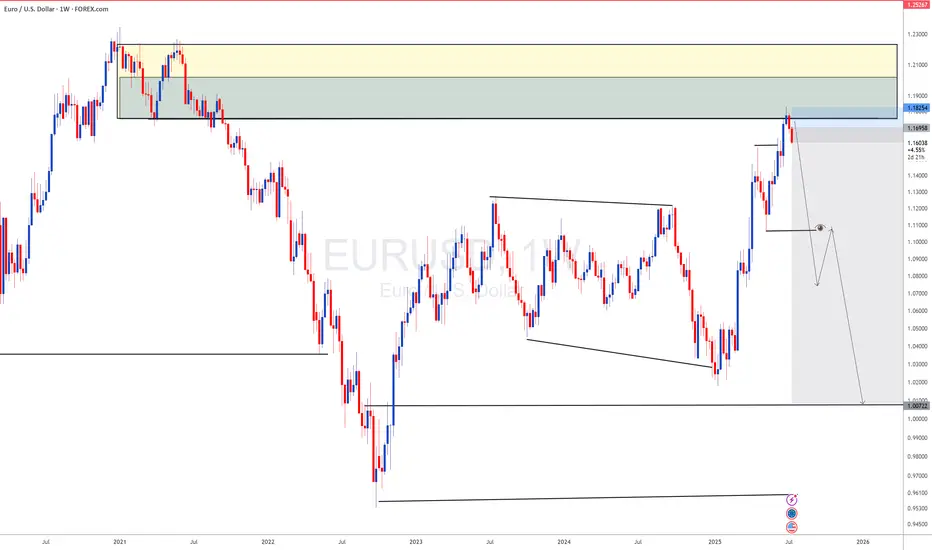
EUR/USD - Im still Bearish until HTF followsEUR/USD – 4H Outlook (HTF SMC Breakdown)
🟤 1. HTF Range & Macro Context
Price is still trading inside a large higher-time-frame bearish range, with the entire structure sitting below the previous major BSL that got taken earlier in the chart.
The massive orange zone at the bottom is your HTF demand range — the last big corrective area before the external sell-side at 1.13–1.14.
This zone has been tested, respected, and held strongly.
HTF takeaway:
👉 Market is still bearish overall, but short-term bullish from HTF demand.
🔶 2. Reaction From HTF Demand
Price dipped into the HTF demand block, tapped the 71% discount level, swept internal SSL, and then gave a clean BOS to the upside.
Inside that orange zone:
Strong rejection wick
Multiple BOS confirmations
Mitigation of IMB/FVG
Clean liquidity sweep
This gives bulls temporary control.
This is the origin of the current bullish leg.
⚪ 3. Current 4H Structure
Price is now working its way back toward the 4H supply zone (your grey box), which also aligns with:
A BSL sitting above
4H imbalance
Micro premium zone
Unmitigated distribution candles
We’re in a mid-range climb from HTF demand → into 4H supply.
4H view:
👉 Expect bullish continuation until supply is reached.
🎯 4. Key Levels To Watch
🟢 Upside Targets
4H Supply Zone → First reaction area
BSL above supply → Liquidity draw
If price breaks, next target → 1.1750 region
🟠 Downside Levels
Your marked arrow shows price may:
Tap into 4H supply
Reject
Either return back into HTF demand
Or create a higher low for continuation
Most probable based on your chart:
👉 Tap supply → pullback → continuation up
(as long as HTF demand holds)
🧭 5. Bias Going Forward
Short-term = Bullish
Macro = Still bearish but correcting
Flow = Bullish until 4H supply
Your chart implies a bullish path:
Liquidity above (BSL) is the next draw
Price is climbing cleanly
No weakness until supply is met
After hitting the grey zone:
📍 Look for rejection + change of character
OR
📍 Strong break + retest for bullish continuation
(depends on reaction)
🔥 Summary (Quick Version)
HTF demand respected beautifully
Price created BOS after SSL sweep → bullish
Now climbing to 4H supply
Expect a reaction there
If supply breaks → next leg to 1.17
If supply holds → pullback into mid-range or demand

Bitcoin TA and ALT coin TAHi guys,
I hope you enjoyed the video! Its going to be a very existing next 3 months!

BTCUSD – Last Chance to Go HigherOver the weekend, price found support just outside the white L-MLH. That’s where I previously mentioned the red Centerline — the target for the earlier short trade.
Now, however, price has jumped back into the fork. Tthis could be the last chance to break out of the down-sloping yellow fork to the upside.
P3 would be my next level to watch for support after the break of the red Centerline.

$LINK – PREMIUM PUMP, DISCOUNT DUMP? THE SQUEEZE SETUP EXPLAINEDLINK – PREMIUM PUMP, DISCOUNT DUMP? THE SQUEEZE SETUP EXPLAINED
Traders,
LINK — and likely the broader crypto market — is setting up for a premium squeeze that turns into a discount dump.
ANALYSIS
On Binance Perpetuals you can see longs piling in near $24 while price stalls → CVD pushes up, price doesn’t. That’s buying with no progress = bearish absorption with CVD non-confirmation. Check the data here ibb.co
Aggregated Spot CVD (all exchanges) is flat. No real spot demand → only leveraged longs propping up price. Check the data here ibb.co
Price is now inside the Golden Pocket retracement zone. High-probability reaction area where strong hands fade late longers.
Measuring swing low → swing high (06 Sep – 13 Sep), price is right at the Value Area High (VAH). This is the edge of acceptance.
Confluence: we’re also tagging the upper Anchored VWAP band (green line) from both the swing high and the swing low.
→ Why this matters: Anchored VWAP tracks the average cost basis of participants from a chosen pivot. When the swing low → high AVWAP band and the swing high → low AVWAP band overlap in the same zone, it creates double confluence: longs from the bottom see this as “expensive” and reduce risk, while shorts from the top defend their break-even. Historically, these overlaps act as strong rejection zones unless fresh spot demand breaks through.
MY TAKE
Expecting rejection at $24 and a move back toward $21 (blue AVWAP test). I think - based on data - that we might move even lower.
Setup = trapped longs at premium + no spot demand + strong confluence of VAH, Golden Pocket, and dual AVWAP resistance.
Invalidation = acceptance above $25 with spot CVD joining the move.

USD/CAD - Forecast🚨 USD/CAD – Key Levels in Play 🚨
🕰 Weekly View:
Price is trapped inside a 1.36 – 1.40 swing range.
Break above 1.40 → clean run into 1.44 – 1.46 supply.
Fail here → liquidity below 1.34 – 1.35 becomes the target.
📉 Daily Structure:
We’re moving inside a parallel channel, sitting mid-range at 1.38 – 1.39. Liquidity is building under 1.37 — sellers might want to grab that first.
⏱ 8H Play:
Rejection spotted at 1.38 – 1.385 supply.
➡️ Short-term pullback toward 1.37 demand looks likely.
➡️ If buyers defend that, we could see another push into 1.39 – 1.40.
📌 Outlook:
Short-term pullback 🔽 → Mid-term bullish if 1.37 holds.
Break under 1.37? Bears take control toward 1.35.
Follow for more

Long Term Btc PlanI can see BTC going to take 85k.
People think "Below 90k bull run is over"
Would cause extreme fear/panic in the markets if broken below 90k. basically reaching 85-86k would be cause just by paper hands at the end being scared out of their positions.
Currently Looking for bigger shorts and small longs only. Exception if BTC breaks above 118.5k and shows bullish signals.
Will look for reenter spot below 90/100k depends on situation.
Want to see Diamond Top playout on 4h, then break above it or reject from 786/886 fibb and enter big short to 105/90s.
The Long/Short Positions on chart is worth looking at, I have alerts near all entries/SL/Tp and even S/R.
I had a thought that next big crash might be caused by an exchange going tits up at near top, and I have intuition it might be MEXC.
NOT YOUR KEYS NOT YOUR ASSETS.

USD/JPY - Forecast 🕰 Weekly View
Price is ranging under 148–150 weekly resistance while holding above the 142–144 weekly demand zone. If demand continues to hold, we could see a push back toward the 156–158 target. A clean break below 142 would invalidate this outlook.
📉 Daily Structure
Major Resistance: 148–150 supply block
Major Support: 142–144 demand zone
Price is coiling between mid-range weak support and overhead resistance, building liquidity for the next move.
⏱ 8H Breakdown
On the 8H, price is capped under the descending trendline. Refined demand sits around 144–145. A sweep into this level could fuel the next bullish continuation. Breakout above 150 opens the road directly into 156–158.
🔎 Outlook
Short-term pullback still possible → but overall structure favors a mid-term bullish continuation targeting 156–158.
Bias: Short-term pullback → mid-term bullish.

18/08/25 Weekly OutlookLast weeks high: $124,475.68
Last weeks low: $116,828.03
Midpoint: $120,651.85
Another new ATH for BTC but are there signs of weakness beginning to show?
Last week Bitcoin hit a new ATH just shy of $124,500, a remarkable achievement but the reaction from that level to me is not a good one. Using the RSI indicator it is clear that on the daily time frame both the July top and now the most recent top form a bearish divergence. Higher time frame bearish divergences are strong trend reversal indicators. On the hour timeframe both tops also formed a local bearish divergence, to me this is a double sign of an exhausted rally.
This is not to say the end of the cycle is here by no means, what it does suggest is that the bulls are tired and a correction could be round the corner. From here I think logically the $111,000 & $108,000 levels could provide support this week on any pullback continuation. From a macro perspective we still have rate cuts to come next month, An ever growing M2 Global Money Supply to feed the market and a hungry institutional investor race to acquire digital assets. All this points towards the bullaun continuing but In my opinion after a cooling off period, after all August and September are famously bad months for BTC for returns.
Ethereum on the other hand continues to impress this a record $2.85B ETF net Inflows. $3.75B net inflows for digital assets as a whole. No break of ATH as yet but the momentum is certainly there. BTC will need to stand strong for ETH to push past $4,800.
This week I'm keeping a close eye on how BTC reacts to any pullbacks, judging market order flow to see if this is a shallow pullback or maybe a prolonged one that results in a rangebound environment.
FED chair Powell does speak this week so possible volatility should he announce anything significant.
Good luck this week everybody!

EURUSD as DXY s gaining momentum DXY has completed its long term downside now lets look for sell on EURUSD
DXY USD Dollar Bearish Short term, then bullishI am not a financial advisor. This is not meant to be and does not constitute financial, investment, trading, or any other types of advice or recommendation.

GBPJPY ForecastLooking long up to 200.00 levels then seeking bearish PA to test the June lows. This is only validated on bearish PA on H4 or Daily.

USDCAD RT of Supply Zone then ShortPrice has retraced back into a key supply zone just under the June High. We are now watching for strong bearish price action (PA) to confirm a potential short entry from this area.
Key Zone to Watch:
Supply Zone: 1.3756 – 1.3796
Optimistic stops can be placed above the zone if strong rejection occurs
Plan:
Seek bearish PA within the highlighted supply zone
Wait for confirmation via a bearish candle close
Enter below the trigger candle once setup forms
Targets:
Target 1: 1.3622
Extended Target / June Low: 1.3543
If no rejection occurs and price breaks above the zone with conviction, the setup becomes invalid and we reassess.
Execution will be reactive, not predictive — we trade confirmation, not speculation.

US30 - ShortLooking for the Short on US30 final pull back before we see extension to the upside 45,000.

US30 - Intraday long scalp then short Looking for that intraday scalp on the long around 120 points can hold potentially further up to our higher supply level. If bearish PA is confirmed around the 43,000 level can look to take this short. All dependent on PA.
